You are not logged in.
This means you
CAN ONLY VIEW reports that were published prior to Friday, April 18, 2025.
You
MUST UPGRADE YOUR MEMBERSHIP if you want to see any current reports.
AFTER MARKET UPDATE - THURSDAY, FEBRUARY 27TH, 2020
Previous After Market Report Next After Market Report >>>
|
|
|
|
DOW |
-1,190.95 |
25,766.64 |
-4.42% |
|
Volume |
1,761,983,590 |
+34% |
|
Volume |
4,509,149,100 |
+27% |
|
NASDAQ |
-414.29 |
8,566.48 |
-4.61% |
|
Advancers |
302 |
11% |
|
Advancers |
492 |
15% |
|
S&P 500 |
-137.63 |
2,978.76 |
-4.42% |
|
Decliners |
2,494 |
89% |
|
Decliners |
2,732 |
85% |
|
Russell 2000 |
-54.89 |
1,497.87 |
-3.54% |
|
52 Wk Highs |
22 |
|
|
52 Wk Highs |
56 |
|
|
S&P 600 |
-35.19 |
899.84 |
-3.76% |
|
52 Wk Lows |
696 |
|
|
52 Wk Lows |
563 |
|
|
During market corrections it is especially important to reduce exposure, preserve your capital, and just be patient. Be safe!
Disciplined investors know to wait until a new confirmed rally marked by a solid follow-through day. The bold portion of the daily market commentary will note when that happens. For any clarification or additional help applying the fact-based investment system, we invite members to call, or contact us via the inquiry form.
|
 |
Market Correction Intensifies as Technical Damage Grows
Kenneth J. Gruneisen - Passed the CAN SLIM® Master's Exam
The Dow slumped 1190 points, on its largest single day point drop in history. The S&P 500 retreated 4.4%, falling below its 200-day moving average level. The Nasdaq Composite shed 4.6%. Breadth was clearly negative as decliners led advancers by an 8-1 margin on the NYSE and by more than 5-1 on the Nasdaq exchange. The reported volume totals were much higher than the prior session totals on the NYSE and on the Nasdaq exchange, indicative of increasing distributional pressure or selling from the institutional crowd. Leadership was thin as there were only 5 high-ranked companies from the Leaders List that hit a new 52-week high and were listed on the BreakOuts Page, down from the 139 on last Wednesday's session. New 52-week lows totals swelled and easily outnumbered new 52-week highs on the NYSE and on the Nasdaq exchange. The major indices' (M criteria) have come under heavier pressure and earned the label of a "market correction". Disciplined investors know to watch for technical sell signals on a case-by-case basis and stand ready to reduce exposure especially if the market suffers more damaging losses. The Featured Stocks Page provides the most timely analysis on high-ranked leaders. Charts used courtesy of www.stockcharts.com
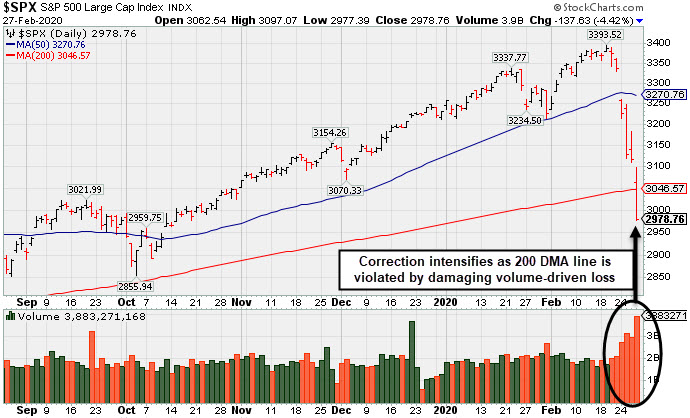
PICTURED: The S&P 500 Index is -12.2% off its all-time high after a 6th consecutive damaging loss marked by heavier volume. It has violated its 50-day and 200-day moving average (DMA) lines.
U.S. stocks tumbled into correction territory on Thursday, and Treasury yields fell to historic lows after the CDC reported the first U.S. coronavirus case of unknown origin. Health officials revealed that the patient had no known ties to an existing outbreak, raising concerns that an outbreak within the U.S. could dent economic activity. Following the worst session since August 2011 for equities, all three major averages are now in correction territory, which is marked by a 10% decline below their record highs.
The perceived “risk-off” mood helped extend a recent rally in Treasuries. The yield on the benchmark 10-year note sank six basis points to a record low of 1.28%, while the yield on the 30-year bond reached an all-time low of 1.78%. On the data front, the second print of U.S. fourth-quarter GDP was unrevised at 2.1%. Initial jobless claims rose to 219,000 in the most recent week, while pending home sales in January jumped to the highest level since 2010.
All 11 S&P 500 sectors fell more than 3% in today’s session. Energy and Real Estate stocks led laggards with each declining more than 5%. Technology stocks also underperformed, with Microsoft (MSFT -7.05%) down after warning that supply chain disruptions related to the coronavirus will prevent the Tech giant from meeting its projections in the personal computing segment. In commodities, WTI crude fell 4.3% to $46.67/barrel, while COMEX gold slipped 0.1% to $1,641.70/ounce. |
 Kenneth J. Gruneisen started out as a licensed stockbroker in August 1987, a couple of months prior to the historic stock market crash that took the Dow Jones Industrial Average down -22.6% in a single day. He has published daily fact-based fundamental and technical analysis on high-ranked stocks online for two decades. Through FACTBASEDINVESTING.COM, Kenneth provides educational articles, news, market commentary, and other information regarding proven investment systems that work in good times and bad.
Comments contained in the body of this report are technical opinions only and are not necessarily those of Gruneisen Growth Corp. The material herein has been obtained from sources believed to be reliable and accurate, however, its accuracy and completeness cannot be guaranteed. Our firm, employees, and customers may effect transactions, including transactions contrary to any recommendation herein, or have positions in the securities mentioned herein or options with respect thereto. Any recommendation contained in this report may not be suitable for all investors and it is not to be deemed an offer or solicitation on our part with respect to the purchase or sale of any securities. |
|
 |
Financial, Retail, Tech, and Commodity-Linked Groups Tumbled
Kenneth J. Gruneisen - Passed the CAN SLIM® Master's Exam
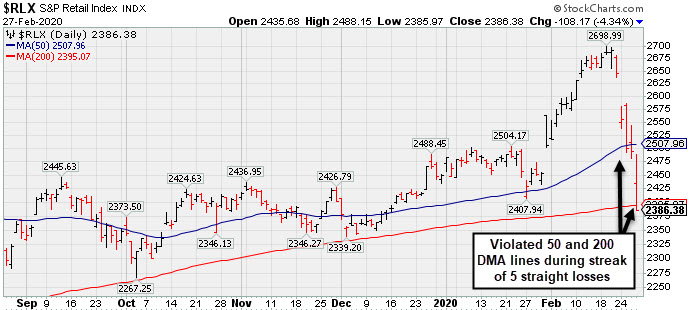
The Bank Index ($BKX -4.21%), Broker/Dealer Index ($XBD -2.99%), and the Retail Index ($RLX -4.34%) each ended solidly lower. The tech sector had a negative bias as the Networking Index ($NWX -3.18%), Biotech Index ($BTK -3.56%), and Semiconductor Index ($SOX -4.65%) suffered unanimous losses. Commodity-linked groups were also hit hard as the Oil Services Index ($OSX -5.42%), Integrated Oil Index ($XOI -5.14%), and Gold & Silver Index ($XAU -7.00%) all lost considerable ground.
PICTURED: The Retail Index ($RLX -4.34%) has abruptly retreated from its record high and violated its 50-day and 200-day moving average (DMA) lines during a streak of 5 consecutive damaging losses.
| Oil Services |
$OSX |
50.77 |
-2.91 |
-5.42% |
-35.15% |
| Integrated Oil |
$XOI |
940.08 |
-50.97 |
-5.14% |
-26.01% |
| Semiconductor |
$SOX |
1,668.65 |
-81.30 |
-4.65% |
-9.78% |
| Networking |
$NWX |
493.55 |
-16.21 |
-3.18% |
-15.40% |
| Broker/Dealer |
$XBD |
271.39 |
-8.37 |
-2.99% |
-6.54% |
| Retail |
$RLX |
2,386.38 |
-108.17 |
-4.34% |
-2.57% |
| Gold & Silver |
$XAU |
99.83 |
-7.52 |
-7.01% |
-6.63% |
| Bank |
$BKX |
93.92 |
-4.12 |
-4.20% |
-17.15% |
| Biotech |
$BTK |
4,818.41 |
-177.63 |
-3.56% |
-4.91% |
|
|
|
 |
50-Day Moving Average Violation Has Hurt Outlook
Kenneth J. Gruneisen - Passed the CAN SLIM® Master's Exam
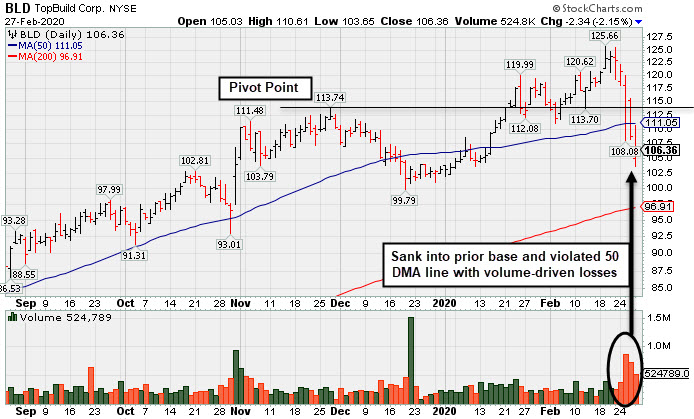
Topbuild Corp (BLD -$2.34 or -2.15% to $106.36) violated its 50-day moving average (DMA) line ($111) triggering a technical sell signal during a streak of 5 consecutive volume-driven losses. Only a prompt rebound above the 50 DMA line would help its outlook improve.
It reported earnings were +23% on +3% sales revenues for the Dec '19 quarter versus the year ago period, its second quarterly comparison just below the +25% minimum guideline (C criteria). Still, it has a 99 Earnings Per Share Rating. Its annual earnings (A criteria) history has also been strong and steady since turning profitable in FY '14.
BLD was last shown in this FSU section on 2/06/20 with an annotated graph under the headline, "Volume Totals Cooling While Consolidating Near All-Time High". It traded up as much as +52.9% since first highlighted in yellow with new pivot point cited based on its 8/12/18 high plus 10 cents in the 5/17/19 mid-day report (read here).
The number of top-rated funds owning its shares rose from 380 in Dec '18 to 525 in Dec '19. Its current Up/Down Volume Ratio of 1.4 is an unbiased indication its shares have been under accumulation over the past 50 days. It has a Timeliness Rating of A, but it still has a Sponsorship Rating of D.
|
|
|
Color Codes Explained :
Y - Better candidates highlighted by our
staff of experts.
G - Previously featured
in past reports as yellow but may no longer be buyable under the
guidelines.
***Last / Change / Volume data in this table is the closing quote data***
Symbol/Exchange
Company Name
Industry Group |
PRICE |
CHANGE
(%Change) |
Day High |
Volume
(% DAV)
(% 50 day avg vol) |
52 Wk Hi
% From Hi |
Featured
Date |
Price
Featured |
Pivot Featured |
|
Max Buy |
 FTNT
-
NASDAQ
FTNT
-
NASDAQ
Fortinet Inc
Computer Sftwr-Security
|
$102.64
|
-3.62
-3.41% |
$106.53
|
3,545,991
291.85% of 50 DAV
50 DAV is 1,215,000
|
$121.82
-15.74%
|
12/9/2019
|
$103.85
|
PP = $106.10
|
|
MB = $111.41
|
 Most Recent Note - 2/27/2020 5:21:30 PM
G - Suffered another damaging loss on higher volume today, slumping further after a gap down on 2/24/20 triggering technical sell signals. A rebound above the 50 DMA line ($113.86) is needed for its outlook to improve.Reported earnings +29% on +21% sales revenues for the Dec '19 quarter, continuing its strong earnings track record above the +25% minimum guideline (C criteria). See the latest FSU analysis for more details and an annotated graph.
>>> FEATURED STOCK ARTICLE : Volume Driven Losses Violated 50-Day Moving Average - 2/26/2020 |
View all notes |
Set NEW NOTE alert |
Company Profile |
SEC
News |
Chart |
Request a new note
C
A
S
I |
SPSC
-
NASDAQ
S P S Commerce Inc
COMPUTER SOFTWARE and SERVICES - Application Software
|
$52.69
|
-1.75
-3.21% |
$54.23
|
234,986
141.47% of 50 DAV
50 DAV is 166,100
|
$62.26
-15.37%
|
11/29/2019
|
$56.59
|
PP = $59.24
|
|
MB = $62.20
|
Most Recent Note - 2/27/2020 5:13:44 PM
It will be dropped from the Featured Stocks list tonight. Violated its 200 DMA line ($53.05). Its current Relative Strength Rating of 56 is below the 80+ minimum guideline for buy candidates.
>>> FEATURED STOCK ARTICLE : 4 Damaging Losses Followed Recent Technical Breakout - 2/24/2020 |
View all notes |
Set NEW NOTE alert |
Company Profile |
SEC
News |
Chart |
Request a new note
C
A
S
I |
AUDC
-
NASDAQ
Audiocodes Ltd
ELECTRONICS - Scientific and Technical Instrum
|
$22.22
|
-1.80
-7.49% |
$23.18
|
458,353
126.27% of 50 DAV
50 DAV is 363,000
|
$28.73
-22.66%
|
9/13/2019
|
$19.68
|
PP = $19.84
|
|
MB = $20.83
|
Most Recent Note - 2/27/2020 4:58:50 PM
It will be dropped from the Featured Stocks list tonight. Gapped down today for a 4th consecutive loss. Met resistance at its 50 DMA line ($24.91) while trying to rebound. Faces resistance due to overhead supply up to the $28 level. Fundamentals remain strong after it reported earnings +30% on +15% sales revenues for the Dec '19 quarter.
>>> FEATURED STOCK ARTICLE : Rebounding After Damaging Losses Triggered Sell Signals - 2/14/2020 |
View all notes |
Set NEW NOTE alert |
Company Profile |
SEC
News |
Chart |
Request a new note
C
A
S
I |
CHDN
-
NASDAQ
Churchill Downs Inc
LEISURE - Gaming Activities
|
$138.86
|
-6.58
-4.52% |
$143.83
|
725,639
353.97% of 50 DAV
50 DAV is 205,000
|
$167.53
-17.11%
|
10/8/2019
|
$129.77
|
PP = $132.83
|
|
MB = $139.47
|
Most Recent Note - 2/27/2020 5:09:17 PM
G - Violated its 50 DMA line ($144) with heavier volume behind today's 6th consecutive loss triggering a technical sell signal. A rebound above the 50 DMA line is needed for its outlook to improve. Reported Dec '19 earnings +100% on +28% sales revenues, and improvement after the Jun and Sep '19 quarterly earnings versus the year ago periods were both below the +25% minimum guideline (C criteria).
>>> FEATURED STOCK ARTICLE : Perched at New Record High After Recent Gains on Average Volume - 2/7/2020 |
View all notes |
Set NEW NOTE alert |
Company Profile |
SEC
News |
Chart |
Request a new note
C
A
S
I |
LULU
-
NASDAQ
Lululemon Athletica
MANUFACTURING - Textile Manufacturing
|
$220.70
|
-17.86
-7.49% |
$232.48
|
2,806,861
184.91% of 50 DAV
50 DAV is 1,518,000
|
$266.20
-17.09%
|
9/6/2019
|
$201.25
|
PP = $194.35
|
|
MB = $204.07
|
Most Recent Note - 2/27/2020 5:04:30 PM
G - Gapped down today and suffered a big loss on heavy volume violating its 50 DMA line ($240) and prior low ($231.84 on 1/27/20) triggering technical sell signals. Only a prompt rebound would help its outlook improve. Fundamentals remain strong.
>>> FEATURED STOCK ARTICLE : Perched at Record High After 4th Consecutive Gain on Light Volume - 2/20/2020 |
View all notes |
Set NEW NOTE alert |
Company Profile |
SEC
News |
Chart |
Request a new note
C
A
S
I |
Symbol/Exchange
Company Name
Industry Group |
PRICE |
CHANGE
(%Change) |
Day High |
Volume
(% DAV)
(% 50 day avg vol) |
52 Wk Hi
% From Hi |
Featured
Date |
Price
Featured |
Pivot Featured |
|
Max Buy |
SPLK
-
NASDAQ
Splunk Inc
Computer Sftwr-Database
|
$146.87
|
-9.64
-6.16% |
$153.97
|
2,769,959
181.99% of 50 DAV
50 DAV is 1,522,000
|
$176.31
-16.70%
|
11/25/2019
|
$147.79
|
PP = $142.16
|
|
MB = $149.27
|
Most Recent Note - 2/27/2020 5:18:32 PM
G - Violated its 50 DMA line ($157.76) with a damaging volume-driven loss raising concerns and triggering a more worrisome technical sell signal. Only a prompt rebound would help its outlook improve.
>>> FEATURED STOCK ARTICLE : Perched at Record High After 7th Consecutive Gain - 2/19/2020 |
View all notes |
Set NEW NOTE alert |
Company Profile |
SEC
News |
Chart |
Request a new note
C
A
S
I |
PAYC
-
NYSE
Paycom Software Inc
COMPUTER SOFTWARE and SERVICES - Application Software
|
$281.36
|
-10.56
-3.62% |
$293.57
|
854,834
91.92% of 50 DAV
50 DAV is 930,000
|
$342.00
-17.73%
|
11/20/2019
|
$252.97
|
PP = $259.81
|
|
MB = $272.80
|
Most Recent Note - 2/27/2020 5:06:29 PM
G - Slumped below its 50 DMA line ($292) with today's loss on average volume raising concerns and triggering a technical sell signal. Only a prompt rebound would help its outlook improve. Fundamentals remain strong after it reported earnings +41% on +29% for the Dec '19 quarter.
>>> FEATURED STOCK ARTICLE : Pulled Back Near 50-Day Average Following Strong Earnings Report - 2/11/2020 |
View all notes |
Set NEW NOTE alert |
Company Profile |
SEC
News |
Chart |
Request a new note
C
A
S
I |
BLD
-
NYSE
Topbuild Corp
Bldg-Constr Prds/Misc
|
$106.36
|
-2.34
-2.15% |
$110.61
|
511,713
165.60% of 50 DAV
50 DAV is 309,000
|
$125.66
-15.36%
|
12/9/2019
|
$109.71
|
PP = $113.84
|
|
MB = $119.53
|
Most Recent Note - 2/27/2020 5:23:10 PM
G - Violated its 50 DMA line ($111) triggering a technical sell signal during a streak of 5 consecutive volume-driven losses. Only a prompt rebound above the 50 DMA line would help its outlook improve.
>>> FEATURED STOCK ARTICLE : 50-Day Moving Average Violation Has Hurt Outlook - 2/27/2020 |
View all notes |
Set NEW NOTE alert |
Company Profile |
SEC
News |
Chart |
Request a new note
C
A
S
I |
TEAM
-
NASDAQ
Atlassian Corp Plc Cl A
Comp Sftwr-Spec Enterprs
|
$143.00
|
-3.50
-2.39% |
$147.00
|
2,167,289
136.82% of 50 DAV
50 DAV is 1,584,000
|
$156.12
-8.40%
|
1/24/2020
|
$144.66
|
PP = $140.49
|
|
MB = $147.51
|
Most Recent Note - 2/27/2020 5:16:30 PM
Y - Showing resilience and still consolidating above its 50 DMA line ($137) amid widespread market weakness (M criteria). Fundamentals remain strong.
>>> FEATURED STOCK ARTICLE : Atlassian Has Been Hovering Near its All-Time High - 2/12/2020 |
View all notes |
Set NEW NOTE alert |
Company Profile |
SEC
News |
Chart |
Request a new note
C
A
S
I |
GLOB
-
NYSE
Globant SA
Computer-Tech Services
|
$109.93
|
-4.09
-3.59% |
$114.66
|
729,014
263.18% of 50 DAV
50 DAV is 277,000
|
$141.67
-22.40%
|
11/14/2019
|
$106.87
|
PP = $112.43
|
|
MB = $118.05
|
Most Recent Note - 2/27/2020 5:02:03 PM
It will be dropped from the Featured Stocks list tonight. Slumped below its 50 DMA line and undercut its old high ($112) during a damaging streak of 4 consecutive volume-driven losses, abruptly retreating from its all-time high. Reported earnings +28% on +32% sales revenues for the Dec '19 quarter, continuing its strong earnings track record.
>>> FEATURED STOCK ARTICLE : Encountering Distributional Pressure After Wedging to New Highs - 2/5/2020 |
View all notes |
Set NEW NOTE alert |
Company Profile |
SEC
News |
Chart |
Request a new note
C
A
S
I |
Symbol/Exchange
Company Name
Industry Group |
PRICE |
CHANGE
(%Change) |
Day High |
Volume
(% DAV)
(% 50 day avg vol) |
52 Wk Hi
% From Hi |
Featured
Date |
Price
Featured |
Pivot Featured |
|
Max Buy |
STNE
-
NASDAQ
Stoneco Ltd Cl A
Finance-CrdtCard/PmtPr
|
$41.85
|
+0.28
0.67% |
$43.96
|
3,931,109
220.72% of 50 DAV
50 DAV is 1,781,000
|
$45.72
-8.46%
|
1/22/2020
|
$43.94
|
PP = $45.72
|
|
MB = $48.01
|
Most Recent Note - 2/27/2020 5:14:49 PM
Y - Finding impressive support near its 50 DMA line ($41.52) despite the worrisome market correction (M criteria). Subsequent gains above the pivot point backed by at least +40% above average volume are needed to trigger a technical buy signal.
>>> FEATURED STOCK ARTICLE : 50-Day Moving Average Line Violation Hurts Outlook - 2/10/2020 |
View all notes |
Set NEW NOTE alert |
Company Profile |
SEC
News |
Chart |
Request a new note
C
A
S
I |
DAVA
-
NYSE
Endava Plc Cl A Ads
Computer-Tech Services
|
$55.12
|
+1.31
2.43% |
$56.76
|
185,335
159.77% of 50 DAV
50 DAV is 116,000
|
$55.75
-1.13%
|
2/13/2020
|
$53.71
|
PP = $49.86
|
|
MB = $52.35
|
Most Recent Note - 2/27/2020 5:11:34 PM
G - Color code is changed to green after hitting a new all-time high today and rallying above its "max buy" level. Prior highs in the $49 area define initial support to watch above its 50 DMA line ($48.30).
>>> FEATURED STOCK ARTICLE : Breakout Gain Backed By +462% Above Average Volme - 2/13/2020 |
View all notes |
Set NEW NOTE alert |
Company Profile |
SEC
News |
Chart |
Request a new note
C
A
S
I |
|
|
|
THESE ARE NOT BUY RECOMMENDATIONS!
Comments contained in the body of this report are technical
opinions only. The material herein has been obtained
from sources believed to be reliable and accurate, however,
its accuracy and completeness cannot be guaranteed.
This site is not an investment advisor, hence it does
not endorse or recommend any securities or other investments.
Any recommendation contained in this report may not
be suitable for all investors and it is not to be deemed
an offer or solicitation on our part with respect to
the purchase or sale of any securities. All trademarks,
service marks and trade names appearing in this report
are the property of their respective owners, and are
likewise used for identification purposes only.
This report is a service available
only to active Paid Premium Members.
You may opt-out of receiving report notifications
at any time. Questions or comments may be submitted
by writing to Premium Membership Services 665 S.E. 10 Street, Suite 201 Deerfield Beach, FL 33441-5634 or by calling 1-800-965-8307
or 954-785-1121.
|
|
|