You are not logged in.
This means you
CAN ONLY VIEW reports that were published prior to Sunday, April 13, 2025.
You
MUST UPGRADE YOUR MEMBERSHIP if you want to see any current reports.
AFTER MARKET UPDATE - MONDAY, MARCH 2ND, 2020
Previous After Market Report Next After Market Report >>>
|
|
|
|
DOW |
+1,293.96 |
26,703.32 |
+5.09% |
|
Volume |
1,714,891,700 |
-30% |
|
Volume |
4,216,763,500 |
-21% |
|
NASDAQ |
+384.79 |
8,952.16 |
+4.49% |
|
Advancers |
2,156 |
81% |
|
Advancers |
2,342 |
72% |
|
S&P 500 |
+136.01 |
3,090.23 |
+4.60% |
|
Decliners |
500 |
19% |
|
Decliners |
920 |
28% |
|
Russell 2000 |
+42.06 |
1,518.49 |
+2.85% |
|
52 Wk Highs |
16 |
|
|
52 Wk Highs |
68 |
|
|
S&P 600 |
+23.11 |
907.89 |
+2.61% |
|
52 Wk Lows |
175 |
|
|
52 Wk Lows |
171 |
|
|
 |
Breadth Positive as Major Indices Rebound From Damaging Losses
Kenneth J. Gruneisen - Passed the CAN SLIM® Master's Exam
The Dow advanced 1,293 points, its largest point gain in history. The S&P 500 rallied 4.6%, its best day since December 2018, while the Nasdaq Composite jumped 4.5%. Breadth was clearly positive as advancers led decliners by more than a 4-1 margin on the NYSE and by more than 2-1 on the Nasdaq exchange. The reported volume totals were lighter than the prior session totals on the NYSE and on the Nasdaq exchange. Leadership remained thin as there were only 5 high-ranked companies from the Leaders List that hit a new 52-week high and were listed on the BreakOuts Page, up from 2 on the prior session. New 52-week lows totals easily outnumbered new 52-week highs on the NYSE and on the Nasdaq exchange. The major indices' (M criteria) have come under heavier pressure and earned the label of a "market correction". Disciplined investors know to watch for technical sell signals on a case-by-case basis and stand ready to reduce exposure especially if the market suffers more damaging losses. The Featured Stocks Page provides the most timely analysis on high-ranked leaders. Charts used courtesy of www.stockcharts.com
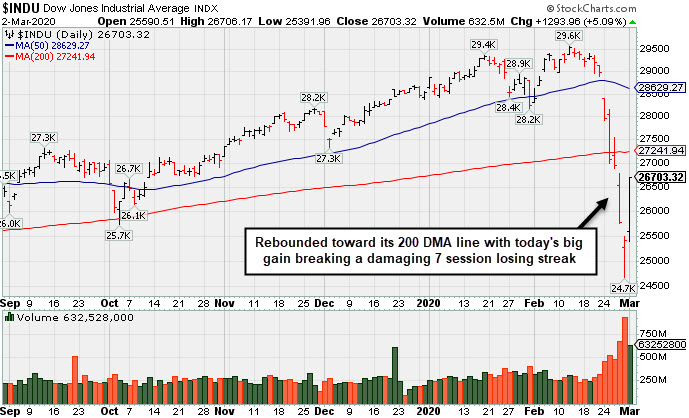
PICTURED: The Dow Jones Industrial Average rebounded toward its 200-day moving average (DMA) line with a big gain breaking a streak of 7 consecutive damaging volume-driven losses. The Blue Chip index is -9.7% off its all-time high hit on 2/12/20.
Stocks finished firmly higher in volatile trading Monday, rebounding from the worst week since the Financial Crisis. Risk sentiment was boosted by expectations that global central banks would intervene to support their economies and help offset any negative impact from the coronavirus.
All S&P 500 sectors closed in firmly positive territory, with Utilities and Technology shares pacing gains. Apple climbed back from a two-year low, surging 9.3% on the heels of an analyst upgrade. Twitter (TWTR +7.89%) rose on reports that Elliott Management founder Paul Singer was looking to replace CEO Jack Dorsey. In M&A news, biotech company Forty Seven (FTSV +61.91%) rose after agreeing to be acquired by Gilead Sciences (GILD +8.71%) in a $4.9 billion deal.
On the data front, a reading from the Institute for Supply Management (ISM) showed U.S. manufacturing activity expanded for a second-straight month in February following a five-month streak of contraction to end 2019. Meanwhile, a gauge of global manufacturing contracted the most since 2009 as the coronavirus disrupted trade and supply chains. Treasuries pared an early session gain to finish modestly higher. The yield on the 10-year note was down one basis point to 1.15% after sliding to a new record low of 1.03% overnight. In commodities, WTI crude gained 4.5% to $46.75/barrel after tumbling more than 16% last week. COMEX gold added 1.3% to $1,586.30/ounce. |
 Kenneth J. Gruneisen started out as a licensed stockbroker in August 1987, a couple of months prior to the historic stock market crash that took the Dow Jones Industrial Average down -22.6% in a single day. He has published daily fact-based fundamental and technical analysis on high-ranked stocks online for two decades. Through FACTBASEDINVESTING.COM, Kenneth provides educational articles, news, market commentary, and other information regarding proven investment systems that work in good times and bad.
Comments contained in the body of this report are technical opinions only and are not necessarily those of Gruneisen Growth Corp. The material herein has been obtained from sources believed to be reliable and accurate, however, its accuracy and completeness cannot be guaranteed. Our firm, employees, and customers may effect transactions, including transactions contrary to any recommendation herein, or have positions in the securities mentioned herein or options with respect thereto. Any recommendation contained in this report may not be suitable for all investors and it is not to be deemed an offer or solicitation on our part with respect to the purchase or sale of any securities. |
|
 |
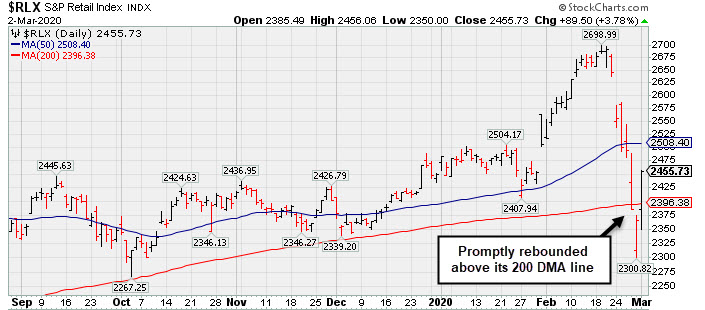
Financial, Retail, Tech, and Commodity-Linked Groups Rose
Kenneth J. Gruneisen - Passed the CAN SLIM® Master's Exam
The Bank Index ($BKX +4.25%) and Broker/Dealer Index ($XBD +4.33%) both outpaced the Retail Index ($RLX +3.78%) with solid gains on Monday. The tech sector had a positive bias as the Networking Index ($NWX +2.20%), Biotech Index ($BTK +2.91%), and Semiconductor Index ($SOX +3.51%) each notched solid gains. Commodity-linked groups also had a positive bias as the Oil Services Index ($OSX +2.86%), Integrated Oil Index ($XOI +1.74%), and the Gold & Silver Index ($XAU +3.96%) rounded out the widely positive session with solid gains.
PICTURED: The Retail Index ($RLX +3.78%) halted its slide on Monday and promptly rebounded above its 200-day moving average (DMA) line.
| Oil Services |
$OSX |
53.60 |
+1.49 |
+2.86% |
-31.54% |
| Integrated Oil |
$XOI |
968.85 |
+16.55 |
+1.74% |
-23.75% |
| Semiconductor |
$SOX |
1,765.38 |
+59.84 |
+3.51% |
-4.55% |
| Networking |
$NWX |
502.08 |
+10.80 |
+2.20% |
-13.94% |
| Broker/Dealer |
$XBD |
277.81 |
+11.52 |
+4.33% |
-4.33% |
| Retail |
$RLX |
2,455.73 |
+89.50 |
+3.78% |
+0.26% |
| Gold & Silver |
$XAU |
97.87 |
+3.72 |
+3.95% |
-8.46% |
| Bank |
$BKX |
95.52 |
+3.90 |
+4.26% |
-15.74% |
| Biotech |
$BTK |
5,031.93 |
+142.23 |
+2.91% |
-0.70% |
|
|
|
 |
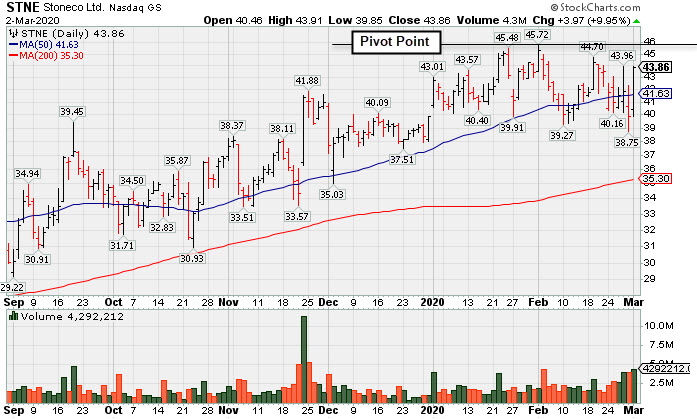
Volume-Driven Gain Above 50-Day Moving Average
Kenneth J. Gruneisen - Passed the CAN SLIM® Master's Exam
Stoneco Ltd Cl A (STNE +$3.97 or +9.95% to $43.86) rebounded above its 50-day moving average (DMA) line ($41.63) with a big volume-driven gain today and its color code is changed to yellow. The worrisome market correction (M criteria) remains a cause for concern, even if there are subsequent gains above the pivot point backed by at least +40% above average volume to trigger a technical buy signal. More damaging losses below the prior session low ($38.75) may raise concerns and trigger a worrisome technical sell signal.
It reported earnings +71% on +43% sales revenues for the Dec '19 quarter, and prior quarterly comparisons were strong. It has an 84 Earnings Per Share rating. STNE was highlighted in yellow with pivot point cited based on its 4/02/19 high plus 10 cents in the 1/22/20 mid-day report (read here). It faces little remaining resistance due to overhead supply.
This Brazil-based Finance - Credit Card/Payment Processing company has shown resilience since last shown in this FSU section on 2/10/20 with an annotated graph under the headline, "50-Day Moving Average Line Violation Hurts Outlook". STNE completed a Secondary Offering on 4/03/18 and went through a deep consolidation Completed its $24 IPO on 10/25/18. The number of top-rated funds owning its shares rose from 175 in Mar '19 to 263 in Dec '19, a reassuring sign concerning the I criteria. Its current Up/Down Volume Ratio of 1.0 is an unbiased indication its shares have been neutral concerning accumulation/distribution over the past 50 days. It has a Timeliness Rating of A and Sponsorship Rating of A. |
|
|
Color Codes Explained :
Y - Better candidates highlighted by our
staff of experts.
G - Previously featured
in past reports as yellow but may no longer be buyable under the
guidelines.
***Last / Change / Volume data in this table is the closing quote data***
Symbol/Exchange
Company Name
Industry Group |
PRICE |
CHANGE
(%Change) |
Day High |
Volume
(% DAV)
(% 50 day avg vol) |
52 Wk Hi
% From Hi |
Featured
Date |
Price
Featured |
Pivot Featured |
|
Max Buy |
 FTNT
-
NASDAQ
FTNT
-
NASDAQ
Fortinet Inc
Computer Sftwr-Security
|
$110.10
|
+8.04
7.88% |
$110.19
|
2,663,488
203.16% of 50 DAV
50 DAV is 1,311,000
|
$121.82
-9.62%
|
12/9/2019
|
$103.85
|
PP = $106.10
|
|
MB = $111.41
|
 Most Recent Note - 3/2/2020 5:31:47 PM
G - Posted a solid gain today following damaging volume-driven losses. A rebound above the 50 DMA line ($113.83) is needed for its outlook to improve. Reported earnings +29% on +21% sales revenues for the Dec '19 quarter, continuing its strong earnings track record above the +25% minimum guideline (C criteria).
>>> FEATURED STOCK ARTICLE : Volume Driven Losses Violated 50-Day Moving Average - 2/26/2020 |
View all notes |
Set NEW NOTE alert |
Company Profile |
SEC
News |
Chart |
Request a new note
C
A
S
I |
LULU
-
NASDAQ
Lululemon Athletica
MANUFACTURING - Textile Manufacturing
|
$228.90
|
+11.49
5.28% |
$229.21
|
2,324,442
156.11% of 50 DAV
50 DAV is 1,489,000
|
$266.20
-14.01%
|
9/6/2019
|
$201.25
|
PP = $194.35
|
|
MB = $204.07
|
Most Recent Note - 3/2/2020 5:33:10 PM
G - Posted a solid gain today after damaging losses with heavy volume triggered noted technical sell signals. Only a prompt rebound above the 50 DMA line ($240) would help its outlook improve. Fundamentals remain strong.
>>> FEATURED STOCK ARTICLE : Perched at Record High After 4th Consecutive Gain on Light Volume - 2/20/2020 |
View all notes |
Set NEW NOTE alert |
Company Profile |
SEC
News |
Chart |
Request a new note
C
A
S
I |
SPLK
-
NASDAQ
Splunk Inc
Computer Sftwr-Database
|
$152.02
|
+4.69
3.18% |
$152.20
|
2,167,244
140.18% of 50 DAV
50 DAV is 1,546,000
|
$176.31
-13.78%
|
11/25/2019
|
$147.79
|
PP = $142.16
|
|
MB = $149.27
|
Most Recent Note - 3/2/2020 5:36:25 PM
G - Damaging volume-driven losses raised concerns and triggered a technical sell signal last week. Only a prompt rebound above the 50 DMA line ($158) would help its outlook improve.
>>> FEATURED STOCK ARTICLE : Perched at Record High After 7th Consecutive Gain - 2/19/2020 |
View all notes |
Set NEW NOTE alert |
Company Profile |
SEC
News |
Chart |
Request a new note
C
A
S
I |
PAYC
-
NYSE
Paycom Software Inc
COMPUTER SOFTWARE and SERVICES - Application Software
|
$291.96
|
+9.31
3.29% |
$292.33
|
793,746
82.68% of 50 DAV
50 DAV is 960,000
|
$342.00
-14.63%
|
11/20/2019
|
$252.97
|
PP = $259.81
|
|
MB = $272.80
|
Most Recent Note - 3/2/2020 5:34:51 PM
G - Rebounded near its 50 DMA line ($293) today. Additional gains above that important short-term average still are needed to help its outlook improve. Fundamentals remain strong after it reported earnings +41% on +29% for the Dec '19 quarter.
>>> FEATURED STOCK ARTICLE : Pulled Back Near 50-Day Average Following Strong Earnings Report - 2/11/2020 |
View all notes |
Set NEW NOTE alert |
Company Profile |
SEC
News |
Chart |
Request a new note
C
A
S
I |
TEAM
-
NASDAQ
Atlassian Corp Plc Cl A
Comp Sftwr-Spec Enterprs
|
$146.82
|
+1.86
1.28% |
$149.83
|
2,044,591
127.31% of 50 DAV
50 DAV is 1,606,000
|
$156.12
-5.96%
|
1/24/2020
|
$144.66
|
PP = $140.49
|
|
MB = $147.51
|
Most Recent Note - 3/2/2020 5:37:54 PM
Y - Posted a 2nd consecutive gain with above average volume, showing resilience and still consolidating above its 50 DMA line ($138) amid widespread market weakness (M criteria). Fundamentals remain strong.
>>> FEATURED STOCK ARTICLE : Atlassian Has Been Hovering Near its All-Time High - 2/12/2020 |
View all notes |
Set NEW NOTE alert |
Company Profile |
SEC
News |
Chart |
Request a new note
C
A
S
I |
Symbol/Exchange
Company Name
Industry Group |
PRICE |
CHANGE
(%Change) |
Day High |
Volume
(% DAV)
(% 50 day avg vol) |
52 Wk Hi
% From Hi |
Featured
Date |
Price
Featured |
Pivot Featured |
|
Max Buy |
STNE
-
NASDAQ
Stoneco Ltd Cl A
Finance-CrdtCard/PmtPr
|
$43.86
|
+3.97
9.95% |
$43.91
|
4,290,973
227.76% of 50 DAV
50 DAV is 1,884,000
|
$45.72
-4.07%
|
1/22/2020
|
$43.94
|
PP = $45.72
|
|
MB = $48.01
|
Most Recent Note - 3/2/2020 5:30:25 PM
Y - Color code is changed to yellow a volume-driven gain helped it promptly rebound above its 50 DMA line ($41.63). Reported earnings +71%v on +43% sales revenues for the Dec '19 quarter, continuing its strong earnings track record. The worrisome market correction (M criteria) is also cause for concern, even if there are subsequent gains above the pivot point backed by at least +40% above average volume to trigger a technical buy signal. See the latest FSU analysis for more details and a new annotated graph.
>>> FEATURED STOCK ARTICLE : Volume-Driven Gain Above 50-Day Moving Average - 3/2/2020 |
View all notes |
Set NEW NOTE alert |
Company Profile |
SEC
News |
Chart |
Request a new note
C
A
S
I |
DAVA
-
NYSE
Endava Plc Cl A Ads
Computer-Tech Services
|
$53.03
|
-0.02
-0.04% |
$53.79
|
185,744
151.01% of 50 DAV
50 DAV is 123,000
|
$56.76
-6.57%
|
2/13/2020
|
$53.71
|
PP = $49.86
|
|
MB = $52.35
|
Most Recent Note - 3/2/2020 12:36:24 PM
G - Still perched near its all-time high, which makes it an outlier in a very weak market (M criteria). Prior highs in the $49 area define initial support to watch above its 50 DMA line ($48.57).
>>> FEATURED STOCK ARTICLE : Breakout Gain Backed By +462% Above Average Volme - 2/13/2020 |
View all notes |
Set NEW NOTE alert |
Company Profile |
SEC
News |
Chart |
Request a new note
C
A
S
I |
|
|
|
THESE ARE NOT BUY RECOMMENDATIONS!
Comments contained in the body of this report are technical
opinions only. The material herein has been obtained
from sources believed to be reliable and accurate, however,
its accuracy and completeness cannot be guaranteed.
This site is not an investment advisor, hence it does
not endorse or recommend any securities or other investments.
Any recommendation contained in this report may not
be suitable for all investors and it is not to be deemed
an offer or solicitation on our part with respect to
the purchase or sale of any securities. All trademarks,
service marks and trade names appearing in this report
are the property of their respective owners, and are
likewise used for identification purposes only.
This report is a service available
only to active Paid Premium Members.
You may opt-out of receiving report notifications
at any time. Questions or comments may be submitted
by writing to Premium Membership Services 665 S.E. 10 Street, Suite 201 Deerfield Beach, FL 33441-5634 or by calling 1-800-965-8307
or 954-785-1121.
|
|
|