You are not logged in.
This means you
CAN ONLY VIEW reports that were published prior to Tuesday, April 15, 2025.
You
MUST UPGRADE YOUR MEMBERSHIP if you want to see any current reports.
AFTER MARKET UPDATE - WEDNESDAY, FEBRUARY 19TH, 2014
Previous After Market Report Next After Market Report >>>
|
|
|
|
DOW |
-89.84 |
16,040.56 |
-0.56% |
|
Volume |
687,765,340 |
-3% |
|
Volume |
1,800,406,390 |
+3% |
|
NASDAQ |
-34.83 |
4,237.95 |
-0.82% |
|
Advancers |
1,081 |
34% |
|
Advancers |
736 |
27% |
|
S&P 500 |
-12.01 |
1,828.75 |
-0.65% |
|
Decliners |
1,970 |
62% |
|
Decliners |
1,859 |
69% |
|
Russell 2000 |
-12.42 |
1,149.07 |
-1.07% |
|
52 Wk Highs |
162 |
|
|
52 Wk Highs |
142 |
|
|
S&P 600 |
-6.33 |
647.65 |
-0.97% |
|
52 Wk Lows |
15 |
|
|
52 Wk Lows |
10 |
|
|
 |
Leadership Waned as Major Averages Fell
Kenneth J. Gruneisen - Passed the CAN SLIM® Master's Exam
The major averages lost ground on Wednesday and they ended at their worst levels of the session. The volume totals were reported mixed, slightly higher than the prior trading session's volume totals on the Nasdaq exchange and slightly lower on the NYSE. Breadth was negative as advancers trailed decliners by nearly a 2-1 ratio on the NYSE and 5-2 on the Nasdaq exchange. There were 48 high-ranked companies from the CANSLIM.net Leaders List that made new 52-week highs and appeared on the CANSLIM.net BreakOuts Page, down from the total of 75 stocks on the prior session. The list of stocks hitting new 52-week highs easily outnumbered new 52-week lows on the Nasdaq exchange and on the NYSE. There were gains for only 3 of the 11 high-ranked companies currently included on the Featured Stocks Page. The Market (M criteria) environment has been noted as a "Confirmed Uptrend". For any rally to be sustained it is critical for there to be healthy leadership, so it remains crucial for many stocks to continue hitting new 52-week highs.
The S&P 500 shed 12 points to 1,828 and the NASDAQ was off 34 points with the index closing at 4,237. Despite the losses both indices are still above their respective 50-day moving average (DMA) lines after recently resuming a rally. Stocks were choppy throughout Wednesday's session as investors digested a batch of mixed economic reports and combed through the FOMC's January meeting minutes.
Energy stocks were active as crude oil prices advanced +1% to $103.44 per barrel and natural gas prices rose to a 4-year high. On the earnings front, CF Industries (CF +5%) rose after the company posted quarterly results that topped analysts’ expectations. Panera Bread (PNRA +3.6%) rose despite lowering their current-quarter earnings outlook.
Turning to fixed income markets, Treasuries ended lower along the curve. The benchmark 10-year note was down 3/16 of a point to yield 2.74% and the 30-year bond gave up 1/2 of a point to yield 3.71%.
The CANSLIM.net Featured Stocks Page shows the most action-worthy candidates and their latest notes and a Headline Link directs members to the latest detailed analysis with data-packed graphs annotated by a Certified expert along with links to additional resources. The Premium Member Homepage includes "dynamic archives" to all prior pay reports published. Watch for an announcement via email concerning the next WEBCAST.
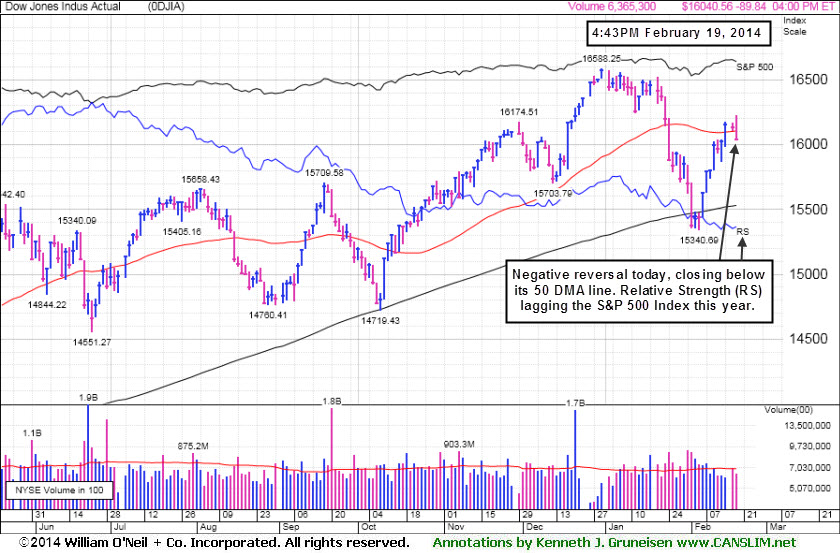
PICTURED: The Dow Jones Industrial Average gave up 89 points to 16,040 after being up by as many as 95 points in early action. Its "negative reversal" was particularly worrisome because it also led to a close below its 50-day moving average (DMA) line. The Blue Chip Index's Relative Strength (RS) versus the S&P 500 Index has waned this year, as indicated by the jagged blue line.
|
 Kenneth J. Gruneisen started out as a licensed stockbroker in August 1987, a couple of months prior to the historic stock market crash that took the Dow Jones Industrial Average down -22.6% in a single day. He has published daily fact-based fundamental and technical analysis on high-ranked stocks online for two decades. Through FACTBASEDINVESTING.COM, Kenneth provides educational articles, news, market commentary, and other information regarding proven investment systems that work in good times and bad.
Comments contained in the body of this report are technical opinions only and are not necessarily those of Gruneisen Growth Corp. The material herein has been obtained from sources believed to be reliable and accurate, however, its accuracy and completeness cannot be guaranteed. Our firm, employees, and customers may effect transactions, including transactions contrary to any recommendation herein, or have positions in the securities mentioned herein or options with respect thereto. Any recommendation contained in this report may not be suitable for all investors and it is not to be deemed an offer or solicitation on our part with respect to the purchase or sale of any securities. |
|
 |
Broad-Based Pullback Dragged Most Groups Lower
Kenneth J. Gruneisen - Passed the CAN SLIM® Master's Exam
The Gold & Silver Index ($XAU -3.27%) was a standout decliner while most industry groups ended in the red on Wednesday. Financial shares were a negative influence on the major averages as the Bank Index ($BKX -1.98%) and Broker/Dealer Index ($XBD -1.44%) both lost ground. The Retail Index ($RLX -0.98%) slumped and the Biotechnology Index ($BTK -1.48%) and Networking Index ($NWX -0.86%) both fell while the Semiconductor Index ($SOX -0.08%) held its ground. The Integrated Oil Index ($XOI -0.16%) finished slightly lower and the Oil Services Index ($OSX +0.43%) was a standout with a modest gain.
Charts courtesy www.stockcharts.com
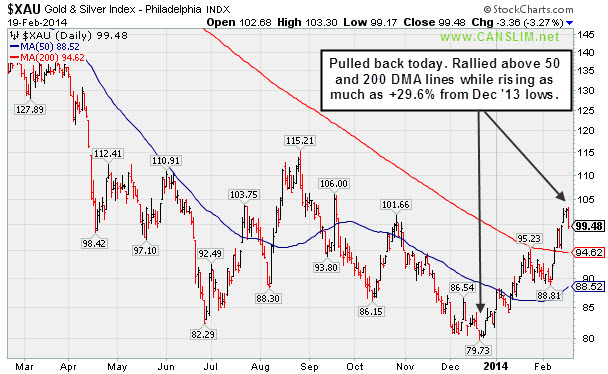
PICTURED: The Gold & Silver Index ($XAU -3.27%) pulled back on Wednesday's session. It has rallied above its 50-day and 200-day moving average (DMA) lines while trading up as much as +29.6% from its December 2013 lows.
| Oil Services |
$OSX |
276.04 |
+1.19 |
+0.43% |
-1.78% |
| Integrated Oil |
$XOI |
1,458.26 |
-2.34 |
-0.16% |
-2.99% |
| Semiconductor |
$SOX |
560.02 |
-0.43 |
-0.08% |
+4.67% |
| Networking |
$NWX |
346.15 |
-2.99 |
-0.86% |
+6.85% |
| Broker/Dealer |
$XBD |
156.73 |
-2.30 |
-1.44% |
-2.39% |
| Retail |
$RLX |
890.42 |
-8.81 |
-0.98% |
-5.25% |
| Gold & Silver |
$XAU |
99.48 |
-3.36 |
-3.27% |
+18.22% |
| Bank |
$BKX |
67.37 |
-1.36 |
-1.98% |
-2.73% |
| Biotech |
$BTK |
2,661.46 |
-40.06 |
-1.48% |
+14.20% |
|
|
|
 |
Extended From Sound Base and Wedging Higher
Kenneth J. Gruneisen - Passed the CAN SLIM® Master's Exam
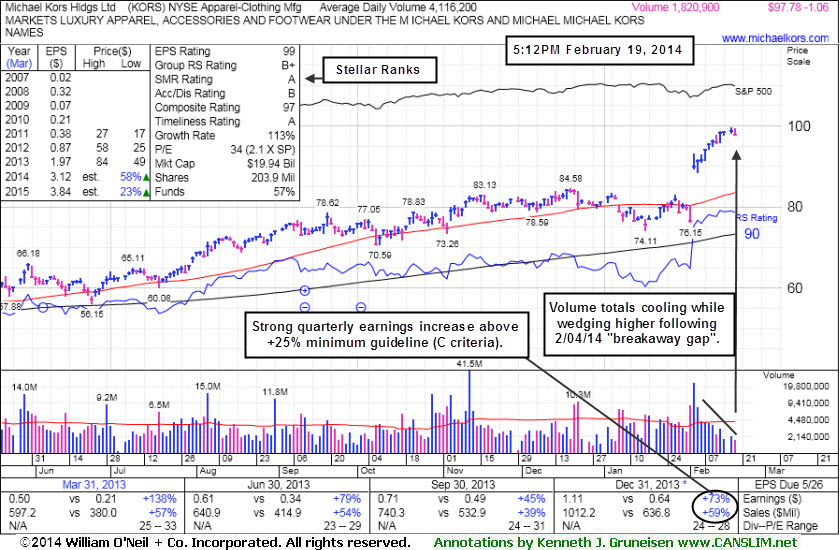
Michael Kors Hldgs Ltd (KORS -$1.06 or -1.07% to $97.78) is perched at its 52-week high today, very extended from its prior base. Volume totals have been cooling in recent weeks while wedging higher following its considerable 2/04/14 "breakaway gap". Prior highs in the $84 area define the nearest chart support level. Disciplined investors avoid chasing extended stocks.
KORS gapped up immediately following its last appearance in this FSU section on 2/03/14 with annotated graphs under the headline, "Down on Higher Volume Ahead of Quarterly Earnings Report". The company reported +73% earnings on +59% sales revenues for the Dec '13 quarter, continuing its strong earnings history (meeting C and A criteria). The action demonstrates how fundamental news can sometimes have an immediate and substantial impact on share price.
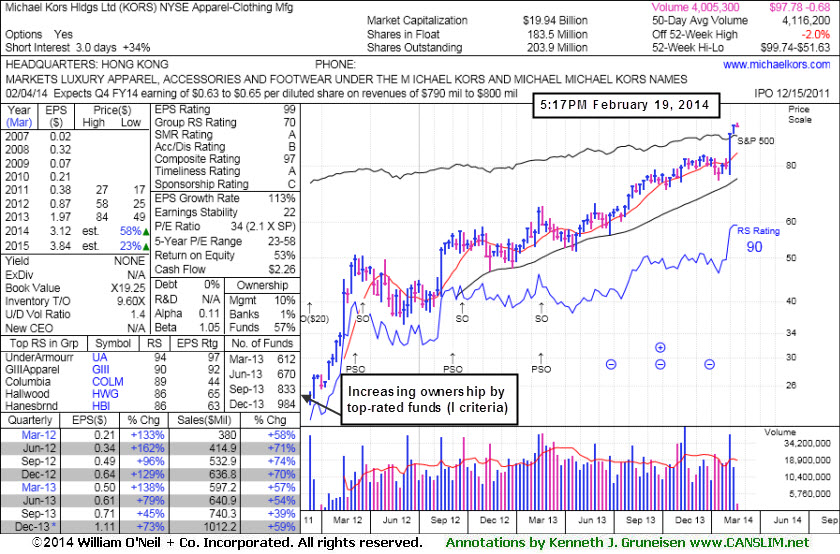
This high-ranked Apparel - Clothing Manufacturing firm has headquarters in Hong Kong. It completed Secondary Offerings on 9/25/12 and 2/20/13, each time while perched near its all-time highs. Prior reports noted - "Such offerings often are a short-term hindrance to upward price progress yet typically result in broader institutional ownership interest." The number of top-rated funds owning its shares rose from 326 in Mar '12 to 984 in Dec '13, a reassuring sign concerning the I criteria.
|
|
|
Color Codes Explained :
Y - Better candidates highlighted by our
staff of experts.
G - Previously featured
in past reports as yellow but may no longer be buyable under the
guidelines.
***Last / Change / Volume data in this table is the closing quote data***
Symbol/Exchange
Company Name
Industry Group |
PRICE |
CHANGE
(%Change) |
Day High |
Volume
(% DAV)
(% 50 day avg vol) |
52 Wk Hi
% From Hi |
Featured
Date |
Price
Featured |
Pivot Featured |
|
Max Buy |
EQM
-
NYSE
E Q T Midstream Partners
ENERGY - Oil and Gas Pipelines
|
$65.42
|
-1.44
-2.15% |
$66.87
|
170,406
149.48% of 50 DAV
50 DAV is 114,000
|
$67.80
-3.51%
|
12/12/2013
|
$53.17
|
PP = $56.51
|
|
MB = $59.34
|
Most Recent Note - 2/18/2014 6:39:40 PM
G - Rallied for a best-ever close with 2 times average volume behind today's gain. Reported earnings -2% on +22% sales revenues for the Dec '13 quarter, below the +25% minimum earnings guideline (C criteria) raising fundamental concerns. Prior reports cautioned members - "It is extended from any sound base pattern. Prior highs in the $56 area define support to watch on pullbacks."
>>> FEATURED STOCK ARTICLE : Leader Still Extended From Any Sound Base - 2/7/2014
View all notes |
Set NEW NOTE alert |
CANSLIM.net Company Profile |
SEC
News |
Chart |
Request a new note
C
A N
S L
I M


|
FB
-
NASDAQ
Facebook Inc Cl A
INTERNET
|
$68.06
|
+0.76
1.13% |
$69.08
|
56,407,544
87.25% of 50 DAV
50 DAV is 64,654,000
|
$67.58
0.71%
|
12/12/2013
|
$51.40
|
PP = $54.93
|
|
MB = $57.68
|
Most Recent Note - 2/13/2014 4:17:40 PM
G - Finished near the session high today with a big gain on near average volume. It is extended well beyond the "secondary buy point" recently noted. Prior highs near $58 define important near-term support to watch on pullbacks. Disciplined investors avoid chasing extended stocks.
>>> FEATURED STOCK ARTICLE : Volume Totals Cooling While Holding Ground at Highs - 2/6/2014
View all notes |
Set NEW NOTE alert |
CANSLIM.net Company Profile |
SEC
News |
Chart |
Request a new note
C
A N
S L
I M
|
GNRC
-
NYSE
Generac Hldgs Inc
Electrical-Power/Equipmt
|
$55.26
|
-1.03
-1.83% |
$56.31
|
988,253
108.72% of 50 DAV
50 DAV is 909,000
|
$57.68
-4.20%
|
2/14/2014
|
$56.50
|
PP = $57.39
|
|
MB = $60.26
|
Most Recent Note - 2/14/2014 5:46:38 PM
Y - Reported earnings +28% on +10% sales revenues for the Dec '13 quarter, continuing its strong earnings history satisfying the C criteria. Gapped up on the prior session completing a bullish "island reversal" helping its technical stance improve by rebounding from below its 50 DMA line to touch new 52-week highs. Highlighted in yellow in the mid-day report (read here) with a new pivot point based on its 1/06/14 high plus 10 cents. Convincing volume-driven gains into new high territory may confirm a new technical buy signal. See the latest FSU analysis for more details and new annotated graphs.
>>> FEATURED STOCK ARTICLE : Following Island Reversal Prior Highs May Act as Resistance - 2/14/2014
View all notes |
Set NEW NOTE alert |
CANSLIM.net Company Profile |
SEC
News |
Chart |
Request a new note
C
A N
S L
I M
|
JAZZ
-
NASDAQ
Jazz Pharmaceuticals Plc
DRUGS - Biotechnology
|
$170.28
|
-1.63
-0.95% |
$175.00
|
1,339,639
145.30% of 50 DAV
50 DAV is 922,000
|
$172.68
-1.39%
|
9/30/2013
|
$93.20
|
PP = $89.10
|
|
MB = $93.56
|
Most Recent Note - 2/18/2014 6:30:17 PM
G - Hit new 52-week and all-time highs with today's considerable volume-driven gain amid strength in the group inspired by M&A action. It is extended from any sound base. Its 50 DMA line and recent lows in the $135 area define important support to watch on pullbacks.
>>> FEATURED STOCK ARTICLE : Consolidating After Getting Very Extended - 2/5/2014
View all notes |
Set NEW NOTE alert |
CANSLIM.net Company Profile |
SEC
News |
Chart |
Request a new note
C
A N
S L
I M
|
KORS
-
NYSE
Michael Kors Hldgs Ltd
RETAIL - Apparel Stores
|
$97.78
|
-1.06
-1.07% |
$99.42
|
1,820,863
44.24% of 50 DAV
50 DAV is 4,116,000
|
$99.74
-1.97%
|
2/4/2014
|
$90.92
|
PP = $84.68
|
|
MB = $88.91
|
 Most Recent Note - 2/19/2014 6:09:44 PM
G - Perched at its 52-week high after wedging higher, very extended from its prior base. Prior highs in the $84 area define the nearest chart support level. See the latest FSU analysis for more details and new annotated graphs.
>>> FEATURED STOCK ARTICLE : Extended From Sound Base and Wedging Higher - 2/19/2014
View all notes |
Set NEW NOTE alert |
CANSLIM.net Company Profile |
SEC
News |
Chart |
Request a new note
C
A N
S L
I M
|
Symbol/Exchange
Company Name
Industry Group |
PRICE |
CHANGE
(%Change) |
Day High |
Volume
(% DAV)
(% 50 day avg vol) |
52 Wk Hi
% From Hi |
Featured
Date |
Price
Featured |
Pivot Featured |
|
Max Buy |
PCLN
-
NASDAQ
Priceline.com Inc
INTERNET - Internet Software and Services
|
$1,273.76
|
-27.88
-2.14% |
$1,309.00
|
1,062,435
163.20% of 50 DAV
50 DAV is 651,000
|
$1,313.82
-3.05%
|
12/18/2013
|
$1,156.20
|
PP = $1,198.85
|
|
MB = $1,258.79
|
Most Recent Note - 2/14/2014 12:22:09 PM
G - Perched at its 52-week high with above average volume behind its 7th consecutive gain. Rallying with no resistance remaining due to overhead supply. Color code was changed to green after rallying above its "max buy" level. See the latest FSU analysis for more details and new annotated graphs.
>>> FEATURED STOCK ARTICLE : Extended From Prior Highs After 6th Straight Gain - 2/13/2014
View all notes |
Set NEW NOTE alert |
CANSLIM.net Company Profile |
SEC
News |
Chart |
Request a new note
C
A N
S L
I M
|
RGR
-
NYSE
Sturm Ruger & Co Inc
CONSUMER DURABLES - Sporting Goods
|
$71.00
|
-1.86
-2.55% |
$72.82
|
468,514
88.40% of 50 DAV
50 DAV is 530,000
|
$85.93
-17.37%
|
1/8/2014
|
$78.87
|
PP = $80.38
|
|
MB = $84.40
|
Most Recent Note - 2/18/2014 6:34:49 PM
G- Sputtering below its 50 DMA line which recently acted as resistance. Its Relative Strength rating has slumped to 78, below the 80+ minimum guideline for buy candidates. Faces overhead supply up through the $85 level after recent distributional action.
>>> FEATURED STOCK ARTICLE : Slumped Into Prior Base Negating Breakout and Violated 50-Day Average - 2/4/2014
View all notes |
Set NEW NOTE alert |
CANSLIM.net Company Profile |
SEC
News |
Chart |
Request a new note
C
A N
S L
I M
|
SFUN
-
NYSE
Soufun Hldgs Ltd Ads A
INTERNET - Internet Information Providers
|
$81.53
|
+0.56
0.69% |
$83.77
|
2,647,931
183.63% of 50 DAV
50 DAV is 1,442,000
|
$95.39
-14.53%
|
10/17/2013
|
$58.02
|
PP = $53.87
|
|
MB = $56.56
|
Most Recent Note - 2/18/2014 6:36:15 PM
G - Consolidating near its 50 DMA line but it has not formed a sound base. See the latest FSU analysis for more details and new annotated graphs.
>>> FEATURED STOCK ARTICLE : Finding Support Near 50-Day Moving Average Line - 2/18/2014
View all notes |
Set NEW NOTE alert |
CANSLIM.net Company Profile |
SEC
News |
Chart |
Request a new note
C
A N
S L
I M
|
SILC
-
NASDAQ
Silicom Ltd
COMPUTER HARDWARE - Networking andamp; Communication Dev
|
$67.20
|
-1.39
-2.03% |
$69.03
|
121,749
184.47% of 50 DAV
50 DAV is 66,000
|
$68.81
-2.34%
|
12/23/2013
|
$44.62
|
PP = $46.25
|
|
MB = $48.56
|
Most Recent Note - 2/18/2014 6:32:56 PM
G - Rallied for yet another new 52-week high with today's volume-driven gain. Extended from any sound base after 9 consecutive weekly gains. Disciplined investors avoid chasing extended stocks.
>>> FEATURED STOCK ARTICLE : Stubbornly Held Ground Following Breakaway Gap - 2/11/2014
View all notes |
Set NEW NOTE alert |
CANSLIM.net Company Profile |
SEC
News |
Chart |
Request a new note
C
A N
S L
I M
|
ULTI
-
NASDAQ
Ultimate Software Group
INTERNET - Internet Software and Services
|
$166.40
|
+0.04
0.02% |
$168.62
|
185,761
93.35% of 50 DAV
50 DAV is 199,000
|
$168.43
-1.21%
|
1/27/2014
|
$153.75
|
PP = $162.98
|
|
MB = $171.13
|
Most Recent Note - 2/13/2014 4:22:17 PM
Y - Considerable gain today with near average volume for a best-ever close. Found support above its 50 DMA line following a worrisome "negative reversal" on 2/05/14. Fundamentals remain strong after solid Dec '13 earnings. See the latest FSU analysis for more details and new annotated graphs.
>>> FEATURED STOCK ARTICLE : Stalled and Encountering Distributional Pressure - 2/12/2014
View all notes |
Set NEW NOTE alert |
CANSLIM.net Company Profile |
SEC
News |
Chart |
Request a new note
C
A N
S L
I M
|
Symbol/Exchange
Company Name
Industry Group |
PRICE |
CHANGE
(%Change) |
Day High |
Volume
(% DAV)
(% 50 day avg vol) |
52 Wk Hi
% From Hi |
Featured
Date |
Price
Featured |
Pivot Featured |
|
Max Buy |
VRX
-
NYSE
Valeant Pharmaceuticals
DRUGS - Drug Manufacturers - Other
|
$145.02
|
-1.45
-0.99% |
$147.41
|
1,788,654
132.69% of 50 DAV
50 DAV is 1,348,000
|
$147.20
-1.48%
|
9/11/2013
|
$100.26
|
PP = $105.50
|
|
MB = $110.78
|
Most Recent Note - 2/18/2014 12:50:12 PM
G - Hitting new all-time highs today with another considerable gain, getting more extended from any sound base. Its 50 DMA line ($125) defines near-term support to watch.
>>> FEATURED STOCK ARTICLE : Hovering Near All-Time Highs Extended From Sound Base - 2/10/2014
View all notes |
Set NEW NOTE alert |
CANSLIM.net Company Profile |
SEC
News |
Chart |
Request a new note
C
A N
S L
I M
|
|
|
|
THESE ARE NOT BUY RECOMMENDATIONS!
Comments contained in the body of this report are technical
opinions only. The material herein has been obtained
from sources believed to be reliable and accurate, however,
its accuracy and completeness cannot be guaranteed.
This site is not an investment advisor, hence it does
not endorse or recommend any securities or other investments.
Any recommendation contained in this report may not
be suitable for all investors and it is not to be deemed
an offer or solicitation on our part with respect to
the purchase or sale of any securities. All trademarks,
service marks and trade names appearing in this report
are the property of their respective owners, and are
likewise used for identification purposes only.
This report is a service available
only to active Paid Premium Members.
You may opt-out of receiving report notifications
at any time. Questions or comments may be submitted
by writing to Premium Membership Services 665 S.E. 10 Street, Suite 201 Deerfield Beach, FL 33441-5634 or by calling 1-800-965-8307
or 954-785-1121.
|
|
|

