You are not logged in.
This means you
CAN ONLY VIEW reports that were published prior to Tuesday, April 15, 2025.
You
MUST UPGRADE YOUR MEMBERSHIP if you want to see any current reports.
AFTER MARKET UPDATE - TUESDAY, FEBRUARY 18TH, 2014
Previous After Market Report Next After Market Report >>>
|
|
|
|
DOW |
-23.99 |
16,130.40 |
-0.15% |
|
Volume |
708,598,750 |
+16% |
|
Volume |
1,750,358,550 |
+1% |
|
NASDAQ |
+27.62 |
4,271.65 |
+0.65% |
|
Advancers |
2,028 |
65% |
|
Advancers |
1,810 |
67% |
|
S&P 500 |
+2.13 |
1,840.76 |
+0.12% |
|
Decliners |
1,003 |
32% |
|
Decliners |
811 |
30% |
|
Russell 2000 |
+12.27 |
1,161.48 |
+1.07% |
|
52 Wk Highs |
226 |
|
|
52 Wk Highs |
183 |
|
|
S&P 600 |
+5.36 |
653.98 |
+0.83% |
|
52 Wk Lows |
21 |
|
|
52 Wk Lows |
14 |
|
|
 |
Positive Breadth While Major Averages Ended Mixed
Kenneth J. Gruneisen - Passed the CAN SLIM® Master's Exam
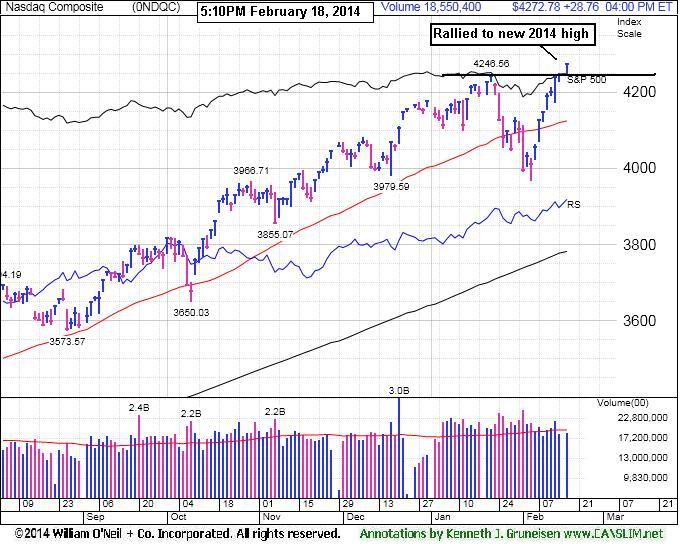
Equities kicked off the abbreviated trading week on a relatively quiet note. Small caps finished in the lead (Russell 2000 Index +1.0%) while the S&P 500 added +0.1% on Tuesday as the major averages finished mixed. The volume totals were reported higher than the prior trading session's volume totals on the Nasdaq exchange and on the NYSE. Breadth was positive as advancers led decliners by about a 2-1 ratio on the NYSE and 9-4 positive on the Nasdaq exchange. There were 75 high-ranked companies from the CANSLIM.net Leaders List that made new 52-week highs and appeared on the CANSLIM.net BreakOuts Page, up from the total of 49 stocks on the prior session. The list of stocks hitting new 52-week highs expanded and easily outnumbered new 52-week lows on the Nasdaq exchange and on the NYSE. There were gains for 9 of the 11 high-ranked companies currently included on the Featured Stocks Page. The Market (M criteria) environment has been noted as a "Confirmed Uptrend" after a brief correction recently raised caution flags. For any rally to be sustained it is critical for there to be healthy leadership, so it encouraging to see many stocks hitting new 52-week highs.
Early weakness was erased promptly thanks to strength of the health care sector. Actavis (ACT +5.0%) agreed to acquire Forest Laboratories (FRX +27.52%) for $25 billion. Biotechnology also factored into the sector's strength as the iShares Nasdaq Biotechnology ETF (IBB +2.61%) rallied.
Outside of health care, gains in other sectors were much more subdued. Energy-linked shares were aided by crude oil, which surged +2.2% to $102.52 per barrel. Similar to crude, precious metals enjoyed another strong session. Gold futures rose +0.4% while silver futures saw their ninth day of gains, spiking +2.2% to $21.91 per ounce.
The Dow Jones Transportation Average (-1.0%) fell below its 50-day moving average as 16 of its 20 components registered losses. Most notably, Kansas City Southern (KSU -4.47%) slumped after JP Morgan Chase & Co (JPM +0.58%) downgraded the stock to 'Neutral' from 'Overweight.'
Dow component Coca-Cola (KO -3.75%) pressured the staples sector after reporting in-line earnings on below-consensus revenue.
Treasuries ended near their best levels of the day with the 10-yr yield down four basis points at 2.71%.
The CANSLIM.net Featured Stocks Page shows the most action-worthy candidates and their latest notes and a Headline Link directs members to the latest detailed analysis with data-packed graphs annotated by a Certified expert along with links to additional resources. The Premium Member Homepage includes "dynamic archives" to all prior pay reports published. Watch for an announcement via email concerning the next WEBCAST.
PICTURED: The Nasdaq Composite Index rallied to new 2014 highs, leading its peers as the first index to rise above recent highs.
|
 Kenneth J. Gruneisen started out as a licensed stockbroker in August 1987, a couple of months prior to the historic stock market crash that took the Dow Jones Industrial Average down -22.6% in a single day. He has published daily fact-based fundamental and technical analysis on high-ranked stocks online for two decades. Through FACTBASEDINVESTING.COM, Kenneth provides educational articles, news, market commentary, and other information regarding proven investment systems that work in good times and bad.
Comments contained in the body of this report are technical opinions only and are not necessarily those of Gruneisen Growth Corp. The material herein has been obtained from sources believed to be reliable and accurate, however, its accuracy and completeness cannot be guaranteed. Our firm, employees, and customers may effect transactions, including transactions contrary to any recommendation herein, or have positions in the securities mentioned herein or options with respect thereto. Any recommendation contained in this report may not be suitable for all investors and it is not to be deemed an offer or solicitation on our part with respect to the purchase or sale of any securities. |
|
 |
Broker/Dealer Index, Tech, & Commodity-Linked Groups Led Gainers
Kenneth J. Gruneisen - Passed the CAN SLIM® Master's Exam
The Broker/Dealer Index ($XBD +1.50%) posted a solid gain while the Bank Index ($BKX -0.15%) edged lower and the Retail Index ($RLX +0.09%) finished virtually unchanged. The Biotechnology Index ($BTK +2.58%) led the tech sector higher while the Networking Index ($NWX +1.21%) posted a solid gain and the Semiconductor Index ($SOX +0.24%) edged higher. Commodity-linked groups rose as the Gold & Silver Index ($XAU +0.83%), Integrated Oil Index ($XOI +0.48%), and the Oil Services Index ($OSX +0.94%) posted gains.
Charts courtesy www.stockcharts.com

PICTURED: The Integrated Oil Index ($XOI +0.48%) has rebounded above its 50-day moving average (DMA) line.
| Oil Services |
$OSX |
274.85 |
+2.57 |
+0.94% |
-2.20% |
| Integrated Oil |
$XOI |
1,460.60 |
+7.02 |
+0.48% |
-2.83% |
| Semiconductor |
$SOX |
560.45 |
+1.33 |
+0.24% |
+4.75% |
| Networking |
$NWX |
349.14 |
+4.17 |
+1.21% |
+7.78% |
| Broker/Dealer |
$XBD |
159.02 |
+2.35 |
+1.50% |
-0.96% |
| Retail |
$RLX |
899.23 |
+0.81 |
+0.09% |
-4.32% |
| Gold & Silver |
$XAU |
102.84 |
+0.85 |
+0.83% |
+22.21% |
| Bank |
$BKX |
68.73 |
-0.10 |
-0.15% |
-0.77% |
| Biotech |
$BTK |
2,701.52 |
+67.89 |
+2.58% |
+15.92% |
|
|
|
 |
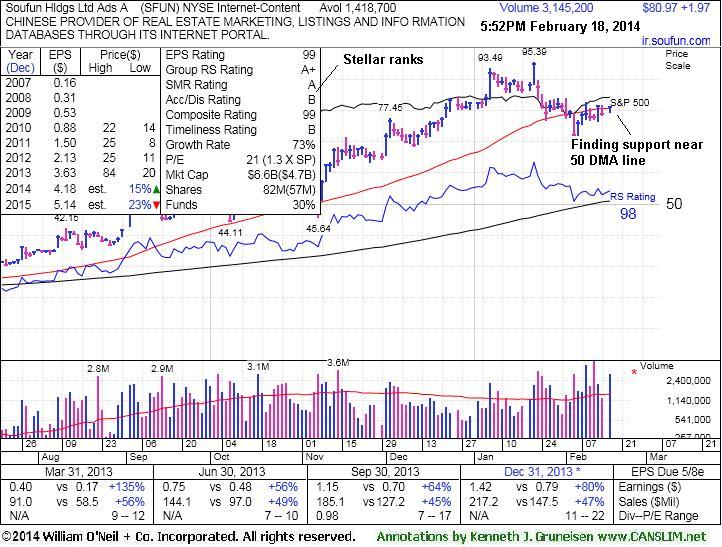
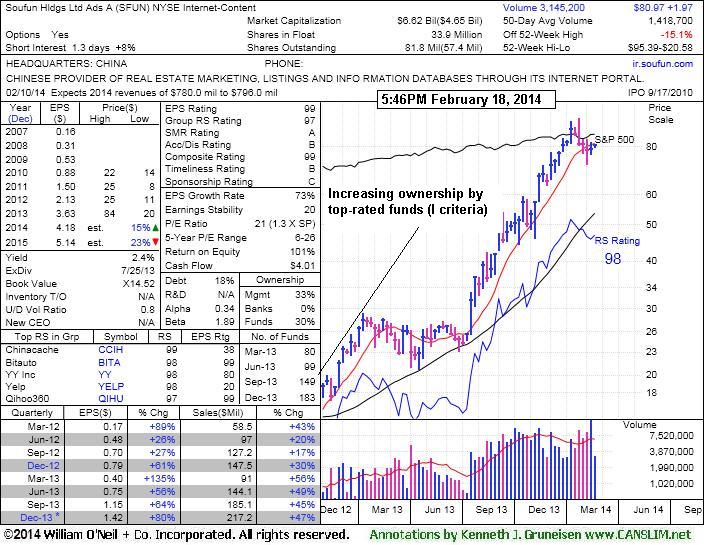
Finding Support Near 50-Day Moving Average Line
Kenneth J. Gruneisen - Passed the CAN SLIM® Master's Exam
Soufun Hldgs Ltd Ads (SFUN +$1.97 or +2.49% to $80.97) has been consolidating near its 50-day moving average (DMA) line and tallied a solid gain today with above average volume. It has not formed a sound base. Disciplined investors avoid chasing extended stocks. It traded up as much as +247% since first featured in the 2/11/13 mid-day report in yellow (read here). The high-ranked Internet - Content firm has been enduring distributional pressure while retreating from its 52-week high since last shown in this FSU section on 1/31/14 with annotated graphs under the headline, "50-Day Moving Average Defines Near Term Support After Great Rally". It has been repeatedly noted as very extended from any sound base. Its prior low ($71.77 on 2/06/14) defines important support below its 50 DMA line ($80.70 now). Deterioration below the 50 DMA line or recent lows may trigger worrisome technical sell signals.
Fundamentals remain strong as it reported +80% earnings on +47% sales revenues for the Dec '13 quarter versus the year ago period, solidly satisfying the C criteria. The number of top-rated funds owning its shares rose from 67 in Sep '12 to 183 in Dec '13, a reassuring sign concerning the I criteria. Its small supply (S criteria) of only 33.9 million shares in the public float can contribute to greater price volatility in the event of institutional buying or selling.
|
|
|
Color Codes Explained :
Y - Better candidates highlighted by our
staff of experts.
G - Previously featured
in past reports as yellow but may no longer be buyable under the
guidelines.
***Last / Change / Volume data in this table is the closing quote data***
Symbol/Exchange
Company Name
Industry Group |
PRICE |
CHANGE
(%Change) |
Day High |
Volume
(% DAV)
(% 50 day avg vol) |
52 Wk Hi
% From Hi |
Featured
Date |
Price
Featured |
Pivot Featured |
|
Max Buy |
EQM
-
NYSE
E Q T Midstream Partners
ENERGY - Oil and Gas Pipelines
|
$66.86
|
+1.86
2.86% |
$67.26
|
221,074
199.17% of 50 DAV
50 DAV is 111,000
|
$67.80
-1.39%
|
12/12/2013
|
$53.17
|
PP = $56.51
|
|
MB = $59.34
|
 Most Recent Note - 2/18/2014 6:39:40 PM
G - Rallied for a best-ever close with 2 times average volume behind today's gain. Reported earnings -2% on +22% sales revenues for the Dec '13 quarter, below the +25% minimum earnings guideline (C criteria) raising fundamental concerns. Prior reports cautioned members - "It is extended from any sound base pattern. Prior highs in the $56 area define support to watch on pullbacks."
>>> FEATURED STOCK ARTICLE : Leader Still Extended From Any Sound Base - 2/7/2014
View all notes |
Set NEW NOTE alert |
CANSLIM.net Company Profile |
SEC
News |
Chart |
Request a new note
C
A N
S L
I M


|
FB
-
NASDAQ
Facebook Inc Cl A
INTERNET
|
$67.30
|
+0.21
0.31% |
$67.54
|
43,815,463
67.41% of 50 DAV
50 DAV is 64,995,000
|
$67.58
-0.41%
|
12/12/2013
|
$51.40
|
PP = $54.93
|
|
MB = $57.68
|
Most Recent Note - 2/13/2014 4:17:40 PM
G - Finished near the session high today with a big gain on near average volume. It is extended well beyond the "secondary buy point" recently noted. Prior highs near $58 define important near-term support to watch on pullbacks. Disciplined investors avoid chasing extended stocks.
>>> FEATURED STOCK ARTICLE : Volume Totals Cooling While Holding Ground at Highs - 2/6/2014
View all notes |
Set NEW NOTE alert |
CANSLIM.net Company Profile |
SEC
News |
Chart |
Request a new note
C
A N
S L
I M
|
GNRC
-
NYSE
Generac Hldgs Inc
Electrical-Power/Equipmt
|
$56.29
|
-0.31
-0.55% |
$57.50
|
1,140,926
125.51% of 50 DAV
50 DAV is 909,000
|
$57.68
-2.41%
|
2/14/2014
|
$56.50
|
PP = $57.39
|
|
MB = $60.26
|
Most Recent Note - 2/14/2014 5:46:38 PM
Y - Reported earnings +28% on +10% sales revenues for the Dec '13 quarter, continuing its strong earnings history satisfying the C criteria. Gapped up on the prior session completing a bullish "island reversal" helping its technical stance improve by rebounding from below its 50 DMA line to touch new 52-week highs. Highlighted in yellow in the mid-day report (read here) with a new pivot point based on its 1/06/14 high plus 10 cents. Convincing volume-driven gains into new high territory may confirm a new technical buy signal. See the latest FSU analysis for more details and new annotated graphs.
>>> FEATURED STOCK ARTICLE : Following Island Reversal Prior Highs May Act as Resistance - 2/14/2014
View all notes |
Set NEW NOTE alert |
CANSLIM.net Company Profile |
SEC
News |
Chart |
Request a new note
C
A N
S L
I M
|
JAZZ
-
NASDAQ
Jazz Pharmaceuticals Plc
DRUGS - Biotechnology
|
$171.91
|
+11.81
7.38% |
$172.68
|
1,459,550
160.21% of 50 DAV
50 DAV is 911,000
|
$163.68
5.03%
|
9/30/2013
|
$93.20
|
PP = $89.10
|
|
MB = $93.56
|
Most Recent Note - 2/18/2014 6:30:17 PM
G - Hit new 52-week and all-time highs with today's considerable volume-driven gain amid strength in the group inspired by M&A action. It is extended from any sound base. Its 50 DMA line and recent lows in the $135 area define important support to watch on pullbacks.
>>> FEATURED STOCK ARTICLE : Consolidating After Getting Very Extended - 2/5/2014
View all notes |
Set NEW NOTE alert |
CANSLIM.net Company Profile |
SEC
News |
Chart |
Request a new note
C
A N
S L
I M
|
KORS
-
NYSE
Michael Kors Hldgs Ltd
RETAIL - Apparel Stores
|
$98.84
|
+0.38
0.39% |
$99.74
|
2,184,417
52.93% of 50 DAV
50 DAV is 4,127,000
|
$98.81
0.03%
|
2/4/2014
|
$90.92
|
PP = $84.68
|
|
MB = $88.91
|
Most Recent Note - 2/13/2014 4:19:08 PM
G - Hit another new 52-week high today, getting very extended from its prior base. Prior highs in the $84 area define the nearest chart support level. Disciplined investors avoid chasing extended stocks.
>>> FEATURED STOCK ARTICLE : Down on Higher Volume Ahead of Quarterly Earnings Report - 2/3/2014
View all notes |
Set NEW NOTE alert |
CANSLIM.net Company Profile |
SEC
News |
Chart |
Request a new note
C
A N
S L
I M
|
Symbol/Exchange
Company Name
Industry Group |
PRICE |
CHANGE
(%Change) |
Day High |
Volume
(% DAV)
(% 50 day avg vol) |
52 Wk Hi
% From Hi |
Featured
Date |
Price
Featured |
Pivot Featured |
|
Max Buy |
PCLN
-
NASDAQ
Priceline.com Inc
INTERNET - Internet Software and Services
|
$1,301.64
|
+21.66
1.69% |
$1,313.82
|
1,111,323
174.19% of 50 DAV
50 DAV is 638,000
|
$1,284.70
1.32%
|
12/18/2013
|
$1,156.20
|
PP = $1,198.85
|
|
MB = $1,258.79
|
Most Recent Note - 2/14/2014 12:22:09 PM
G - Perched at its 52-week high with above average volume behind its 7th consecutive gain. Rallying with no resistance remaining due to overhead supply. Color code was changed to green after rallying above its "max buy" level. See the latest FSU analysis for more details and new annotated graphs.
>>> FEATURED STOCK ARTICLE : Extended From Prior Highs After 6th Straight Gain - 2/13/2014
View all notes |
Set NEW NOTE alert |
CANSLIM.net Company Profile |
SEC
News |
Chart |
Request a new note
C
A N
S L
I M
|
RGR
-
NYSE
Sturm Ruger & Co Inc
CONSUMER DURABLES - Sporting Goods
|
$72.86
|
-0.58
-0.79% |
$74.07
|
408,965
109.94% of 50 DAV
50 DAV is 372,000
|
$85.93
-15.21%
|
1/8/2014
|
$78.87
|
PP = $80.38
|
|
MB = $84.40
|
Most Recent Note - 2/18/2014 6:34:49 PM
G- Sputtering below its 50 DMA line which recently acted as resistance. Its Relative Strength rating has slumped to 78, below the 80+ minimum guideline for buy candidates. Faces overhead supply up through the $85 level after recent distributional action.
>>> FEATURED STOCK ARTICLE : Slumped Into Prior Base Negating Breakout and Violated 50-Day Average - 2/4/2014
View all notes |
Set NEW NOTE alert |
CANSLIM.net Company Profile |
SEC
News |
Chart |
Request a new note
C
A N
S L
I M
|
SFUN
-
NYSE
Soufun Hldgs Ltd Ads A
INTERNET - Internet Information Providers
|
$80.97
|
+1.97
2.49% |
$81.50
|
3,145,300
221.81% of 50 DAV
50 DAV is 1,418,000
|
$95.39
-15.12%
|
10/17/2013
|
$58.02
|
PP = $53.87
|
|
MB = $56.56
|
Most Recent Note - 2/18/2014 6:36:15 PM
G - Consolidating near its 50 DMA line but it has not formed a sound base. See the latest FSU analysis for more details and new annotated graphs.
>>> FEATURED STOCK ARTICLE : Finding Support Near 50-Day Moving Average Line - 2/18/2014
View all notes |
Set NEW NOTE alert |
CANSLIM.net Company Profile |
SEC
News |
Chart |
Request a new note
C
A N
S L
I M
|
SILC
-
NASDAQ
Silicom Ltd
COMPUTER HARDWARE - Networking andamp; Communication Dev
|
$68.59
|
+2.81
4.27% |
$68.81
|
108,981
170.28% of 50 DAV
50 DAV is 64,000
|
$66.39
3.32%
|
12/23/2013
|
$44.62
|
PP = $46.25
|
|
MB = $48.56
|
Most Recent Note - 2/18/2014 6:32:56 PM
G - Rallied for yet another new 52-week high with today's volume-driven gain. Extended from any sound base after 9 consecutive weekly gains. Disciplined investors avoid chasing extended stocks.
>>> FEATURED STOCK ARTICLE : Stubbornly Held Ground Following Breakaway Gap - 2/11/2014
View all notes |
Set NEW NOTE alert |
CANSLIM.net Company Profile |
SEC
News |
Chart |
Request a new note
C
A N
S L
I M
|
ULTI
-
NASDAQ
Ultimate Software Group
INTERNET - Internet Software and Services
|
$166.36
|
+2.71
1.66% |
$166.49
|
225,539
115.07% of 50 DAV
50 DAV is 196,000
|
$168.43
-1.23%
|
1/27/2014
|
$153.75
|
PP = $162.98
|
|
MB = $171.13
|
Most Recent Note - 2/13/2014 4:22:17 PM
Y - Considerable gain today with near average volume for a best-ever close. Found support above its 50 DMA line following a worrisome "negative reversal" on 2/05/14. Fundamentals remain strong after solid Dec '13 earnings. See the latest FSU analysis for more details and new annotated graphs.
>>> FEATURED STOCK ARTICLE : Stalled and Encountering Distributional Pressure - 2/12/2014
View all notes |
Set NEW NOTE alert |
CANSLIM.net Company Profile |
SEC
News |
Chart |
Request a new note
C
A N
S L
I M
|
Symbol/Exchange
Company Name
Industry Group |
PRICE |
CHANGE
(%Change) |
Day High |
Volume
(% DAV)
(% 50 day avg vol) |
52 Wk Hi
% From Hi |
Featured
Date |
Price
Featured |
Pivot Featured |
|
Max Buy |
VRX
-
NYSE
Valeant Pharmaceuticals
DRUGS - Drug Manufacturers - Other
|
$146.47
|
+6.90
4.94% |
$147.20
|
2,208,738
166.57% of 50 DAV
50 DAV is 1,326,000
|
$142.82
2.56%
|
9/11/2013
|
$100.26
|
PP = $105.50
|
|
MB = $110.78
|
Most Recent Note - 2/18/2014 12:50:12 PM
G - Hitting new all-time highs today with another considerable gain, getting more extended from any sound base. Its 50 DMA line ($125) defines near-term support to watch.
>>> FEATURED STOCK ARTICLE : Hovering Near All-Time Highs Extended From Sound Base - 2/10/2014
View all notes |
Set NEW NOTE alert |
CANSLIM.net Company Profile |
SEC
News |
Chart |
Request a new note
C
A N
S L
I M
|
|
|
|
THESE ARE NOT BUY RECOMMENDATIONS!
Comments contained in the body of this report are technical
opinions only. The material herein has been obtained
from sources believed to be reliable and accurate, however,
its accuracy and completeness cannot be guaranteed.
This site is not an investment advisor, hence it does
not endorse or recommend any securities or other investments.
Any recommendation contained in this report may not
be suitable for all investors and it is not to be deemed
an offer or solicitation on our part with respect to
the purchase or sale of any securities. All trademarks,
service marks and trade names appearing in this report
are the property of their respective owners, and are
likewise used for identification purposes only.
This report is a service available
only to active Paid Premium Members.
You may opt-out of receiving report notifications
at any time. Questions or comments may be submitted
by writing to Premium Membership Services 665 S.E. 10 Street, Suite 201 Deerfield Beach, FL 33441-5634 or by calling 1-800-965-8307
or 954-785-1121.
|
|
|

