You are not logged in.
This means you
CAN ONLY VIEW reports that were published prior to Friday, April 11, 2025.
You
MUST UPGRADE YOUR MEMBERSHIP if you want to see any current reports.
AFTER MARKET UPDATE - THURSDAY, FEBRUARY 6TH, 2014
Previous After Market Report Next After Market Report >>>
|
|
|
|
DOW |
+188.30 |
15,628.53 |
+1.22% |
|
Volume |
729,607,080 |
-1% |
|
Volume |
1,801,224,720 |
-9% |
|
NASDAQ |
+45.57 |
4,057.12 |
+1.14% |
|
Advancers |
2,322 |
73% |
|
Advancers |
1,684 |
63% |
|
S&P 500 |
+21.79 |
1,773.43 |
+1.24% |
|
Decliners |
737 |
23% |
|
Decliners |
890 |
33% |
|
Russell 2000 |
+10.33 |
1,103.93 |
+0.94% |
|
52 Wk Highs |
43 |
|
|
52 Wk Highs |
43 |
|
|
S&P 600 |
+6.87 |
626.83 |
+1.11% |
|
52 Wk Lows |
36 |
|
|
52 Wk Lows |
34 |
|
|
 |
New Highs List Expanded as Indices Rose With Less Volume Convition
Kenneth J. Gruneisen - Passed the CAN SLIM® Master's Exam
The major averages rallied on Thursday's session. The volume totals was reported lighter than the prior trading session's volume totals on the Nasdaq exchange and on the NYSE, suggesting that institutional buying demand was not behind the gains. Breadth was positive as advancers led decliners by a 3-1 ratio on the NYSE and by almost 2-1 on the Nasdaq exchange. There were 16 high-ranked companies from the CANSLIM.net Leaders List that made new 52-week highs and appeared on the CANSLIM.net BreakOuts Page, up from the total of 6 stocks on the prior session. The list of stocks hitting new 52-week highs outnumbered new 52-week lows on the Nasdaq exchange and on the NYSE, an encouraging improvement. There were gains for 7 of the 12 high-ranked companies currently included on the Featured Stocks Page, a list that has recently been waning. The Market (M criteria) has encountered distributional pressure and leadership (stocks hitting new highs) has waned, earning the label of being in another "correction". Such weakness serves as a reminder for investors to use caution and remain disciplined in following proper sell rules under the fact-based investment system to reduce market exposure.
The Dow climbed 188 points to 15,628. The S&P 500 gained 22 points to 1,773. The NASDAQ climbed 46 points to close at 4,057.
The major averages finished higher to pare this week’s retreat following an encouraging weekly jobless claims report. The release by the Labor Department showed first time filings for unemployment benefits declined to 331,000 from a revised prior reading of 351,000. Stocks also gained ahead of Friday's jobs report. Non-farm payrolls likely rose 180,000 in January, while the unemployment held steady at 6.7%.
On the earnings front, Walt Disney (DIS +5.30%) rose as quarterly results topped projections. Twitter (TWTR -24.16%) dove after reporting a larger-than-expected loss and slowing user growth.
Gains were broad-based with nine of 10 sectors in the S&P 500 up on the session. Consumer discretionary and materials were the top performing groups. O’Reilly’s Automotive (ORLY +9.04%) and Cliffs Natural Resources (CLF +8.22%) posted big gains. Shares of Green Mountain Coffee Roasters (GMCR +26.24%) surged after Coca-Cola (KO +1.12%) agreed to buy a 10% stake in the company.
Treasuries declined for a third straight session. Benchmark 10-year notes fell 8/32 to yield 2.70%.
Investors should be watchful for any individual issues flashing technical sell signals. The CANSLIM.net Featured Stocks Page shows the most action-worthy candidates and their latest notes and a Headline Link directs members to the latest detailed analysis with data-packed graphs annotated by a Certified expert along with links to additional resources. The Premium Member Homepage includes "dynamic archives" to all prior pay reports published. Watch for an announcement via email concerning the next WEBCAST.
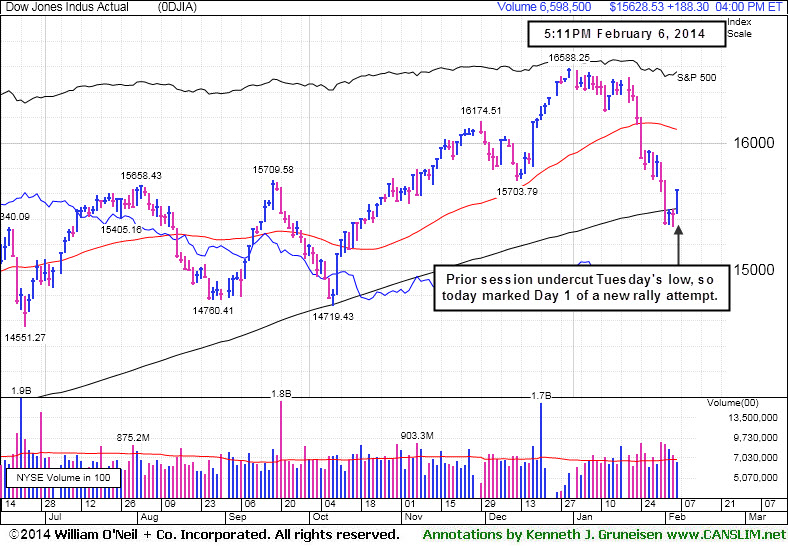
PICTURED: The Dow Jones Industrrial Average posted a big gain to close well above its 200-day moving average (DMA) line. The gains marked Day 1 of a new rally attempt, since prior session's lows undercut Tuesday's lows for all of the major indices. Under the fact-based investment system it is most ideal for at least one of the major averages to produce as solid follow-through day (FTD) of big gains on higher volume between Days 4-7 of a new rally effort. Tuesday could be the earliest session for the market to produce such a convincing FTD which could give investors a green light to again get proactive on new buying effforts. Meanwhile, patience and discipline may be critical to investors' success.
|
 Kenneth J. Gruneisen started out as a licensed stockbroker in August 1987, a couple of months prior to the historic stock market crash that took the Dow Jones Industrial Average down -22.6% in a single day. He has published daily fact-based fundamental and technical analysis on high-ranked stocks online for two decades. Through FACTBASEDINVESTING.COM, Kenneth provides educational articles, news, market commentary, and other information regarding proven investment systems that work in good times and bad.
Comments contained in the body of this report are technical opinions only and are not necessarily those of Gruneisen Growth Corp. The material herein has been obtained from sources believed to be reliable and accurate, however, its accuracy and completeness cannot be guaranteed. Our firm, employees, and customers may effect transactions, including transactions contrary to any recommendation herein, or have positions in the securities mentioned herein or options with respect thereto. Any recommendation contained in this report may not be suitable for all investors and it is not to be deemed an offer or solicitation on our part with respect to the purchase or sale of any securities. |
|
 |
Retail, Financial, Tech and Energy-Related Groups Rose
Kenneth J. Gruneisen - Passed the CAN SLIM® Master's Exam
The Bank Index ($BKX +1.74%) and the Broker/Dealer Index ($XBD +1.39%) had a positive influence on the major averages with solid gains. The Retail Index ($RLX +2.30%) and the Semiconductor Index ($SOX +1.58%) and Networking Index ($NWX +2.42%) both rallied while the Biotechnology Index ($BTK -0.35%) lagged the other tech indices. Energy-related shares also gained ground as the Integrated Oil Index ($XOI +1.44%) and the Oil Services Index ($OSX +2.12%) rose. The Gold & Silver Index ($XAU -0.04%) finished flat.
Charts courtesy www.stockcharts.com
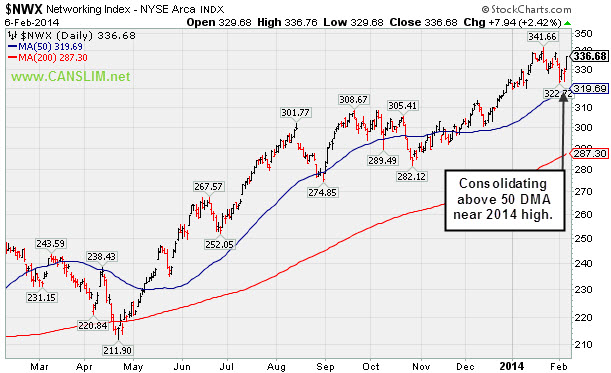
PICTURED: The Networking Index ($NWX +2.42%) is consolidating above its 50-day moving average (DMA) line and near its 2014 highs.
| Oil Services |
$OSX |
264.51 |
+5.48 |
+2.12% |
-5.88% |
| Integrated Oil |
$XOI |
1,395.33 |
+19.86 |
+1.44% |
-7.17% |
| Semiconductor |
$SOX |
526.67 |
+8.21 |
+1.58% |
-1.56% |
| Networking |
$NWX |
336.68 |
+7.94 |
+2.42% |
+3.93% |
| Broker/Dealer |
$XBD |
151.47 |
+2.08 |
+1.39% |
-5.66% |
| Retail |
$RLX |
871.65 |
+19.63 |
+2.30% |
-7.25% |
| Gold & Silver |
$XAU |
89.42 |
-0.04 |
-0.04% |
+6.26% |
| Bank |
$BKX |
67.26 |
+1.15 |
+1.74% |
-2.89% |
| Biotech |
$BTK |
2,437.57 |
-8.46 |
-0.35% |
+4.60% |
|
|
|
 |
Volume Totals Cooling While Holding Ground at Highs
Kenneth J. Gruneisen - Passed the CAN SLIM® Master's Exam
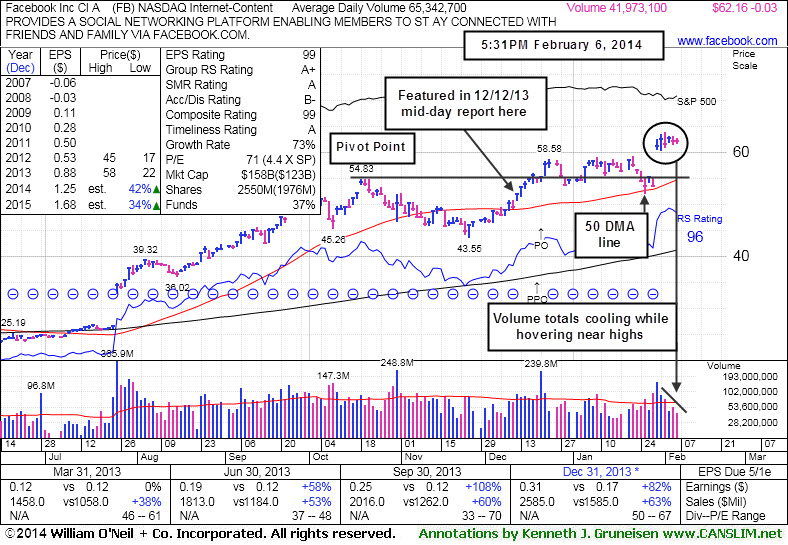
Facebook Inc (FB -$0.03 or -0.05% to $62.16) has seen volume totals cooling while remaining perched very near its all-time highs. It reported earnings +82% on +63% sales revenues for the Dec '13 quarter and then gapped up and hit a new 52-week high. That marked its 3rd quarterly comparison with earnings above the +25% minimum (C criteria). Sequential acceleration in quarterly sales and strong earnings increases helps it look like a better match with the fact-based investment system's winning models.
It found support at its 50-day moving average (DMA) line during its latest consolidation. Market conditions still argue against new buying efforts until a follow through day (FTD) of gains from at least one of the major averages confirms a new rally. One may consider a valid secondary buy point from FB's successful test of the 10 week average up to +5% above the recent high ($59.31 on 1/22/14) or $62.28 in this case. FB was last shown in this FSU section on 1/15/14 with annotated graphs under the headline, "Following New Offering Prior Highs Acted As Support". It rallied from a 9-week cup shaped base without a handle after completing a Public Offering on 12/20/13. In the 12/12/13 mid-day report (read here) it was highlighted in yellow with a pivot point cited based on its 10/18/13 high plus 10 cents while noted with caution - "Disciplined investors may watch for subsequent volume-driven gains above its pivot point which are necessary to trigger a proper technical buy signal."
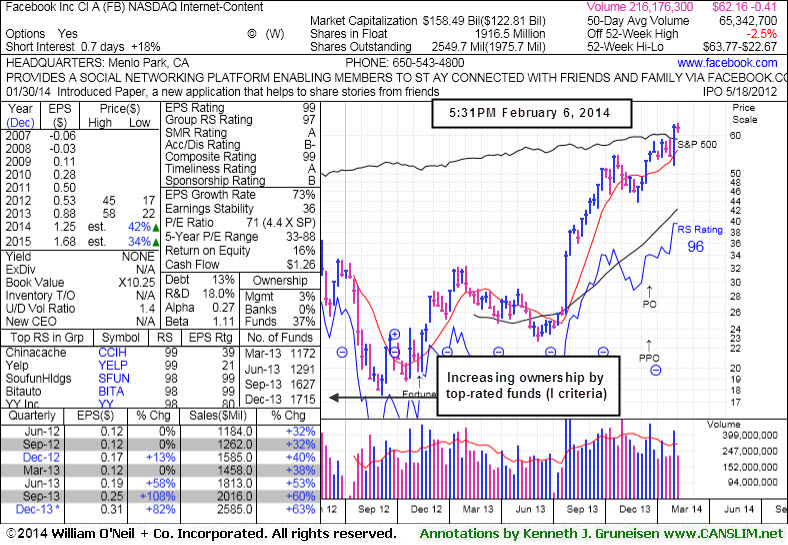
The number of top-rated funds owning its shares rose from 1,116 in Dec '12 to 1,715 in Dec '13, a reassuring sign concerning the I criteria. Keep in mind that its large supply of 2.54 billion shares in the public float makes it an unlikely sprinter, especially as it is already well known by the institutional crowd and the general public.
|
|
|
Color Codes Explained :
Y - Better candidates highlighted by our
staff of experts.
G - Previously featured
in past reports as yellow but may no longer be buyable under the
guidelines.
***Last / Change / Volume data in this table is the closing quote data***
Symbol/Exchange
Company Name
Industry Group |
PRICE |
CHANGE
(%Change) |
Day High |
Volume
(% DAV)
(% 50 day avg vol) |
52 Wk Hi
% From Hi |
Featured
Date |
Price
Featured |
Pivot Featured |
|
Max Buy |
EQM
-
NYSE
E Q T Midstream Partners
ENERGY - Oil and Gas Pipelines
|
$65.08
|
+2.28
3.63% |
$65.29
|
77,486
75.23% of 50 DAV
50 DAV is 103,000
|
$63.82
1.97%
|
12/12/2013
|
$53.17
|
PP = $56.51
|
|
MB = $59.34
|
 Most Recent Note - 2/6/2014 3:13:07 PM
G - Hitting a new 52-week high with today's 3rd consecutive gain on light volume, getting more extended from any sound base pattern. Prior highs in the $56 area define support to watch on pullbacks.
>>> FEATURED STOCK ARTICLE : Extended From Base After Six Consecutive Weekly Gains - 1/17/2014
View all notes |
Set NEW NOTE alert |
CANSLIM.net Company Profile |
SEC
News |
Chart |
Request a new note
C
A N
S L
I M


|
FB
-
NASDAQ
Facebook Inc Cl A
INTERNET
|
$62.16
|
-0.03
-0.05% |
$62.78
|
42,088,422
64.41% of 50 DAV
50 DAV is 65,342,000
|
$63.77
-2.52%
|
12/12/2013
|
$51.40
|
PP = $54.93
|
|
MB = $57.68
|
Most Recent Note - 2/6/2014 5:56:26 PM
Y - Market conditions still argue against new buying efforts until a FTD from at least one of the major averages confirms a new rally. One may consider a valid secondary buy point up to $62.28, as previously noted. See the latest FSU analysis for more details and new annotated graphs.
>>> FEATURED STOCK ARTICLE : Volume Totals Cooling While Holding Ground at Highs - 2/6/2014
View all notes |
Set NEW NOTE alert |
CANSLIM.net Company Profile |
SEC
News |
Chart |
Request a new note
C
A N
S L
I M
|
JAZZ
-
NASDAQ
Jazz Pharmaceuticals Plc
DRUGS - Biotechnology
|
$143.78
|
-2.91
-1.98% |
$147.88
|
906,051
104.14% of 50 DAV
50 DAV is 870,000
|
$159.14
-9.65%
|
9/30/2013
|
$93.20
|
PP = $89.10
|
|
MB = $93.56
|
Most Recent Note - 2/3/2014 6:34:37 PM
G - Retreating from its 52-week high with 2 consecutive losses on above average volume. Its 50 DMA line ($129.39 now) defines important support to watch on pullbacks.
>>> FEATURED STOCK ARTICLE : Consolidating After Getting Very Extended - 2/5/2014
View all notes |
Set NEW NOTE alert |
CANSLIM.net Company Profile |
SEC
News |
Chart |
Request a new note
C
A N
S L
I M
|
KORS
-
NYSE
Michael Kors Hldgs Ltd
RETAIL - Apparel Stores
|
$91.50
|
+0.16
0.18% |
$92.94
|
4,179,927
105.23% of 50 DAV
50 DAV is 3,972,000
|
$93.18
-1.80%
|
2/4/2014
|
$90.92
|
PP = $84.68
|
|
MB = $88.91
|
Most Recent Note - 2/5/2014 12:29:08 PM
Y - Holding its ground at its 52-week high following a "breakaway gap" on the prior session new all-time highs. Reported strong +73% earnings on +59% sales revenues for the Dec '13 quarter, continuing its strong earnings record. Color code was changed to yellow with new pivot point cited based on its 12/19/13 high plus 10 cents. Considerable volume-driven gain triggered a technical buy signal, however the broader market (M criteria) environment still argues for caution until at least one of the major averages produces a solid follow-through day of gains on higher volume.
>>> FEATURED STOCK ARTICLE : Down on Higher Volume Ahead of Quarterly Earnings Report - 2/3/2014
View all notes |
Set NEW NOTE alert |
CANSLIM.net Company Profile |
SEC
News |
Chart |
Request a new note
C
A N
S L
I M
|
MRLN
-
NASDAQ
Marlin Business Services
DIVERSIFIED SERVICES - Rental and Leasing Services
|
$24.78
|
-0.53
-2.09% |
$26.11
|
53,702
298.34% of 50 DAV
50 DAV is 18,000
|
$29.58
-16.22%
|
12/19/2013
|
$26.69
|
PP = $28.74
|
|
MB = $30.18
|
Most Recent Note - 2/6/2014 6:10:08 PM
Traded above its 50 DMA line today then reversed into the red and closed near the session low. Relative Strength rating has slumped to 61, well below the 80+ guideline for buy candidates. It will be dropped from the Featured Stocks list tonight.
>>> FEATURED STOCK ARTICLE : Hovering Near 52-Week High Following Technical Breakout - 1/22/2014
View all notes |
Set NEW NOTE alert |
CANSLIM.net Company Profile |
SEC
News |
Chart |
Request a new note
C
A N
S L
I M
|
Symbol/Exchange
Company Name
Industry Group |
PRICE |
CHANGE
(%Change) |
Day High |
Volume
(% DAV)
(% 50 day avg vol) |
52 Wk Hi
% From Hi |
Featured
Date |
Price
Featured |
Pivot Featured |
|
Max Buy |
PCLN
-
NASDAQ
Priceline.com Inc
INTERNET - Internet Software and Services
|
$1,138.34
|
+14.33
1.27% |
$1,145.51
|
452,228
78.92% of 50 DAV
50 DAV is 573,000
|
$1,214.97
-6.31%
|
12/18/2013
|
$1,156.20
|
PP = $1,198.85
|
|
MB = $1,258.79
|
Most Recent Note - 2/6/2014 5:59:06 PM
G - The longer it lingers below its 50 DMA line the worse its outlook gets. Recent low ($1,103.90 on 2/05/14) defines near-term support to watch where further deterioration would raise greater concerns.
>>> FEATURED STOCK ARTICLE : Violation of 50-Day Average After Failing to Trigger New Buy Signal - 1/29/2014
View all notes |
Set NEW NOTE alert |
CANSLIM.net Company Profile |
SEC
News |
Chart |
Request a new note
C
A N
S L
I M
|
RGR
-
NYSE
Sturm Ruger & Co Inc
CONSUMER DURABLES - Sporting Goods
|
$71.50
|
+0.62
0.87% |
$72.75
|
254,537
68.98% of 50 DAV
50 DAV is 369,000
|
$85.93
-16.79%
|
1/8/2014
|
$78.87
|
PP = $80.38
|
|
MB = $84.40
|
Most Recent Note - 2/4/2014 5:32:53 PM
G- Slumped further below its 50 DMA line with losses on higher volume after recently negating the prior breakout. Faces overhead supply up through the $85 level which may act as resistance. See the latest FSU analysis for more details and new annotated graphs.
>>> FEATURED STOCK ARTICLE : Slumped Into Prior Base Negating Breakout and Violated 50-Day Average - 2/4/2014
View all notes |
Set NEW NOTE alert |
CANSLIM.net Company Profile |
SEC
News |
Chart |
Request a new note
C
A N
S L
I M
|
SFUN
-
NYSE
Soufun Hldgs Ltd Ads A
INTERNET - Internet Information Providers
|
$76.01
|
+3.75
5.19% |
$76.99
|
1,645,745
135.68% of 50 DAV
50 DAV is 1,213,000
|
$95.39
-20.32%
|
10/17/2013
|
$58.02
|
PP = $53.87
|
|
MB = $56.56
|
Most Recent Note - 2/5/2014 2:20:47 PM
G - Down considerably with heavy volume behind today's volume-driven loss, violating its 50 DMA line and raising greater concerns while triggering a technical sell signal.
>>> FEATURED STOCK ARTICLE : 50-Day Moving Average Defines Near Term Support After Great Rally - 1/31/2014
View all notes |
Set NEW NOTE alert |
CANSLIM.net Company Profile |
SEC
News |
Chart |
Request a new note
C
A N
S L
I M
|
SILC
-
NASDAQ
Silicom Ltd
COMPUTER HARDWARE - Networking andamp; Communication Dev
|
$63.02
|
+0.67
1.07% |
$63.20
|
66,833
119.34% of 50 DAV
50 DAV is 56,000
|
$63.91
-1.39%
|
12/23/2013
|
$44.62
|
PP = $46.25
|
|
MB = $48.56
|
Most Recent Note - 2/5/2014 12:33:09 PM
G - Still hovering near its 52-week high, extended from any sound base. Stubbornly holding its ground since a considerable gap up on 1/23/14 after reporting earnings +92% on +52% sales for the Dec '13 quarter, beating consensus estimates.
>>> FEATURED STOCK ARTICLE : Considerable Gap Up Following Strong Earnings Report - 1/23/2014
View all notes |
Set NEW NOTE alert |
CANSLIM.net Company Profile |
SEC
News |
Chart |
Request a new note
C
A N
S L
I M
|
SSNC
-
NASDAQ
S S & C Technologies
COMPUTER SOFTWARE and SERVICES - Application Software
|
$37.53
|
-0.23
-0.61% |
$38.16
|
130,122
722.90% of 50 DAV
50 DAV is 18,000
|
$46.61
-19.47%
|
10/22/2013
|
$39.17
|
PP = $40.04
|
|
MB = $42.04
|
Most Recent Note - 2/6/2014 6:02:42 PM
Testing support at its 200 DMA line with volume totals cooling after damaging losses. Relative Strength rating slumped to 76, below the 80+ minimum guideline for buy candidates. Gains above the 50 DMA line are needed for its outlook to improve. It will be dropped from the Featured Stocks list tonight.
>>> FEATURED STOCK ARTICLE : Enduring Distributional Pressure While Retreating Near Prior Highs - 1/16/2014
View all notes |
Set NEW NOTE alert |
CANSLIM.net Company Profile |
SEC
News |
Chart |
Request a new note
C
A N
S L
I M
|
Symbol/Exchange
Company Name
Industry Group |
PRICE |
CHANGE
(%Change) |
Day High |
Volume
(% DAV)
(% 50 day avg vol) |
52 Wk Hi
% From Hi |
Featured
Date |
Price
Featured |
Pivot Featured |
|
Max Buy |
ULTI
-
NASDAQ
Ultimate Software Group
INTERNET - Internet Software and Services
|
$156.56
|
+1.30
0.84% |
$158.42
|
291,208
165.46% of 50 DAV
50 DAV is 176,000
|
$168.43
-7.05%
|
1/27/2014
|
$153.75
|
PP = $162.98
|
|
MB = $171.13
|
Most Recent Note - 2/5/2014 12:40:46 PM
Y - Touched another new 52-week high then undercut its 50 DMA line following a "negative reversal" after reporting earnings +42% on +21% sales for the Dec '13 quarter. Prior gains confirmed a technical buy signal, yet recent reports cautioned members - "Broader market conditions (M criteria) argue for caution until at least one of the major averages produces a convincing follow through day of gains on higher volume."
>>> FEATURED STOCK ARTICLE : Forming New Base But Enduring Distributional Pressure - 1/27/2014
View all notes |
Set NEW NOTE alert |
CANSLIM.net Company Profile |
SEC
News |
Chart |
Request a new note
C
A N
S L
I M
|
VRX
-
NYSE
Valeant Pharmaceuticals
DRUGS - Drug Manufacturers - Other
|
$134.43
|
-0.18
-0.13% |
$135.37
|
999,849
80.31% of 50 DAV
50 DAV is 1,245,000
|
$140.36
-4.22%
|
9/11/2013
|
$100.26
|
PP = $105.50
|
|
MB = $110.78
|
Most Recent Note - 2/4/2014 5:35:43 PM
G - Holding its ground perched near all-time highs, extended from any sound base. Its 50 DMA line ($120) defines near-term support to watch.
>>> FEATURED STOCK ARTICLE : Bullish Action Has Continued Despite Fundamental Concerns - 1/21/2014
View all notes |
Set NEW NOTE alert |
CANSLIM.net Company Profile |
SEC
News |
Chart |
Request a new note
C
A N
S L
I M
|
|
|
|
THESE ARE NOT BUY RECOMMENDATIONS!
Comments contained in the body of this report are technical
opinions only. The material herein has been obtained
from sources believed to be reliable and accurate, however,
its accuracy and completeness cannot be guaranteed.
This site is not an investment advisor, hence it does
not endorse or recommend any securities or other investments.
Any recommendation contained in this report may not
be suitable for all investors and it is not to be deemed
an offer or solicitation on our part with respect to
the purchase or sale of any securities. All trademarks,
service marks and trade names appearing in this report
are the property of their respective owners, and are
likewise used for identification purposes only.
This report is a service available
only to active Paid Premium Members.
You may opt-out of receiving report notifications
at any time. Questions or comments may be submitted
by writing to Premium Membership Services 665 S.E. 10 Street, Suite 201 Deerfield Beach, FL 33441-5634 or by calling 1-800-965-8307
or 954-785-1121.
|
|
|

