You are not logged in.
This means you
CAN ONLY VIEW reports that were published prior to Friday, April 11, 2025.
You
MUST UPGRADE YOUR MEMBERSHIP if you want to see any current reports.
AFTER MARKET UPDATE - WEDNESDAY, FEBRUARY 5TH, 2014
Previous After Market Report Next After Market Report >>>
|
|
|
|
DOW |
-5.01 |
15,440.23 |
-0.03% |
|
Volume |
740,366,460 |
-10% |
|
Volume |
1,988,257,230 |
-1% |
|
NASDAQ |
-19.97 |
4,011.55 |
-0.50% |
|
Advancers |
1,242 |
40% |
|
Advancers |
804 |
30% |
|
S&P 500 |
-3.56 |
1,751.64 |
-0.20% |
|
Decliners |
1,787 |
57% |
|
Decliners |
1,809 |
67% |
|
Russell 2000 |
-9.25 |
1,093.59 |
-0.84% |
|
52 Wk Highs |
23 |
|
|
52 Wk Highs |
28 |
|
|
S&P 600 |
-4.35 |
619.96 |
-0.70% |
|
52 Wk Lows |
80 |
|
|
52 Wk Lows |
78 |
|
|
 |
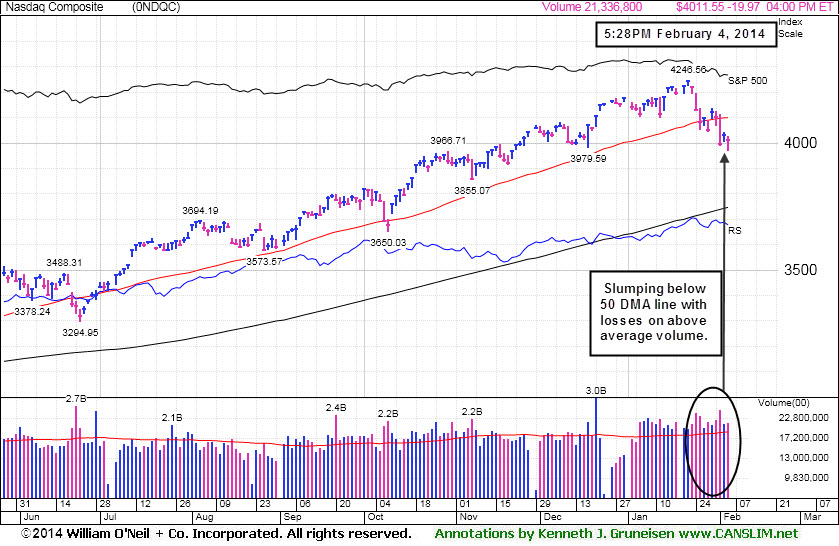
Leadership Elusive While Major Averages Ended Lower
Kenneth J. Gruneisen - Passed the CAN SLIM® Master's Exam
Stocks were slightly lower on Wednesday's session. The volume totals was reported lighter than the prior trading session's volume totals on the Nasdaq exchange and on the NYSE. Breadth was negative as advancers trailed decliners by a 3-2 ratio on the NYSE and by more than 2-1 on the Nasdaq exchange. There were only 6 high-ranked companies from the CANSLIM.net Leaders List that made new 52-week highs and appeared on the CANSLIM.net BreakOuts Page, up from the total of 3 stocks on the prior session. The list of stocks hitting new 52-week lows outnumbered new 52-week highs on the Nasdaq exchange and on the NYSE. There were gains for 4 of the 12 high-ranked companies currently included on the Featured Stocks Page, a list that has recently been waning. The Market (M criteria) has encountered distributional pressure and leadership (stocks hitting new highs) has waned, earning the label of being in another "correction". Such weakness serves as a reminder for investors to use caution and remain disciplined in following proper sell rules under the fact-based investment system to reduce market exposure.
The major averages finished down as investors weighed updates on the economy. Before the open, a report showed 175,000 jobs were added to private payrolls in January, below projections to increase by 185,000. Stocks pared losses after a reading on the service sector expanded more than forecasted. On the Fed front, Philadelphia's Charles Plosser said that based on the economic outlook, a case could be made for tapering asset purchases at a faster pace.
Among today’s earnings releases, Time Warner (TWC -1.1%) fell after posting quarterly results above estimates. Este Lauder (EL -5.54%) sank after the cosmetics company's profits missed projections. Twitter (TWTR -0.53%) slipped ahead of its first earnings release after the closing bell.
Seven of 10 sectors in the S&P 500 were down on the session led by energy and telecom as Chevron (CVX -1.2%) and AT&T (T -1.1%) fell. Consumer discretionary was the best performing group. Walgreens (WAG +3.40%) rose after rival CVS Caremark (CVS -1.01%) announced it would stop selling tobacco products.
Treasuries were lower with the 10-year note down 10/32 to yield 2.67%.
Investors should be watchful for any individual issues flashing technical sell signals. The CANSLIM.net Featured Stocks Page shows the most action-worthy candidates and their latest notes and a Headline Link directs members to the latest detailed analysis with data-packed graphs annotated by a Certified expert along with links to additional resources. The Premium Member Homepage includes "dynamic archives" to all prior pay reports published. Watch for an announcement via email concerning the next WEBCAST.
PICTURED: The Nasdaq Composite Index has slumped below its 50-day moving average (DMA) line with above average volume behind recent losses.
|
 Kenneth J. Gruneisen started out as a licensed stockbroker in August 1987, a couple of months prior to the historic stock market crash that took the Dow Jones Industrial Average down -22.6% in a single day. He has published daily fact-based fundamental and technical analysis on high-ranked stocks online for two decades. Through FACTBASEDINVESTING.COM, Kenneth provides educational articles, news, market commentary, and other information regarding proven investment systems that work in good times and bad.
Comments contained in the body of this report are technical opinions only and are not necessarily those of Gruneisen Growth Corp. The material herein has been obtained from sources believed to be reliable and accurate, however, its accuracy and completeness cannot be guaranteed. Our firm, employees, and customers may effect transactions, including transactions contrary to any recommendation herein, or have positions in the securities mentioned herein or options with respect thereto. Any recommendation contained in this report may not be suitable for all investors and it is not to be deemed an offer or solicitation on our part with respect to the purchase or sale of any securities. |
|
 |
Retail Index Rose While Most Groups Lost Ground
Kenneth J. Gruneisen - Passed the CAN SLIM® Master's Exam
Commodity-linked groups fell as the Oil Services Index ($OSX -1.42%), Integrated Oil Index ($XOI -0.65%), and the Gold & Silver Index ($XAU -1.20%) ended lower. The Biotechnology Index ($BTK -1.00%) led the tech sector lower while the Networking Index ($NWX -0.20%) ended with a small loss and the Semiconductor Index ($SOX +0.02%) finished flat. The Broker/Dealer Index ($XBD -0.87%) was a negative influence and the Bank Index ($BKX -0.11%) edged lower while the Retail Index ($RLX +0.46%) was a standout gainer.
Charts courtesy www.stockcharts.com
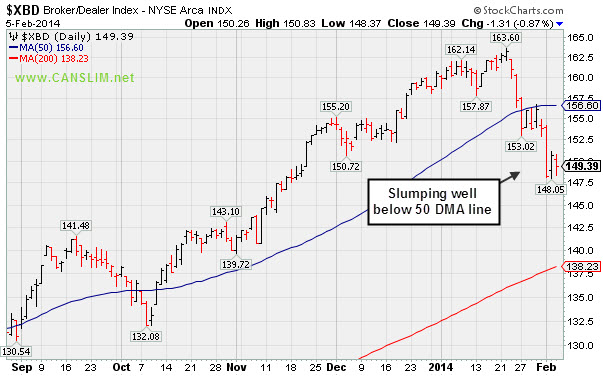
PICTURED: The Broker/Dealer Index ($XBD -0.87%) is slumping well below its 50-day moving average (DMA) line.
| Oil Services |
$OSX |
259.03 |
-3.72 |
-1.42% |
-7.83% |
| Integrated Oil |
$XOI |
1,375.46 |
-9.03 |
-0.65% |
-8.49% |
| Semiconductor |
$SOX |
518.46 |
+0.12 |
+0.02% |
-3.10% |
| Networking |
$NWX |
328.74 |
-0.64 |
-0.20% |
+1.48% |
| Broker/Dealer |
$XBD |
149.39 |
-1.31 |
-0.87% |
-6.96% |
| Retail |
$RLX |
852.02 |
+3.93 |
+0.46% |
-9.34% |
| Gold & Silver |
$XAU |
89.46 |
-1.09 |
-1.20% |
+6.31% |
| Bank |
$BKX |
66.11 |
-0.07 |
-0.11% |
-4.55% |
| Biotech |
$BTK |
2,446.03 |
-24.65 |
-1.00% |
+4.96% |
|
|
|
 |
Consolidating After Getting Very Extended
Kenneth J. Gruneisen - Passed the CAN SLIM® Master's Exam
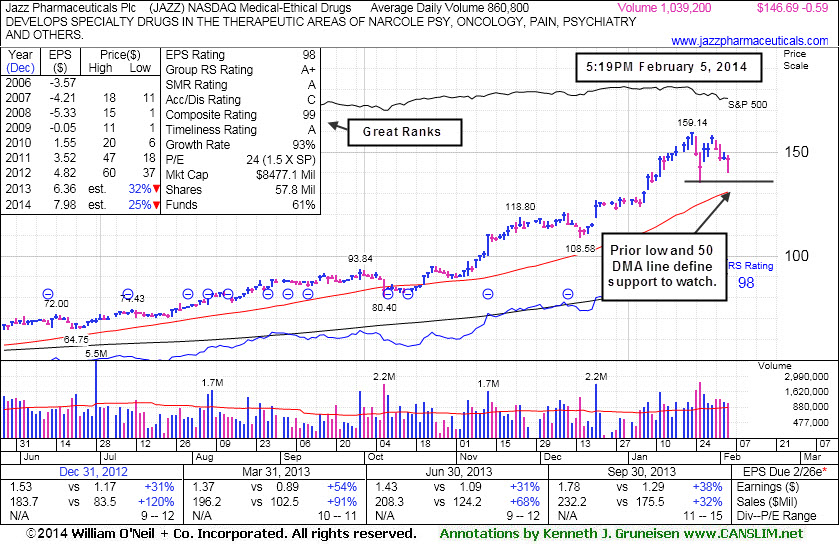
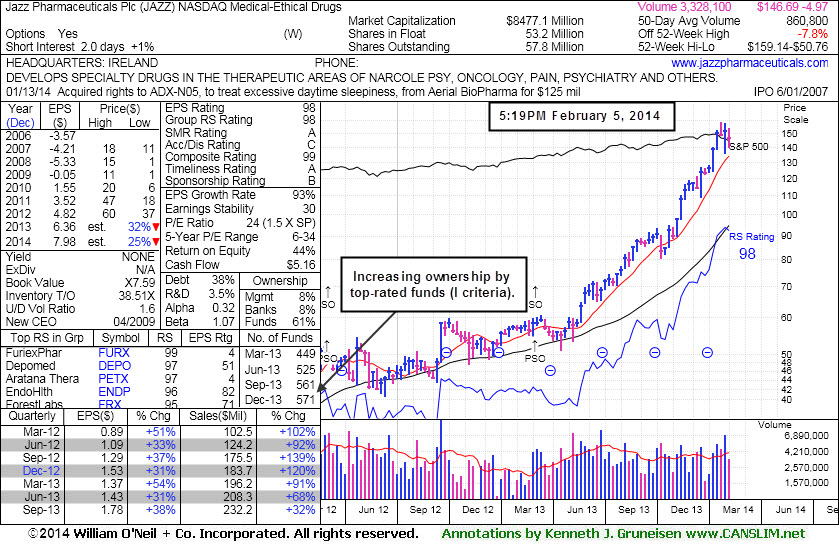
Jazz Pharmaceuticals Plc (JAZZ -$0.49 or -0.33% to $146.79) has been retreating from its 52-week high after getting extended from any sound base. Its prior low and 50-day moving average (DMA) line ($130.74 now) define important support to watch where violations may trigger technical sell signals.
Its last appearance in this FSU section was on 1/14/14 with annotated graphs under the headline, "Very Extended From Sound Base Following Big Volume-Driven Gains". JAZZ has rallied as much as +70.75% since highlighted in yellow in the 9/30/13 mid-day report (read here). The pivot point cited was based its 9/03/13 high plus 10 cents after an advanced "3-weeks tight" base. It may have looked like an expensive stock which had run too high already to many investors at that time. When it finished that session with a solid gain backed by +160% above average volume reports noted that it clinched a technical buy signal. Volume at least +40% above average is the minimum volume necessary behind a breakout before action should be taken by investors. In this case the volume met the guideline, providing the necessary proof of sufficient institutional buying demand.
Prior notes have reminded members of the dangers of chasing extended stocks - "Disciplined investors avoid chasing stocks more than +5% above prior highs and always limit losses by selling any stock that falls more than -7% from their purchase price."
Fundamentals remain strong (C and A criteria) today with its strong sales and earnings increases continuing through the Sep '13 quarter. Its annual earnings (A criteria) history includes big FY '10, '11, and '12 earnings after a history of losses.
The number of top-rated funds owning its shares rose from 351 in Mar '12 to 571 in Dec '13, a very reassuring sign concerning the I criteria. The Medical - Ethical Drugs group is currently showing good leadership (L criteria) while coming in with an A+ rating for its Group Relative Strength.
|
|
|
Color Codes Explained :
Y - Better candidates highlighted by our
staff of experts.
G - Previously featured
in past reports as yellow but may no longer be buyable under the
guidelines.
***Last / Change / Volume data in this table is the closing quote data***
Symbol/Exchange
Company Name
Industry Group |
PRICE |
CHANGE
(%Change) |
Day High |
Volume
(% DAV)
(% 50 day avg vol) |
52 Wk Hi
% From Hi |
Featured
Date |
Price
Featured |
Pivot Featured |
|
Max Buy |
EQM
-
NYSE
E Q T Midstream Partners
ENERGY - Oil and Gas Pipelines
|
$62.80
|
+2.00
3.29% |
$62.91
|
61,956
57.90% of 50 DAV
50 DAV is 107,000
|
$63.82
-1.60%
|
12/12/2013
|
$53.17
|
PP = $56.51
|
|
MB = $59.34
|
Most Recent Note - 1/31/2014 2:43:21 PM
G - Making gradual progress and stubbornly holding its ground, getting more extended from any sound base pattern. Prior highs in the $56 area define support to watch on pullbacks.
>>> FEATURED STOCK ARTICLE : Extended From Base After Six Consecutive Weekly Gains - 1/17/2014
View all notes |
Set NEW NOTE alert |
CANSLIM.net Company Profile |
SEC
News |
Chart |
Request a new note
C
A N
S L
I M


|
FB
-
NASDAQ
Facebook Inc Cl A
INTERNET
|
$62.19
|
-0.56
-0.89% |
$63.16
|
52,001,661
81.32% of 50 DAV
50 DAV is 63,948,100
|
$63.77
-2.48%
|
12/12/2013
|
$51.40
|
PP = $54.93
|
|
MB = $57.68
|
Most Recent Note - 1/30/2014 12:40:38 PM
Y - Reported earnings +82% on +63% sales revenues for the Dec '13 quarter. Gapped up and hit a new 52-week high today after finding support at its 50 DMA line during its latest consolidation. Color code is changed to yellow. Market conditions argue against new buying efforts until a FTD from at least one of the major averages confirms a new rally. One may consider a valid secondary buy point from its successful test of the 10 week average up to +5% above the recent high ($59.31 on 1/22/14).
>>> FEATURED STOCK ARTICLE : Following New Offering Prior Highs Acted As Support - 1/15/2014
View all notes |
Set NEW NOTE alert |
CANSLIM.net Company Profile |
SEC
News |
Chart |
Request a new note
C
A N
S L
I M
|
JAZZ
-
NASDAQ
Jazz Pharmaceuticals Plc
DRUGS - Biotechnology
|
$146.69
|
-0.59
-0.40% |
$148.60
|
1,039,250
133.20% of 50 DAV
50 DAV is 780,200
|
$159.14
-7.82%
|
9/30/2013
|
$93.20
|
PP = $89.10
|
|
MB = $93.56
|
Most Recent Note - 2/3/2014 6:34:37 PM
G - Retreating from its 52-week high with 2 consecutive losses on above average volume. Its 50 DMA line ($129.39 now) defines important support to watch on pullbacks.
>>> FEATURED STOCK ARTICLE : Consolidating After Getting Very Extended - 2/5/2014
View all notes |
Set NEW NOTE alert |
CANSLIM.net Company Profile |
SEC
News |
Chart |
Request a new note
C
A N
S L
I M
|
KORS
-
NYSE
Michael Kors Hldgs Ltd
RETAIL - Apparel Stores
|
$91.34
|
+1.43
1.59% |
$91.73
|
7,914,029
188.53% of 50 DAV
50 DAV is 4,197,800
|
$84.58
7.99%
|
2/4/2014
|
$90.92
|
PP = $84.68
|
|
MB = $88.91
|
 Most Recent Note - 2/5/2014 12:29:08 PM
Y - Holding its ground at its 52-week high following a "breakaway gap" on the prior session new all-time highs. Reported strong +73% earnings on +59% sales revenues for the Dec '13 quarter, continuing its strong earnings record. Color code was changed to yellow with new pivot point cited based on its 12/19/13 high plus 10 cents. Considerable volume-driven gain triggered a technical buy signal, however the broader market (M criteria) environment still argues for caution until at least one of the major averages produces a solid follow-through day of gains on higher volume.
>>> FEATURED STOCK ARTICLE : Down on Higher Volume Ahead of Quarterly Earnings Report - 2/3/2014
View all notes |
Set NEW NOTE alert |
CANSLIM.net Company Profile |
SEC
News |
Chart |
Request a new note
C
A N
S L
I M
|
MRLN
-
NASDAQ
Marlin Business Services
DIVERSIFIED SERVICES - Rental and Leasing Services
|
$25.31
|
+0.39
1.57% |
$25.49
|
40,636
126.99% of 50 DAV
50 DAV is 32,000
|
$29.58
-14.43%
|
12/19/2013
|
$26.69
|
PP = $28.74
|
|
MB = $30.18
|
Most Recent Note - 2/3/2014 1:17:48 PM
G - Color code is changed to green while slumping below its 50 DMA line raising more serious concerns. Disciplined investor always limit losses by selling any stock that falls more than -7% from their purchase price.
>>> FEATURED STOCK ARTICLE : Hovering Near 52-Week High Following Technical Breakout - 1/22/2014
View all notes |
Set NEW NOTE alert |
CANSLIM.net Company Profile |
SEC
News |
Chart |
Request a new note
C
A N
S L
I M
|
Symbol/Exchange
Company Name
Industry Group |
PRICE |
CHANGE
(%Change) |
Day High |
Volume
(% DAV)
(% 50 day avg vol) |
52 Wk Hi
% From Hi |
Featured
Date |
Price
Featured |
Pivot Featured |
|
Max Buy |
PCLN
-
NASDAQ
Priceline.Com Inc
INTERNET - Internet Software and Services
|
$1,124.01
|
-2.11
-0.19% |
$1,133.92
|
532,294
90.02% of 50 DAV
50 DAV is 591,300
|
$1,214.97
-7.49%
|
12/18/2013
|
$1,156.20
|
PP = $1,198.85
|
|
MB = $1,258.79
|
Most Recent Note - 1/29/2014 5:57:38 PM
G - Slumped further below its 50 DMA line today with slightly higher volume. Prior low ($1,113.01 on 1/06/13) defines near-term support to watch. See the latest FSU analysis for more details and new annotated graphs.
>>> FEATURED STOCK ARTICLE : Violation of 50-Day Average After Failing to Trigger New Buy Signal - 1/29/2014
View all notes |
Set NEW NOTE alert |
CANSLIM.net Company Profile |
SEC
News |
Chart |
Request a new note
C
A N
S L
I M
|
RGR
-
NYSE
Sturm Ruger & Co Inc
CONSUMER DURABLES - Sporting Goods
|
$70.88
|
-1.90
-2.61% |
$72.82
|
763,341
224.84% of 50 DAV
50 DAV is 339,500
|
$85.93
-17.51%
|
1/8/2014
|
$78.87
|
PP = $80.38
|
|
MB = $84.40
|
Most Recent Note - 2/4/2014 5:32:53 PM
G- Slumped further below its 50 DMA line with losses on higher volume after recently negating the prior breakout. Faces overhead supply up through the $85 level which may act as resistance. See the latest FSU analysis for more details and new annotated graphs.
>>> FEATURED STOCK ARTICLE : Slumped Into Prior Base Negating Breakout and Violated 50-Day Average - 2/4/2014
View all notes |
Set NEW NOTE alert |
CANSLIM.net Company Profile |
SEC
News |
Chart |
Request a new note
C
A N
S L
I M
|
SFUN
-
NYSE
Soufun Hldgs Ltd Ads A
INTERNET - Internet Information Providers
|
$72.26
|
-7.08
-8.92% |
$79.16
|
3,134,355
267.80% of 50 DAV
50 DAV is 1,170,400
|
$95.39
-24.25%
|
10/17/2013
|
$58.02
|
PP = $53.87
|
|
MB = $56.56
|
Most Recent Note - 2/5/2014 2:20:47 PM
G - Down considerably with heavy volume behind today's volume-driven loss, violating its 50 DMA line and raising greater concerns while triggering a technical sell signal.
>>> FEATURED STOCK ARTICLE : 50-Day Moving Average Defines Near Term Support After Great Rally - 1/31/2014
View all notes |
Set NEW NOTE alert |
CANSLIM.net Company Profile |
SEC
News |
Chart |
Request a new note
C
A N
S L
I M
|
SILC
-
NASDAQ
Silicom Ltd
COMPUTER HARDWARE - Networking andamp; Communication Dev
|
$62.35
|
+0.07
0.11% |
$62.40
|
62,661
182.15% of 50 DAV
50 DAV is 34,400
|
$63.91
-2.44%
|
12/23/2013
|
$44.62
|
PP = $46.25
|
|
MB = $48.56
|
Most Recent Note - 2/5/2014 12:33:09 PM
G - Still hovering near its 52-week high, extended from any sound base. Stubbornly holding its ground since a considerable gap up on 1/23/14 after reporting earnings +92% on +52% sales for the Dec '13 quarter, beating consensus estimates.
>>> FEATURED STOCK ARTICLE : Considerable Gap Up Following Strong Earnings Report - 1/23/2014
View all notes |
Set NEW NOTE alert |
CANSLIM.net Company Profile |
SEC
News |
Chart |
Request a new note
C
A N
S L
I M
|
SSNC
-
NASDAQ
S S & C Technologies
COMPUTER SOFTWARE and SERVICES - Application Software
|
$37.76
|
-0.71
-1.85% |
$38.35
|
207,635
78.89% of 50 DAV
50 DAV is 263,200
|
$46.61
-18.98%
|
10/22/2013
|
$39.17
|
PP = $40.04
|
|
MB = $42.04
|
Most Recent Note - 1/29/2014 3:12:07 PM
G- Gapped down today, raising greater concerns while slumping further below its 50 DMA line with above average volume behind its damaging 4th consecutive loss. A rebound above the 50 DMA line is needed for its outlook improve.
>>> FEATURED STOCK ARTICLE : Enduring Distributional Pressure While Retreating Near Prior Highs - 1/16/2014
View all notes |
Set NEW NOTE alert |
CANSLIM.net Company Profile |
SEC
News |
Chart |
Request a new note
C
A N
S L
I M
|
Symbol/Exchange
Company Name
Industry Group |
PRICE |
CHANGE
(%Change) |
Day High |
Volume
(% DAV)
(% 50 day avg vol) |
52 Wk Hi
% From Hi |
Featured
Date |
Price
Featured |
Pivot Featured |
|
Max Buy |
ULTI
-
NASDAQ
Ultimate Software Group
INTERNET - Internet Software and Services
|
$155.26
|
-4.46
-2.79% |
$168.43
|
599,933
441.78% of 50 DAV
50 DAV is 135,800
|
$165.50
-6.19%
|
1/27/2014
|
$153.75
|
PP = $162.98
|
|
MB = $171.13
|
Most Recent Note - 2/5/2014 12:40:46 PM
Y - Touched another new 52-week high then undercut its 50 DMA line following a "negative reversal" after reporting earnings +42% on +21% sales for the Dec '13 quarter. Prior gains confirmed a technical buy signal, yet recent reports cautioned members - "Broader market conditions (M criteria) argue for caution until at least one of the major averages produces a convincing follow through day of gains on higher volume."
>>> FEATURED STOCK ARTICLE : Forming New Base But Enduring Distributional Pressure - 1/27/2014
View all notes |
Set NEW NOTE alert |
CANSLIM.net Company Profile |
SEC
News |
Chart |
Request a new note
C
A N
S L
I M
|
VRX
-
NYSE
Valeant Pharmaceuticals
DRUGS - Drug Manufacturers - Other
|
$134.61
|
-0.95
-0.70% |
$135.52
|
1,432,436
124.01% of 50 DAV
50 DAV is 1,155,100
|
$140.36
-4.10%
|
9/11/2013
|
$100.26
|
PP = $105.50
|
|
MB = $110.78
|
Most Recent Note - 2/4/2014 5:35:43 PM
G - Holding its ground perched near all-time highs, extended from any sound base. Its 50 DMA line ($120) defines near-term support to watch.
>>> FEATURED STOCK ARTICLE : Bullish Action Has Continued Despite Fundamental Concerns - 1/21/2014
View all notes |
Set NEW NOTE alert |
CANSLIM.net Company Profile |
SEC
News |
Chart |
Request a new note
C
A N
S L
I M
|
|
|
|
THESE ARE NOT BUY RECOMMENDATIONS!
Comments contained in the body of this report are technical
opinions only. The material herein has been obtained
from sources believed to be reliable and accurate, however,
its accuracy and completeness cannot be guaranteed.
This site is not an investment advisor, hence it does
not endorse or recommend any securities or other investments.
Any recommendation contained in this report may not
be suitable for all investors and it is not to be deemed
an offer or solicitation on our part with respect to
the purchase or sale of any securities. All trademarks,
service marks and trade names appearing in this report
are the property of their respective owners, and are
likewise used for identification purposes only.
This report is a service available
only to active Paid Premium Members.
You may opt-out of receiving report notifications
at any time. Questions or comments may be submitted
by writing to Premium Membership Services 665 S.E. 10 Street, Suite 201 Deerfield Beach, FL 33441-5634 or by calling 1-800-965-8307
or 954-785-1121.
|
|
|

