You are not logged in.
This means you
CAN ONLY VIEW reports that were published prior to Sunday, April 13, 2025.
You
MUST UPGRADE YOUR MEMBERSHIP if you want to see any current reports.
AFTER MARKET UPDATE - FRIDAY, FEBRUARY 7TH, 2014
Previous After Market Report Next After Market Report >>>
|
|
|
|
DOW |
+165.55 |
15,794.08 |
+1.06% |
|
Volume |
750,771,370 |
+3% |
|
Volume |
1,933,952,940 |
+7% |
|
NASDAQ |
+68.74 |
4,125.86 |
+1.69% |
|
Advancers |
2,367 |
75% |
|
Advancers |
1,814 |
68% |
|
S&P 500 |
+23.59 |
1,797.02 |
+1.33% |
|
Decliners |
666 |
21% |
|
Decliners |
763 |
29% |
|
Russell 2000 |
+12.63 |
1,116.55 |
+1.14% |
|
52 Wk Highs |
70 |
|
|
52 Wk Highs |
51 |
|
|
S&P 600 |
+4.90 |
631.73 |
+0.78% |
|
52 Wk Lows |
14 |
|
|
52 Wk Lows |
30 |
|
|
 |
New Rally Effort Worthy of Note - Watch For Leadership
Kenneth J. Gruneisen - Passed the CAN SLIM® Master's Exam
With Friday's gains the major averages recovered from the selloff at the start of the week to finish in positive territory. For the five day period, the Dow was up +0.6%, the S&P 500 gained +0.8% and the NASDAQ rose +0.5%. Friday's volume totals were reported higher than the prior trading session's volume totals on the Nasdaq exchange and on the NYSE, suggesting that institutional buying demand increased behind the gains. Breadth was positive as advancers led decliners by more than a 3-1 ratio on the NYSE and by more than 2-1 on the Nasdaq exchange. There were 28 high-ranked companies from the CANSLIM.net Leaders List that made new 52-week highs and appeared on the CANSLIM.net BreakOuts Page, up from the total of 16 stocks on the prior session. The list of stocks hitting new 52-week highs outnumbered new 52-week lows on the Nasdaq exchange and on the NYSE, an encouraging improvement. There were gains for 9 of the 10 high-ranked companies currently included on the Featured Stocks Page, a list that has recently been waning. The Market (M criteria) has a nascent rally attempt under way. Remember that for any rally to be sustained it is critical for there to be "healthy" leadership - many stocks hitting new 52-week highs.
The major averages finished the first week of February on a positive note. The Dow rose 166 points to 1,5794. The S&P 500 advanced 24 points to 1,797. The NASDAQ closed 69 points higher at 4,125.
The major averages rallied on Friday as investors weighed the updates on the employment situation. Before the open, the Labor Department reported nonfarm payrolls grew 113,000 in January, below projections for a gain of 180,000. The unemployment rate declined to 6.6%, its lowest reading since October 2008.
Among scheduled earnings releases, Expedia (EXPE +14.3%) as quarterly results topped estimates. Shares of LinkedIn (LNKD -6.2%) retreated after providing revenue guidance below forecasts.
Friday's advance was broad based with all 10 sectors in the S&P 500 up on the session. Health care, industrials and technology were the best performing groups. Celgene (CELG +4.7%). Boeing (BA +3.6%) Apple (AAPL +1.4%) after the company said it recently repurchased $14 billion of its shares.
Treasuries snapped a three-day decline with the 10-year note up 5/32 to yield 2.68%.
The CANSLIM.net Featured Stocks Page shows the most action-worthy candidates and their latest notes and a Headline Link directs members to the latest detailed analysis with data-packed graphs annotated by a Certified expert along with links to additional resources. The Premium Member Homepage includes "dynamic archives" to all prior pay reports published. Watch for an announcement via email concerning the next WEBCAST.
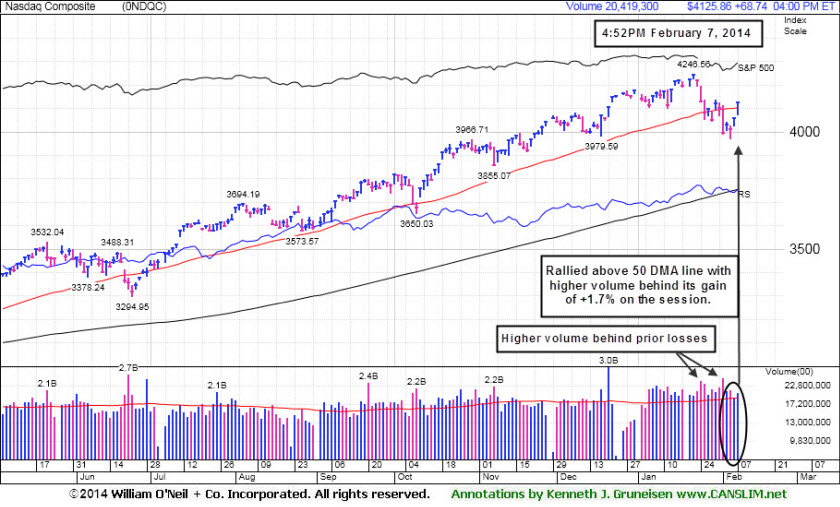
PICTURED: The Nasdaq Composite Index posted a big +1.7% gain to close well above its 50-day moving average (DMA) line. The gains may be considered a follow-through day if one is willing to overlook the fact that Wednesday's intra-day lows undercut the "Day 1" session's lows which usually is considered the end of any rally attempt. Prior commentaries published here pointed out that Wedneday's lows undercut Tuesday's lows for all of the major indices. Under the fact-based investment system it is most ideal for at least one of the major averages to produce as solid follow-through day (FTD) of big gains on higher volume between Days 4-7 of a new rally effort. Use caution and remain disciplined in following proper sell rules under the fact-based investment system.
|
 Kenneth J. Gruneisen started out as a licensed stockbroker in August 1987, a couple of months prior to the historic stock market crash that took the Dow Jones Industrial Average down -22.6% in a single day. He has published daily fact-based fundamental and technical analysis on high-ranked stocks online for two decades. Through FACTBASEDINVESTING.COM, Kenneth provides educational articles, news, market commentary, and other information regarding proven investment systems that work in good times and bad.
Comments contained in the body of this report are technical opinions only and are not necessarily those of Gruneisen Growth Corp. The material herein has been obtained from sources believed to be reliable and accurate, however, its accuracy and completeness cannot be guaranteed. Our firm, employees, and customers may effect transactions, including transactions contrary to any recommendation herein, or have positions in the securities mentioned herein or options with respect thereto. Any recommendation contained in this report may not be suitable for all investors and it is not to be deemed an offer or solicitation on our part with respect to the purchase or sale of any securities. |
|
 |
Tech, Financial, Retail and Commodity-Linked Groups Rallied
Kenneth J. Gruneisen - Passed the CAN SLIM® Master's Exam
Financial shares were a positive influence on the major averages on Friday as the Bank Index ($BKX +0.76%) and the Broker/Dealer Index ($XBD +1.17%) rose. The tech sector led the market higher as the Biotechnology Index ($BTK +3.83%), Networking Index ($NWX +1.38%), and Semiconductor Index ($SOX +1.64%) finished with unanimous gains. The Retail Index ($RLX +1.63%) and energy-related shares had a positive bias as the Oil Services Index ($OSX +0.21%) and Integrated Oil Index ($XOI +1.39%) rose. The Gold & Silver Index ($XAU +3.13%) was a standout gainer.
Charts courtesy www.stockcharts.com
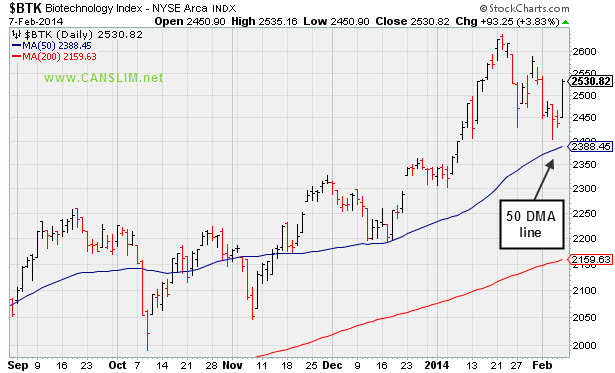
PICTURED: The Biotechnology Index ($BTK +3.83%) posted a big gain, staying well above its 50-day moving average (DMA) line during its latest consolidation.
| Oil Services |
$OSX |
265.07 |
+0.56 |
+0.21% |
-5.68% |
| Integrated Oil |
$XOI |
1,414.74 |
+19.42 |
+1.39% |
-5.88% |
| Semiconductor |
$SOX |
535.31 |
+8.64 |
+1.64% |
+0.05% |
| Networking |
$NWX |
341.32 |
+4.64 |
+1.38% |
+5.37% |
| Broker/Dealer |
$XBD |
153.23 |
+1.77 |
+1.17% |
-4.56% |
| Retail |
$RLX |
885.86 |
+14.21 |
+1.63% |
-5.74% |
| Gold & Silver |
$XAU |
92.22 |
+2.80 |
+3.13% |
+9.59% |
| Bank |
$BKX |
67.77 |
+0.51 |
+0.76% |
-2.15% |
| Biotech |
$BTK |
2,530.82 |
+93.25 |
+3.83% |
+8.60% |
|
|
|
 |
Leader Still Extended From Any Sound Base
Kenneth J. Gruneisen - Passed the CAN SLIM® Master's Exam
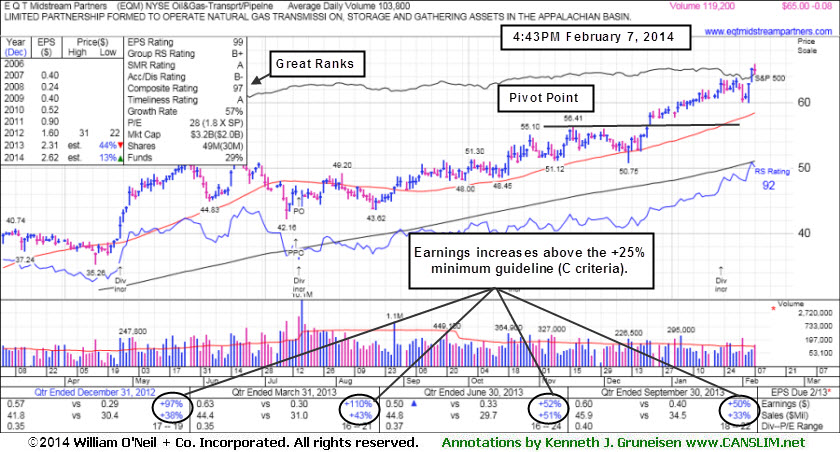
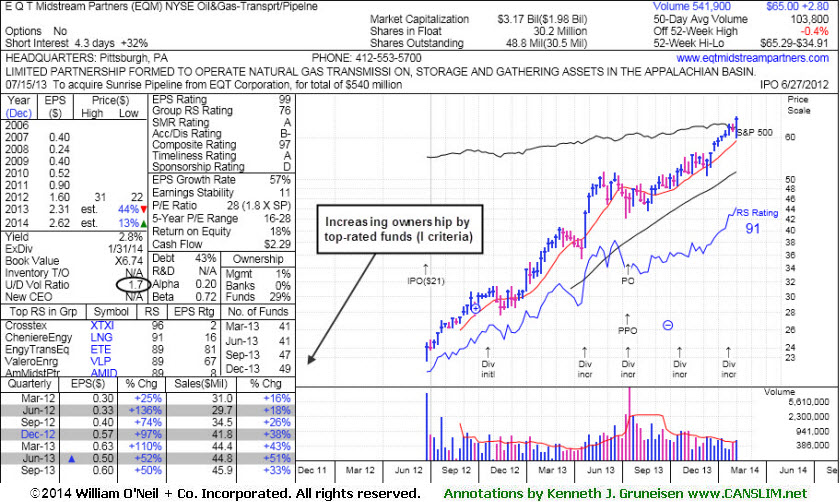
E Q T Midstream Partners (EQM -$0.08 or -0.12% to $65.00) touched a new 52-week high today. It is extended from any sound base pattern. Prior highs in the $56 area define support to watch on pullbacks. Its last appearance in this FSU section was on 1/17/14 under the headline, "Extended From Base After Six Consecutive Weekly Gains". It was highlighted in yellow in the 12/12/13 mid-day report (read here) with new pivot point cited based on its 11/18/13 high plus 10 cents.
Patient investors may watch for a new base or secondary buy point to possibly develop and be noted in the weeks ahead. Recently it reported earnings +50% on +33% sales revenues for the Sep '13 quarter, continuing its strong earnings history (good C and A criteria). It completed a new Public Offering on 7/16/13, then made gradual progress afterward. This MLP in the Natural Gas business has seen the number of top-rated funds owning its shares rise from 20 in Jun '12 to 49 in Dec '13, a reassuring sign concerning the I criteria. Its Up/Down Volume Ratio of 1.7 is an unbiased indication its shares have been under accumulation over the past 50 days.
|
|
|
Color Codes Explained :
Y - Better candidates highlighted by our
staff of experts.
G - Previously featured
in past reports as yellow but may no longer be buyable under the
guidelines.
***Last / Change / Volume data in this table is the closing quote data***
Symbol/Exchange
Company Name
Industry Group |
PRICE |
CHANGE
(%Change) |
Day High |
Volume
(% DAV)
(% 50 day avg vol) |
52 Wk Hi
% From Hi |
Featured
Date |
Price
Featured |
Pivot Featured |
|
Max Buy |
EQM
-
NYSE
E Q T Midstream Partners
ENERGY - Oil and Gas Pipelines
|
$65.00
|
-0.08
-0.12% |
$65.83
|
119,280
115.81% of 50 DAV
50 DAV is 103,000
|
$65.29
-0.44%
|
12/12/2013
|
$53.17
|
PP = $56.51
|
|
MB = $59.34
|
 Most Recent Note - 2/7/2014 6:11:38 PM
G - Hit a new 52-week high today. It is extended from any sound base pattern. Prior highs in the $56 area define support to watch on pullbacks. See the latest FSU analysis for more details and new annotated graphs.
>>> FEATURED STOCK ARTICLE : Leader Still Extended From Any Sound Base - 2/7/2014
View all notes |
Set NEW NOTE alert |
CANSLIM.net Company Profile |
SEC
News |
Chart |
Request a new note
C
A N
S L
I M


|
FB
-
NASDAQ
Facebook Inc Cl A
INTERNET
|
$64.32
|
+2.16
3.47% |
$64.57
|
60,778,469
92.97% of 50 DAV
50 DAV is 65,374,000
|
$63.77
0.86%
|
12/12/2013
|
$51.40
|
PP = $54.93
|
|
MB = $57.68
|
Most Recent Note - 2/6/2014 5:56:26 PM
Y - Market conditions still argue against new buying efforts until a FTD from at least one of the major averages confirms a new rally. One may consider a valid secondary buy point up to $62.28, as previously noted. See the latest FSU analysis for more details and new annotated graphs.
>>> FEATURED STOCK ARTICLE : Volume Totals Cooling While Holding Ground at Highs - 2/6/2014
View all notes |
Set NEW NOTE alert |
CANSLIM.net Company Profile |
SEC
News |
Chart |
Request a new note
C
A N
S L
I M
|
JAZZ
-
NASDAQ
Jazz Pharmaceuticals Plc
DRUGS - Biotechnology
|
$153.10
|
+9.32
6.48% |
$154.92
|
1,172,076
134.88% of 50 DAV
50 DAV is 869,000
|
$159.14
-3.80%
|
9/30/2013
|
$93.20
|
PP = $89.10
|
|
MB = $93.56
|
Most Recent Note - 2/7/2014 12:21:19 PM
G - Rebounding near its 52-week high with a solid gain today. It is extended from any sound base and its 50 DMA line ($132.10 now) defines important support to watch on pullbacks.
>>> FEATURED STOCK ARTICLE : Consolidating After Getting Very Extended - 2/5/2014
View all notes |
Set NEW NOTE alert |
CANSLIM.net Company Profile |
SEC
News |
Chart |
Request a new note
C
A N
S L
I M
|
KORS
-
NYSE
Michael Kors Hldgs Ltd
RETAIL - Apparel Stores
|
$94.22
|
+2.72
2.97% |
$94.43
|
4,082,142
101.85% of 50 DAV
50 DAV is 4,008,000
|
$93.18
1.12%
|
2/4/2014
|
$90.92
|
PP = $84.68
|
|
MB = $88.91
|
Most Recent Note - 2/5/2014 12:29:08 PM
Y - Holding its ground at its 52-week high following a "breakaway gap" on the prior session new all-time highs. Reported strong +73% earnings on +59% sales revenues for the Dec '13 quarter, continuing its strong earnings record. Color code was changed to yellow with new pivot point cited based on its 12/19/13 high plus 10 cents. Considerable volume-driven gain triggered a technical buy signal, however the broader market (M criteria) environment still argues for caution until at least one of the major averages produces a solid follow-through day of gains on higher volume.
>>> FEATURED STOCK ARTICLE : Down on Higher Volume Ahead of Quarterly Earnings Report - 2/3/2014
View all notes |
Set NEW NOTE alert |
CANSLIM.net Company Profile |
SEC
News |
Chart |
Request a new note
C
A N
S L
I M
|
PCLN
-
NASDAQ
Priceline.com Inc
INTERNET - Internet Software and Services
|
$1,195.39
|
+57.05
5.01% |
$1,196.56
|
1,401,415
244.15% of 50 DAV
50 DAV is 574,000
|
$1,214.97
-1.61%
|
12/18/2013
|
$1,156.20
|
PP = $1,198.85
|
|
MB = $1,258.79
|
Most Recent Note - 2/7/2014 12:40:56 PM
Y - Rebounding above its 50 DMA line today with a gap up and considerable volume-driven gain. Color code is changed to yellow after proving resilient, but no new pivot point is being cited. Recent low ($1,103.90 on 2/05/14) defines near-term support to watch where further deterioration would raise greater concerns.
>>> FEATURED STOCK ARTICLE : Violation of 50-Day Average After Failing to Trigger New Buy Signal - 1/29/2014
View all notes |
Set NEW NOTE alert |
CANSLIM.net Company Profile |
SEC
News |
Chart |
Request a new note
C
A N
S L
I M
|
Symbol/Exchange
Company Name
Industry Group |
PRICE |
CHANGE
(%Change) |
Day High |
Volume
(% DAV)
(% 50 day avg vol) |
52 Wk Hi
% From Hi |
Featured
Date |
Price
Featured |
Pivot Featured |
|
Max Buy |
RGR
-
NYSE
Sturm Ruger & Co Inc
CONSUMER DURABLES - Sporting Goods
|
$73.96
|
+2.46
3.44% |
$74.23
|
305,363
82.53% of 50 DAV
50 DAV is 370,000
|
$85.93
-13.93%
|
1/8/2014
|
$78.87
|
PP = $80.38
|
|
MB = $84.40
|
Most Recent Note - 2/4/2014 5:32:53 PM
G- Slumped further below its 50 DMA line with losses on higher volume after recently negating the prior breakout. Faces overhead supply up through the $85 level which may act as resistance. See the latest FSU analysis for more details and new annotated graphs.
>>> FEATURED STOCK ARTICLE : Slumped Into Prior Base Negating Breakout and Violated 50-Day Average - 2/4/2014
View all notes |
Set NEW NOTE alert |
CANSLIM.net Company Profile |
SEC
News |
Chart |
Request a new note
C
A N
S L
I M
|
SFUN
-
NYSE
Soufun Hldgs Ltd Ads A
INTERNET - Internet Information Providers
|
$78.49
|
+2.48
3.26% |
$79.47
|
1,580,326
127.75% of 50 DAV
50 DAV is 1,237,000
|
$95.39
-17.72%
|
10/17/2013
|
$58.02
|
PP = $53.87
|
|
MB = $56.56
|
Most Recent Note - 2/5/2014 2:20:47 PM
G - Down considerably with heavy volume behind today's volume-driven loss, violating its 50 DMA line and raising greater concerns while triggering a technical sell signal.
>>> FEATURED STOCK ARTICLE : 50-Day Moving Average Defines Near Term Support After Great Rally - 1/31/2014
View all notes |
Set NEW NOTE alert |
CANSLIM.net Company Profile |
SEC
News |
Chart |
Request a new note
C
A N
S L
I M
|
SILC
-
NASDAQ
Silicom Ltd
COMPUTER HARDWARE - Networking andamp; Communication Dev
|
$64.22
|
+1.20
1.90% |
$64.50
|
78,783
138.22% of 50 DAV
50 DAV is 57,000
|
$63.91
0.49%
|
12/23/2013
|
$44.62
|
PP = $46.25
|
|
MB = $48.56
|
Most Recent Note - 2/5/2014 12:33:09 PM
G - Still hovering near its 52-week high, extended from any sound base. Stubbornly holding its ground since a considerable gap up on 1/23/14 after reporting earnings +92% on +52% sales for the Dec '13 quarter, beating consensus estimates.
>>> FEATURED STOCK ARTICLE : Considerable Gap Up Following Strong Earnings Report - 1/23/2014
View all notes |
Set NEW NOTE alert |
CANSLIM.net Company Profile |
SEC
News |
Chart |
Request a new note
C
A N
S L
I M
|
ULTI
-
NASDAQ
Ultimate Software Group
INTERNET - Internet Software and Services
|
$158.48
|
+1.92
1.23% |
$158.63
|
274,329
151.56% of 50 DAV
50 DAV is 181,000
|
$168.43
-5.91%
|
1/27/2014
|
$153.75
|
PP = $162.98
|
|
MB = $171.13
|
Most Recent Note - 2/5/2014 12:40:46 PM
Y - Touched another new 52-week high then undercut its 50 DMA line following a "negative reversal" after reporting earnings +42% on +21% sales for the Dec '13 quarter. Prior gains confirmed a technical buy signal, yet recent reports cautioned members - "Broader market conditions (M criteria) argue for caution until at least one of the major averages produces a convincing follow through day of gains on higher volume."
>>> FEATURED STOCK ARTICLE : Forming New Base But Enduring Distributional Pressure - 1/27/2014
View all notes |
Set NEW NOTE alert |
CANSLIM.net Company Profile |
SEC
News |
Chart |
Request a new note
C
A N
S L
I M
|
VRX
-
NYSE
Valeant Pharmaceuticals
DRUGS - Drug Manufacturers - Other
|
$137.93
|
+3.50
2.60% |
$138.11
|
1,550,801
125.17% of 50 DAV
50 DAV is 1,239,000
|
$140.36
-1.73%
|
9/11/2013
|
$100.26
|
PP = $105.50
|
|
MB = $110.78
|
Most Recent Note - 2/4/2014 5:35:43 PM
G - Holding its ground perched near all-time highs, extended from any sound base. Its 50 DMA line ($120) defines near-term support to watch.
>>> FEATURED STOCK ARTICLE : Bullish Action Has Continued Despite Fundamental Concerns - 1/21/2014
View all notes |
Set NEW NOTE alert |
CANSLIM.net Company Profile |
SEC
News |
Chart |
Request a new note
C
A N
S L
I M
|
Symbol/Exchange
Company Name
Industry Group |
PRICE |
CHANGE
(%Change) |
Day High |
Volume
(% DAV)
(% 50 day avg vol) |
52 Wk Hi
% From Hi |
Featured
Date |
Price
Featured |
Pivot Featured |
|
Max Buy |
|
|
|
THESE ARE NOT BUY RECOMMENDATIONS!
Comments contained in the body of this report are technical
opinions only. The material herein has been obtained
from sources believed to be reliable and accurate, however,
its accuracy and completeness cannot be guaranteed.
This site is not an investment advisor, hence it does
not endorse or recommend any securities or other investments.
Any recommendation contained in this report may not
be suitable for all investors and it is not to be deemed
an offer or solicitation on our part with respect to
the purchase or sale of any securities. All trademarks,
service marks and trade names appearing in this report
are the property of their respective owners, and are
likewise used for identification purposes only.
This report is a service available
only to active Paid Premium Members.
You may opt-out of receiving report notifications
at any time. Questions or comments may be submitted
by writing to Premium Membership Services 665 S.E. 10 Street, Suite 201 Deerfield Beach, FL 33441-5634 or by calling 1-800-965-8307
or 954-785-1121.
|
|
|

