You are not logged in.
This means you
CAN ONLY VIEW reports that were published prior to Wednesday, April 9, 2025.
You
MUST UPGRADE YOUR MEMBERSHIP if you want to see any current reports.
AFTER MARKET UPDATE - TUESDAY, JANUARY 21ST, 2014
Previous After Market Report Next After Market Report >>>
|
|
|
|
DOW |
-44.12 |
16,414.44 |
-0.27% |
|
Volume |
739,873,630 |
-16% |
|
Volume |
1,909,492,330 |
-8% |
|
NASDAQ |
+28.18 |
4,225.76 |
+0.67% |
|
Advancers |
2,030 |
64% |
|
Advancers |
1,616 |
60% |
|
S&P 500 |
+5.10 |
1,843.80 |
+0.28% |
|
Decliners |
1,070 |
34% |
|
Decliners |
976 |
36% |
|
Russell 2000 |
+7.29 |
1,175.72 |
+0.62% |
|
52 Wk Highs |
230 |
|
|
52 Wk Highs |
236 |
|
|
S&P 600 |
+3.74 |
663.55 |
+0.57% |
|
52 Wk Lows |
23 |
|
|
52 Wk Lows |
13 |
|
|
 |
Breadth Positive as Indices Ended Mixed
Kenneth J. Gruneisen - Passed the CAN SLIM® Master's Exam
Behind Tuesday's mixed session the volume totals were reported lighter than the prior trading session's volume totals on the NYSE and on the Nasdaq exchange. Breadth was positive as advancers led decliners by nearly 2-1 on the NYSE and on 3-2 the Nasdaq exchange. There were 64 high-ranked companies from the CANSLIM.net Leaders List that made new 52-week highs and appeared on the CANSLIM.net BreakOuts Page, up from a total of 45 stocks on the prior session. The list of stocks hitting new 52-week highs expanded and easily outnumbered new lows on the Nasdaq exchange and on the NYSE. There were gains for 14 of the 20 high-ranked companies currently included on the Featured Stocks Page.
Stocks managed to climb back from their session lows and most sectors finished higher on the day. Corporate earnings were a factor in the session. Shares of Delta Airlines Inc (DAL +3.25%) rose after the company reported results that topped expectations. On the downside, Johnson & Johnson (JNJ -1.08%) fell as the company forecasted full-year earnings at the low-end of analysts' estimates. On the M&A front, Dow Chemical Co (DOW +6.64%) on reports that Third Point Management had taken a $1.3 billion stake in the company. Anheuser-Busch InBev SA/NV (BUD +2.25%) finished higher after the brewer announced plans to acquire Oriental Brewery from private equity firms KKR and Affinity Equity Partners.
Turning to fixed income markets, Treasuries finished little changed along the curve. The benchmark 10-year gave up just 1/16 of a point to yield 2.83%.
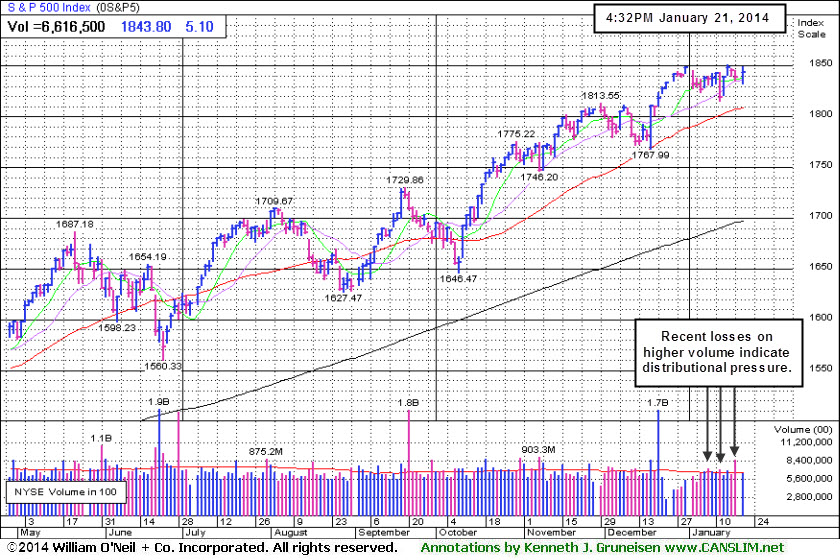
The Market (M criteria) rally has encountered distribution. Leadership (stocks hitting new highs) recently has waned, with experts at the newspaper noting after Monday's losses on higher volume that the uptrend has come under pressure. Any new buying efforts should be selective, and investors should be watchful for any individual issues flashing technical sell signals. The CANSLIM.net Featured Stocks Page shows the most action-worthy candidates and their latest notes and a Headline Link directs members to the latest detailed analysis with data-packed graphs annotated by a Certified expert along with links to additional resources. The Premium Member Homepage includes "dynamic archives" to all prior pay reports published. Watch for an announcement via email concerning the next WEBCAST.
PICTURED: The S&P 500 Index continues to find resistance at the 1,850 level. The market has recently encountered distributional pressure marked by losses on higher and above average volume.
|
 Kenneth J. Gruneisen started out as a licensed stockbroker in August 1987, a couple of months prior to the historic stock market crash that took the Dow Jones Industrial Average down -22.6% in a single day. He has published daily fact-based fundamental and technical analysis on high-ranked stocks online for two decades. Through FACTBASEDINVESTING.COM, Kenneth provides educational articles, news, market commentary, and other information regarding proven investment systems that work in good times and bad.
Comments contained in the body of this report are technical opinions only and are not necessarily those of Gruneisen Growth Corp. The material herein has been obtained from sources believed to be reliable and accurate, however, its accuracy and completeness cannot be guaranteed. Our firm, employees, and customers may effect transactions, including transactions contrary to any recommendation herein, or have positions in the securities mentioned herein or options with respect thereto. Any recommendation contained in this report may not be suitable for all investors and it is not to be deemed an offer or solicitation on our part with respect to the purchase or sale of any securities. |
|
 |
Financial, Tech, and Commodity-Linked Groups Rose
Kenneth J. Gruneisen - Passed the CAN SLIM® Master's Exam
Financial shares had a positive influence on the major averages as the Broker/Dealer Index ($XBD +0.93%) and Bank Index ($BKX +1.11%) posted gains on Tuesday. The Biotechnology Index ($BTK +2.28%) led the tech sector while the Networking Index ($NWX +0.44%) and the Semiconductor Index ($SOX +0.62%) both edged higher. Energy-related shares had a mildly positive bias as the Integrated Oil Index ($XOI +0.63%) and the Oil Services Index ($OSX +0.54%) both posted modest gains. The Gold & Silver Index ($XAU +1.38%) also finished higher, meanwhile the Retail Index ($RLX -0.01%) finished flat.
Charts courtesy www.stockcharts.com
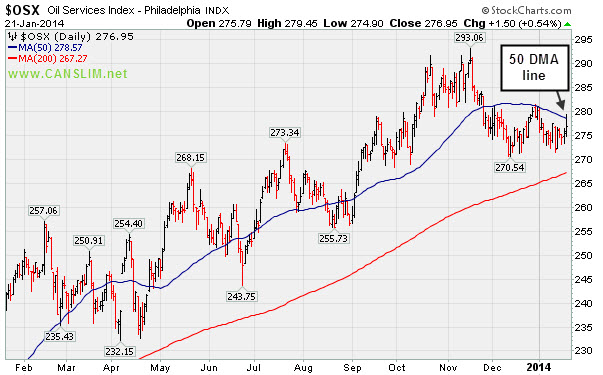
PICTURED: The Oil Services Index ($OSX +0.54%) has been consolidating below its 50-day moving average (DMA) line since November.
| Oil Services |
$OSX |
276.95 |
+1.50 |
+0.54% |
-1.45% |
| Integrated Oil |
$XOI |
1,469.14 |
+9.18 |
+0.63% |
-2.26% |
| Semiconductor |
$SOX |
541.50 |
+3.36 |
+0.62% |
+1.21% |
| Networking |
$NWX |
336.27 |
+1.48 |
+0.44% |
+3.81% |
| Broker/Dealer |
$XBD |
162.82 |
+1.49 |
+0.93% |
+1.41% |
| Retail |
$RLX |
912.00 |
-0.10 |
-0.01% |
-2.96% |
| Gold & Silver |
$XAU |
93.57 |
+1.27 |
+1.38% |
+11.19% |
| Bank |
$BKX |
71.09 |
+0.78 |
+1.11% |
+2.64% |
| Biotech |
$BTK |
2,627.38 |
+58.48 |
+2.28% |
+12.74% |
|
|
|
 |
Bullish Action Has Continued Despite Fundamental Concerns
Kenneth J. Gruneisen - Passed the CAN SLIM® Master's Exam
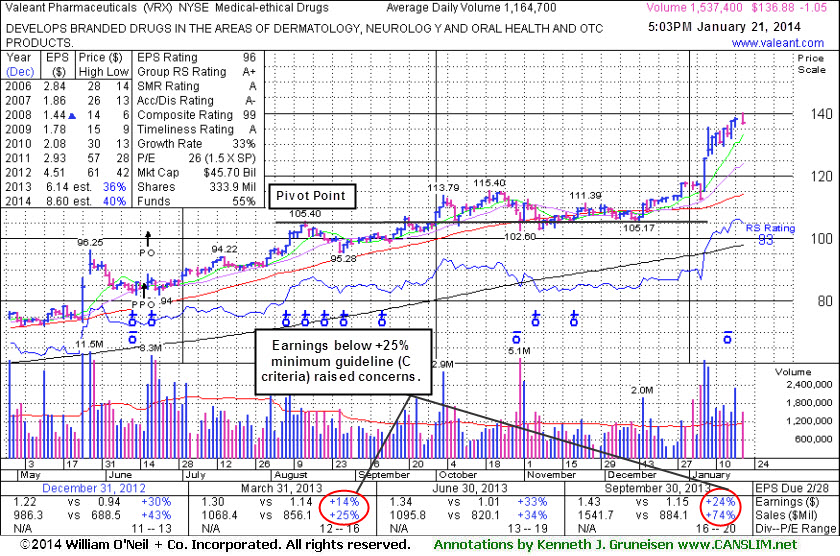
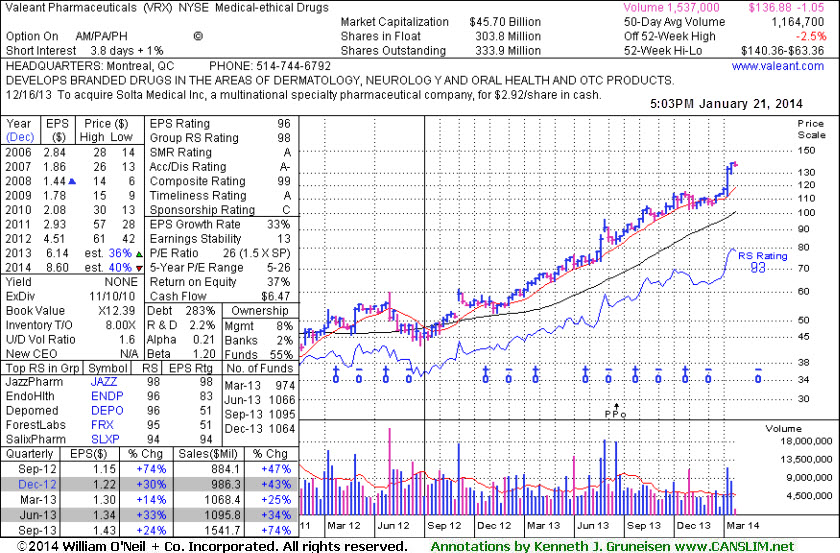
Valeant Pharmaceuticals International, Inc (VRX -$1.05 or -0.76% to $136.88) touched a new all-time high then reversed into the red today. It is extended from any sound base after a recent spurt of volume-driven gains. Its 50-day moving average (DMA) line and prior highs near $115 define near-term support to watch. Bullish action continued since VRX was last shown in this FSU section on 12/18/13 with annotated daily and weekly graphs under the headline, "Rebounding With Volume Backed Gains But Fundamental Concerns Remain". It reported earnings +24% on +74% sales revenues for the Sep '13 quarter, a notch below the +25% minimum guideline (C criteria), so prior reports cautioned members -"While it may be forming a sound new base, fundamentals may be an overriding concern."
Earnings rose +33% on +34% sales revenues for the Jun '13 quarter, above the +25% minimum earnings guideline (C criteria) a strong follow-up after concerns had been raised by its Mar '13 earnings report with only a +14% earnings increase (see red circles). A downturn in FY '07 and '08 earnings (A criteria) has been followed by a strong earnings rebound in recent years. Return On Equity is currently reported at 37%, well above the 17% minimum guideline of the fact-based system.
The number of top-rated funds owning its shares rose from 818 in Mar '12 in to 1,064 in Dec '13, a reassuring trend concerning the I criteria. The high-ranked Medical - Ethical Drugs firm's shares spiked higher in late May at around the time of M&A news that it would buy Bausch & Lomb for $8.7 billion. It completed Public Offering on 6/18/13. The upshot of Public Offerings is that when completed the end result is typically an increase in the total number of institutional owners. Institutional owners are often supportive of their existing positions and will even accumulate more shares when they consolidate near classic support levels like the 50-day and 200-day moving average (DMA) lines, if they are still believers in the company. If too many become pessimistic and decide to unload, this is what ends up sending the stocks slicing through support.
Prior reports noted - "Investors are taught in the Certification to only buy stocks with a combination of both strong fundamentals and strong technical action, however stocks should be sold based on their technical action only. In this example, more bullish action rewarded patient investors still giving it the benefit of the doubt until any technical sell signals start adding up."
|
|
|
Color Codes Explained :
Y - Better candidates highlighted by our
staff of experts.
G - Previously featured
in past reports as yellow but may no longer be buyable under the
guidelines.
***Last / Change / Volume data in this table is the closing quote data***
Symbol/Exchange
Company Name
Industry Group |
PRICE |
CHANGE
(%Change) |
Day High |
Volume
(% DAV)
(% 50 day avg vol) |
52 Wk Hi
% From Hi |
Featured
Date |
Price
Featured |
Pivot Featured |
|
Max Buy |
ARMH
-
NASDAQ
A R M Holdings Plc Ads
ELECTRONICS - Semiconductor - Specialized
|
$49.45
|
+0.67
1.37% |
$49.69
|
1,096,830
67.68% of 50 DAV
50 DAV is 1,620,700
|
$55.26
-10.51%
|
12/23/2013
|
$54.59
|
PP = $52.48
|
|
MB = $55.10
|
 Most Recent Note - 1/21/2014 3:14:22 PM
G - Still consolidating near its 50 DMA line ($49.60) which has acted as resistance following damaging losses which triggered technical sell signals. Disciplined investors always limit losses by selling any stock that falls more than -7% from their purchase price.
>>> FEATURED STOCK ARTICLE : No Overhead Supply Remains Following Volume-Driven Breakout - 12/23/2013
View all notes |
Set NEW NOTE alert |
CANSLIM.net Company Profile |
SEC
News |
Chart |
Request a new note
C
A N
S L
I M


|
BITA
-
NYSE
Bitauto Hldgs Ltd Ads
INTERNET - Internet Information Providers
|
$37.81
|
+1.44
3.96% |
$37.94
|
1,343,940
98.00% of 50 DAV
50 DAV is 1,371,400
|
$39.25
-3.67%
|
1/8/2014
|
$33.00
|
PP = $35.14
|
|
MB = $36.90
|
Most Recent Note - 1/21/2014 3:16:48 PM
G - Poised for a best-ever close with today's gain lifting it beyond its "max buy" level. Prior highs in the $35 area define support to watch above its 50 DMA line.
>>> FEATURED STOCK ARTICLE : Finished Strong and Challenged Pivot Point After Highlighted in Mid-Day Report - 1/8/2014
View all notes |
Set NEW NOTE alert |
CANSLIM.net Company Profile |
SEC
News |
Chart |
Request a new note
C
A N
S L
I M
|
CELG
-
NASDAQ
Celgene Corp
DRUGS - Drug Manufacturers - Major
|
$168.55
|
+1.51
0.90% |
$168.74
|
2,408,507
85.95% of 50 DAV
50 DAV is 2,802,200
|
$174.66
-3.50%
|
9/12/2013
|
$149.50
|
PP = $150.02
|
|
MB = $157.52
|
Most Recent Note - 1/21/2014 3:18:01 PM
G - Hovering within close striking distance of its 52-week high and still consolidating above its 50 DMA line which has acted as support recently. Subsequent violations would raise greater concerns and trigger technical sell signals.
>>> FEATURED STOCK ARTICLE : Found Support Above 50-Day Average After Gapping Down on Prior Session - 1/7/2014
View all notes |
Set NEW NOTE alert |
CANSLIM.net Company Profile |
SEC
News |
Chart |
Request a new note
C
A N
S L
I M
|
EGOV
-
NASDAQ
N I C Inc
INTERNET - Internet Software and Services
|
$23.39
|
-0.23
-0.97% |
$23.96
|
262,976
100.60% of 50 DAV
50 DAV is 261,400
|
$25.99
-10.00%
|
12/20/2013
|
$24.00
|
PP = $26.09
|
|
MB = $27.39
|
Most Recent Note - 1/21/2014 3:18:49 PM
G - Quietly sputtering below its 50 DMA line. A rally above recent resistance in the $25-26 area is needed for its technical stance to turn bullish. Meanwhile, a violation of the recent low ($22.17 on 12/16/13) would raise concern as that level defines near-term support above its 200 DMA line.
>>> FEATURED STOCK ARTICLE : Rebounded Above 50-Day Average; Relative Strength Rating Waned - 12/27/2013
View all notes |
Set NEW NOTE alert |
CANSLIM.net Company Profile |
SEC
News |
Chart |
Request a new note
C
A N
S L
I M
|
EQM
-
NYSE
E Q T Midstream Partners
ENERGY - Oil and Gas Pipelines
|
$61.00
|
+0.33
0.54% |
$61.28
|
72,137
62.40% of 50 DAV
50 DAV is 115,600
|
$62.07
-1.72%
|
12/12/2013
|
$53.17
|
PP = $56.51
|
|
MB = $59.34
|
Most Recent Note - 1/17/2014 5:28:02 PM
G - Reversed into the red again today for a loss on light volume. It is very extended from any sound base pattern, and prior highs in the $56 area define support to watch on pullbacks. See the latest FSU analysis for more details and new annotated graphs.
>>> FEATURED STOCK ARTICLE : Extended From Base After Six Consecutive Weekly Gains - 1/17/2014
View all notes |
Set NEW NOTE alert |
CANSLIM.net Company Profile |
SEC
News |
Chart |
Request a new note
C
A N
S L
I M
|
Symbol/Exchange
Company Name
Industry Group |
PRICE |
CHANGE
(%Change) |
Day High |
Volume
(% DAV)
(% 50 day avg vol) |
52 Wk Hi
% From Hi |
Featured
Date |
Price
Featured |
Pivot Featured |
|
Max Buy |
FB
-
NASDAQ
Facebook Inc Cl A
INTERNET
|
$58.51
|
+2.21
3.93% |
$58.58
|
48,649,332
74.79% of 50 DAV
50 DAV is 65,043,900
|
$58.96
-0.76%
|
12/12/2013
|
$51.40
|
PP = $54.93
|
|
MB = $57.68
|
Most Recent Note - 1/21/2014 5:25:12 PM
G - Rallied for a best-ever close with today's gain backed below average volume. Prior highs in the $54 area acted as support during its recent consolidation. Disciplined investors always limit losses by selling any stock that falls more than -7% from their purchase price.
>>> FEATURED STOCK ARTICLE : Following New Offering Prior Highs Acted As Support - 1/15/2014
View all notes |
Set NEW NOTE alert |
CANSLIM.net Company Profile |
SEC
News |
Chart |
Request a new note
C
A N
S L
I M
|
GNRC
-
NYSE
Generac Hldgs Inc
CONSUMER DURABLES - Electronic Equipment
|
$51.58
|
+1.72
3.45% |
$51.79
|
995,850
150.45% of 50 DAV
50 DAV is 661,900
|
$57.29
-9.97%
|
11/26/2013
|
$53.02
|
PP = $52.42
|
|
MB = $55.04
|
Most Recent Note - 1/21/2014 3:24:08 PM
G - Today's gain has it rebounding toward its 50 DMA line which may act as resistance after volume-driven losses raised concerns last week. A prompt rebound above its 50 DMA line is needed for its outlook to improve.
>>> FEATURED STOCK ARTICLE : Volume Totals Cooling While Holding Ground Near Highs - 1/2/2014
View all notes |
Set NEW NOTE alert |
CANSLIM.net Company Profile |
SEC
News |
Chart |
Request a new note
C
A N
S L
I M
|
HLF
-
NYSE
Herbalife Ltd
DRUGS - Nutrition and Weight Management
|
$72.94
|
+2.74
3.90% |
$73.09
|
2,518,448
82.11% of 50 DAV
50 DAV is 3,067,100
|
$83.51
-12.66%
|
11/22/2013
|
$72.21
|
PP = $75.04
|
|
MB = $78.79
|
Most Recent Note - 1/21/2014 3:25:12 PM
G - Halted its slide today after damaging losses last week undercut prior highs in the $74 area and violated its 50 DMA line triggering technical sell signals. Disciplined investors always limit losses if any stock falls more than -7% from their purchase price.
>>> FEATURED STOCK ARTICLE : Volume Totals Cooling While Perched Near Highs - 12/30/2013
View all notes |
Set NEW NOTE alert |
CANSLIM.net Company Profile |
SEC
News |
Chart |
Request a new note
C
A N
S L
I M
|
JAZZ
-
NASDAQ
Jazz Pharmaceuticals Plc
DRUGS - Biotechnology
|
$153.17
|
+3.15
2.10% |
$154.88
|
867,721
110.89% of 50 DAV
50 DAV is 782,500
|
$152.94
0.15%
|
9/30/2013
|
$93.20
|
PP = $89.10
|
|
MB = $93.56
|
Most Recent Note - 1/21/2014 3:20:06 PM
G - Hitting another new 52-week high today with its 4th consecutive gain, very extended from any sound base. Its 50 DMA line defines important support to watch on pullbacks.
>>> FEATURED STOCK ARTICLE : Very Extended From Sound Base Following Big Volume-Driven Gains - 1/14/2014
View all notes |
Set NEW NOTE alert |
CANSLIM.net Company Profile |
SEC
News |
Chart |
Request a new note
C
A N
S L
I M
|
KORS
-
NYSE
Michael Kors Hldgs Ltd
RETAIL - Apparel Stores
|
$77.20
|
+0.17
0.22% |
$77.75
|
3,012,598
71.28% of 50 DAV
50 DAV is 4,226,400
|
$84.58
-8.73%
|
8/6/2013
|
$69.66
|
PP = $66.28
|
|
MB = $69.59
|
Most Recent Note - 1/16/2014 1:20:15 PM
G - Gapped down today, slumping further below its 50 DMA line. Damaging losses on higher volume indicate distributional pressure. Reports quarterly financial results on Tuesday, February 4, 2014, before the market opens.
>>> FEATURED STOCK ARTICLE : Technical Deterioration and RS Rating Slump Raises Concerns - 1/9/2014
View all notes |
Set NEW NOTE alert |
CANSLIM.net Company Profile |
SEC
News |
Chart |
Request a new note
C
A N
S L
I M
|
Symbol/Exchange
Company Name
Industry Group |
PRICE |
CHANGE
(%Change) |
Day High |
Volume
(% DAV)
(% 50 day avg vol) |
52 Wk Hi
% From Hi |
Featured
Date |
Price
Featured |
Pivot Featured |
|
Max Buy |
MRLN
-
NASDAQ
Marlin Business Services
DIVERSIFIED SERVICES - Rental and Leasing Services
|
$28.27
|
+0.05
0.18% |
$29.58
|
44,813
145.03% of 50 DAV
50 DAV is 30,900
|
$29.39
-3.81%
|
12/19/2013
|
$26.69
|
PP = $28.74
|
|
MB = $30.18
|
Most Recent Note - 1/17/2014 5:32:01 PM
Y - Retreated from its 52-week high today with a loss on near average after 2 consecutive volume-driven gains triggered a technical buy signal. No resistance remains due to overhead supply.
>>> FEATURED STOCK ARTICLE : Finished Weak While Enduring Distributional Pressure - 12/19/2013
View all notes |
Set NEW NOTE alert |
CANSLIM.net Company Profile |
SEC
News |
Chart |
Request a new note
C
A N
S L
I M
|
PCLN
-
NASDAQ
Priceline.Com Inc
INTERNET - Internet Software and Services
|
$1,205.95
|
+27.91
2.37% |
$1,206.98
|
754,141
124.88% of 50 DAV
50 DAV is 603,900
|
$1,198.75
0.60%
|
12/18/2013
|
$1,156.20
|
PP = $1,198.85
|
|
MB = $1,258.79
|
Most Recent Note - 1/16/2014 12:46:57 PM
Y - Perched within close striking distance of its 52-week high while consolidating above its 50 DMA line which has recently acted as support. A volume-driven gain above its pivot point may trigger a technical buy signal, meanwhile, its 50 DMA line and prior low ($1,113.01 on 1/06/13) define near-term support to watch.
>>> FEATURED STOCK ARTICLE : Managed Positive Reversal at 50-Day Moving Average Line - 1/6/2014
View all notes |
Set NEW NOTE alert |
CANSLIM.net Company Profile |
SEC
News |
Chart |
Request a new note
C
A N
S L
I M
|
RGR
-
NYSE
Sturm Ruger & Co Inc
CONSUMER DURABLES - Sporting Goods
|
$77.67
|
-2.67
-3.32% |
$80.81
|
802,267
239.13% of 50 DAV
50 DAV is 335,500
|
$85.93
-9.61%
|
1/8/2014
|
$78.87
|
PP = $80.38
|
|
MB = $84.40
|
Most Recent Note - 1/21/2014 12:16:01 PM
Y - Retreating from its 52-week high following a streak of gains, undercutting prior highs. Previously noted - "Prior highs in the $80 area define initial support to watch on pullbacks. Disciplined investors always limit losses by selling any stock if it falls more than -7% from their purchase price."
>>> FEATURED STOCK ARTICLE : Hit New Highs With 6th Consecutive Gain - 1/13/2014
View all notes |
Set NEW NOTE alert |
CANSLIM.net Company Profile |
SEC
News |
Chart |
Request a new note
C
A N
S L
I M
|
SFUN
-
NYSE
Soufun Hldgs Ltd Ads A
INTERNET - Internet Information Providers
|
$88.07
|
+1.62
1.87% |
$89.14
|
1,212,940
101.31% of 50 DAV
50 DAV is 1,197,200
|
$93.49
-5.80%
|
10/17/2013
|
$58.02
|
PP = $53.87
|
|
MB = $56.56
|
Most Recent Note - 1/16/2014 1:23:20 PM
G - Volume totals have been cooling while remaining perched near its all-time high, stubbornly holding its ground. Its 50 DMA line defines important support to watch on pullbacks. Repeatedly noted - "Extended from any sound base."
>>> FEATURED STOCK ARTICLE : Extended From Base Following More Volume-Driven Gains - 1/10/2014
View all notes |
Set NEW NOTE alert |
CANSLIM.net Company Profile |
SEC
News |
Chart |
Request a new note
C
A N
S L
I M
|
SILC
-
NASDAQ
Silicom Ltd
COMPUTER HARDWARE - Networking andamp; Communication Dev
|
$46.85
|
-0.38
-0.80% |
$47.28
|
38,920
116.18% of 50 DAV
50 DAV is 33,500
|
$47.70
-1.78%
|
12/23/2013
|
$44.62
|
PP = $46.25
|
|
MB = $48.56
|
Most Recent Note - 1/16/2014 1:29:34 PM
Y - Inching to yet another new 52-week high with today's 10th consecutive small gain, yet it remains below its "max buy" level. Last noted on 1/13/14, its small gain on the session with +122% above average volume confirmed a technical buy signal.
>>> FEATURED STOCK ARTICLE : Stock With Small Supply Has Formed a Sound Base Pattern - 12/24/2013
View all notes |
Set NEW NOTE alert |
CANSLIM.net Company Profile |
SEC
News |
Chart |
Request a new note
C
A N
S L
I M
|
Symbol/Exchange
Company Name
Industry Group |
PRICE |
CHANGE
(%Change) |
Day High |
Volume
(% DAV)
(% 50 day avg vol) |
52 Wk Hi
% From Hi |
Featured
Date |
Price
Featured |
Pivot Featured |
|
Max Buy |
SSNC
-
NASDAQ
S S & C Technologies
COMPUTER SOFTWARE and SERVICES - Application Software
|
$43.02
|
-0.20
-0.46% |
$44.18
|
253,293
96.16% of 50 DAV
50 DAV is 263,400
|
$46.61
-7.69%
|
10/22/2013
|
$39.17
|
PP = $40.04
|
|
MB = $42.04
|
Most Recent Note - 1/16/2014 5:45:31 PM
G - Down with above average volume for a 2nd day in a row and finished near the session low, enduring distributional pressure. See the latest FSU analysis for more details and new annotated graphs.
>>> FEATURED STOCK ARTICLE : Enduring Distributional Pressure While Retreating Near Prior Highs - 1/16/2014
View all notes |
Set NEW NOTE alert |
CANSLIM.net Company Profile |
SEC
News |
Chart |
Request a new note
C
A N
S L
I M
|
ULTI
-
NASDAQ
Ultimate Software Group
INTERNET - Internet Software and Services
|
$157.45
|
+0.40
0.25% |
$159.31
|
134,800
100.37% of 50 DAV
50 DAV is 134,300
|
$162.88
-3.33%
|
10/16/2013
|
$142.95
|
PP = $151.18
|
|
MB = $158.74
|
Most Recent Note - 1/15/2014 5:58:28 PM
G - Consolidating just above its 50 DMA line, enduring distributional pressure with 4 losses on above average volume in the past 5 sessions. Recent low ($144.04 on 12/12/13) defines the next near-term support to watch.
>>> FEATURED STOCK ARTICLE : Gain on Light Volume While Inching Above 50-Day Average - 12/26/2013
View all notes |
Set NEW NOTE alert |
CANSLIM.net Company Profile |
SEC
News |
Chart |
Request a new note
C
A N
S L
I M
|
VRX
-
NYSE
Valeant Pharmaceuticals
DRUGS - Drug Manufacturers - Other
|
$136.88
|
-1.05
-0.76% |
$140.36
|
1,537,486
132.01% of 50 DAV
50 DAV is 1,164,700
|
$138.57
-1.22%
|
9/11/2013
|
$100.26
|
PP = $105.50
|
|
MB = $110.78
|
Most Recent Note - 1/21/2014 5:22:41 PM
G - Touched a new all-time high then reversed into the red today. It is extended from any sound base after volume-driven gains. Its 50 DMA line and prior highs near $115 define near-term support to watch. See the latest FSU analysis for more details and new annotated graphs.
>>> FEATURED STOCK ARTICLE : Bullish Action Has Continued Despite Fundamental Concerns - 1/21/2014
View all notes |
Set NEW NOTE alert |
CANSLIM.net Company Profile |
SEC
News |
Chart |
Request a new note
C
A N
S L
I M
|
YNDX
-
NASDAQ
Yandex N V Class A
INTERNET - Internet Information Providers
|
$43.66
|
+0.64
1.49% |
$43.80
|
1,859,448
78.54% of 50 DAV
50 DAV is 2,367,600
|
$45.42
-3.87%
|
11/27/2013
|
$39.61
|
PP = $42.10
|
|
MB = $44.21
|
Most Recent Note - 1/21/2014 3:22:23 PM
Y - Quietly hovering near its 52-week high, holding its ground stubbornly. It remains below its "max buy" level after bullish action in recent weeks.
>>> FEATURED STOCK ARTICLE : Best Ever Close With Gain on Light Volume - 12/31/2013
View all notes |
Set NEW NOTE alert |
CANSLIM.net Company Profile |
SEC
News |
Chart |
Request a new note
C
A N
S L
I M
|
YY
-
NASDAQ
YY Inc Ads
INTERNET - Internet Service Providers
|
$67.54
|
-3.86
-5.41% |
$72.50
|
2,670,351
176.04% of 50 DAV
50 DAV is 1,516,900
|
$72.78
-7.20%
|
1/3/2014
|
$55.08
|
PP = $56.85
|
|
MB = $59.69
|
Most Recent Note - 1/21/2014 12:26:31 PM
G - Extended from any sound base after recent volume-driven gains. Prior highs in the $56 area define initial support to watch on pullbacks.
>>> FEATURED STOCK ARTICLE : Finished Strong With High Volume After Featured in Mid-Day Report - 1/3/2014
View all notes |
Set NEW NOTE alert |
CANSLIM.net Company Profile |
SEC
News |
Chart |
Request a new note
C
A N
S L
I M
|
Symbol/Exchange
Company Name
Industry Group |
PRICE |
CHANGE
(%Change) |
Day High |
Volume
(% DAV)
(% 50 day avg vol) |
52 Wk Hi
% From Hi |
Featured
Date |
Price
Featured |
Pivot Featured |
|
Max Buy |
|
|
|
THESE ARE NOT BUY RECOMMENDATIONS!
Comments contained in the body of this report are technical
opinions only. The material herein has been obtained
from sources believed to be reliable and accurate, however,
its accuracy and completeness cannot be guaranteed.
This site is not an investment advisor, hence it does
not endorse or recommend any securities or other investments.
Any recommendation contained in this report may not
be suitable for all investors and it is not to be deemed
an offer or solicitation on our part with respect to
the purchase or sale of any securities. All trademarks,
service marks and trade names appearing in this report
are the property of their respective owners, and are
likewise used for identification purposes only.
This report is a service available
only to active Paid Premium Members.
You may opt-out of receiving report notifications
at any time. Questions or comments may be submitted
by writing to Premium Membership Services 665 S.E. 10 Street, Suite 201 Deerfield Beach, FL 33441-5634 or by calling 1-800-965-8307
or 954-785-1121.
|
|
|

