You are not logged in.
This means you
CAN ONLY VIEW reports that were published prior to Wednesday, April 9, 2025.
You
MUST UPGRADE YOUR MEMBERSHIP if you want to see any current reports.
AFTER MARKET UPDATE - FRIDAY, JANUARY 17TH, 2014
Previous After Market Report Next After Market Report >>>
|
|
|
|
DOW |
+41.55 |
16,458.56 |
+0.25% |
|
Volume |
879,845,850 |
+37% |
|
Volume |
2,072,411,570 |
+12% |
|
NASDAQ |
-21.11 |
4,197.58 |
-0.50% |
|
Advancers |
1,244 |
40% |
|
Advancers |
1,067 |
40% |
|
S&P 500 |
-7.19 |
1,838.70 |
-0.39% |
|
Decliners |
1,799 |
57% |
|
Decliners |
1,528 |
57% |
|
Russell 2000 |
-4.70 |
1,168.43 |
-0.40% |
|
52 Wk Highs |
182 |
|
|
52 Wk Highs |
170 |
|
|
S&P 600 |
-3.38 |
659.81 |
-0.51% |
|
52 Wk Lows |
22 |
|
|
52 Wk Lows |
16 |
|
|
 |
Major Averages Showed Mixed Action While Leadership Waned
Kenneth J. Gruneisen - Passed the CAN SLIM® Master's Exam
For the week, the Dow gained +0.1%, the NASDAQ rose +0.6% while the S&P 500 declined -0.2%. Behind Friday's mixed session the volume totals were reported higher than the prior trading session's volume totals on the NYSE and on the Nasdaq exchange. The institutional crowd appeared to be pressuring the market as breadth was negative while decliners led advancers by nearly 3-2 on the NYSE and on the Nasdaq exchange. There were 45 high-ranked companies from the CANSLIM.net Leaders List that made new 52-week highs and appeared on the CANSLIM.net BreakOuts Page, down from a total of 63 stocks on the prior session. The list of stocks hitting new 52-week highs contracted yet new highs still easily outnumbered new lows on the Nasdaq exchange and on the NYSE. There were gains for 7 of the 20 high-ranked companies currently included on the Featured Stocks Page.
Stocks were mixed on Friday's session. The Dow advanced 42 points to 16,458. The S&P 500 fell 7 points to 1,838. The NASDAQ shed 21 points to close at 4,197. The major averages experienced a choppy trading session as investors weighed the latest earnings releases. General Electric Co (GE -2.3%) fell as the company's in-line quarterly results included weaker-than-expected margins in its manufacturing businesses. American Express (AXP +3.6%) rose after posting profits above consensus estimates.
Nine of 10 sectors in the S&P 500 finished in negative territory. Technology was the worst performing group. Intel Corp (INTC -2.6%) fell after providing a cautious revenue forecast. Energy was the lone sector up on the session paced by Schlumberger (SLB +1.8%) advancing on its positive earnings results.
On the economic front, the Commerce Department reported housing starts declined -9.8% in December. Updates on manufacturing revealed industrial production rose for a fifth straight month and capacity utilization increased modestly. A preliminary reading from the University of Michigan showed an unexpected decline consumer sentiment in January.
Treasuries advanced on today’s session. Benchmark 10-year notes rose 6/32 to yield 2.82%.
The U.S. market is closed Monday in observance of Martin Luther King Day. When trading resumes on Tuesday, attention will be on overseas data releases.
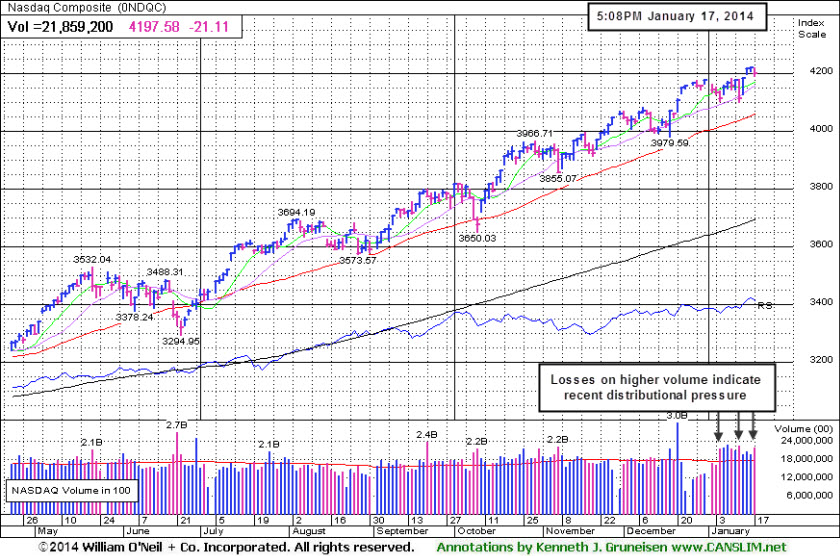
The Market (M criteria) rally has encountered distribution. Leadership (stocks hitting new highs) recently has waned, with experts at the newspaper noting after Monday's losses on higher volume that the uptrend has come under pressure. Any new buying efforts should be selective, and investors should be watchful for any individual issues flashing technical sell signals. The CANSLIM.net Featured Stocks Page shows the most action-worthy candidates and their latest notes and a Headline Link directs members to the latest detailed analysis with data-packed graphs annotated by a Certified expert along with links to additional resources. The Premium Member Homepage includes "dynamic archives" to all prior pay reports published. Watch for an announcement via email concerning the next WEBCAST.
PICTURED: The Nasdaq Composite Index has encountered distributional pressure marked by losses on higher and above average volume in recent weeks including Friday's session, yet the tech-heavy index remains perched near its 2014 high.
|
 Kenneth J. Gruneisen started out as a licensed stockbroker in August 1987, a couple of months prior to the historic stock market crash that took the Dow Jones Industrial Average down -22.6% in a single day. He has published daily fact-based fundamental and technical analysis on high-ranked stocks online for two decades. Through FACTBASEDINVESTING.COM, Kenneth provides educational articles, news, market commentary, and other information regarding proven investment systems that work in good times and bad.
Comments contained in the body of this report are technical opinions only and are not necessarily those of Gruneisen Growth Corp. The material herein has been obtained from sources believed to be reliable and accurate, however, its accuracy and completeness cannot be guaranteed. Our firm, employees, and customers may effect transactions, including transactions contrary to any recommendation herein, or have positions in the securities mentioned herein or options with respect thereto. Any recommendation contained in this report may not be suitable for all investors and it is not to be deemed an offer or solicitation on our part with respect to the purchase or sale of any securities. |
|
 |
Gold & Silver Index Rose While Most Groups Pulled Back
Kenneth J. Gruneisen - Passed the CAN SLIM® Master's Exam
The Gold & Silver Index ($XAU +2.73%) was a standout gainer while most groups ended lower on Friday. The Semiconductor Index ($SOX -0.54%) and Networking Index ($NWX -0.39%) suffered modest losses while the Biotechnology Index ($BTK -0.06%) finished flat. The Retail Index ($RLX -0.21%) edged lower and financial shares also had a slightly negative bias as the Broker/Dealer Index ($XBD -0.46%) and Bank Index ($BKX -0.34%) ended with small losses. Energy-related shares were mixed as the Integrated Oil Index ($XOI -0.32%) edged lower while the Oil Services Index ($OSX +0.31%) eked out a small gain.
Charts courtesy www.stockcharts.com
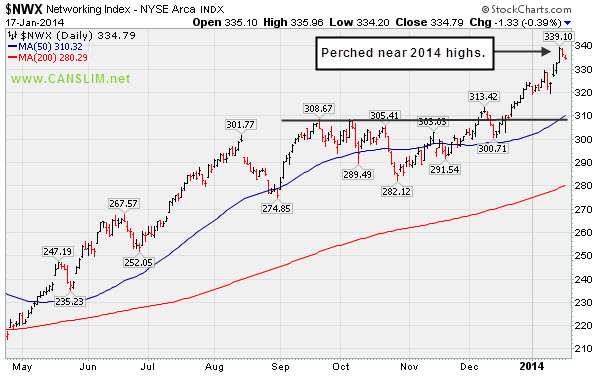
PICTURED: The Networking Index ($NWX -0.39%) is perched near its 2014 highs.
| Oil Services |
$OSX |
275.45 |
+0.84 |
+0.31% |
-1.99% |
| Integrated Oil |
$XOI |
1,459.95 |
-4.71 |
-0.32% |
-2.87% |
| Semiconductor |
$SOX |
538.14 |
-2.91 |
-0.54% |
+0.58% |
| Networking |
$NWX |
334.79 |
-1.33 |
-0.39% |
+3.35% |
| Broker/Dealer |
$XBD |
161.33 |
-0.74 |
-0.46% |
+0.48% |
| Retail |
$RLX |
912.10 |
-1.90 |
-0.21% |
-2.95% |
| Gold & Silver |
$XAU |
92.30 |
+2.45 |
+2.73% |
+9.69% |
| Bank |
$BKX |
70.31 |
-0.24 |
-0.34% |
+1.52% |
| Biotech |
$BTK |
2,568.90 |
-1.57 |
-0.06% |
+10.23% |
|
|
|
 |
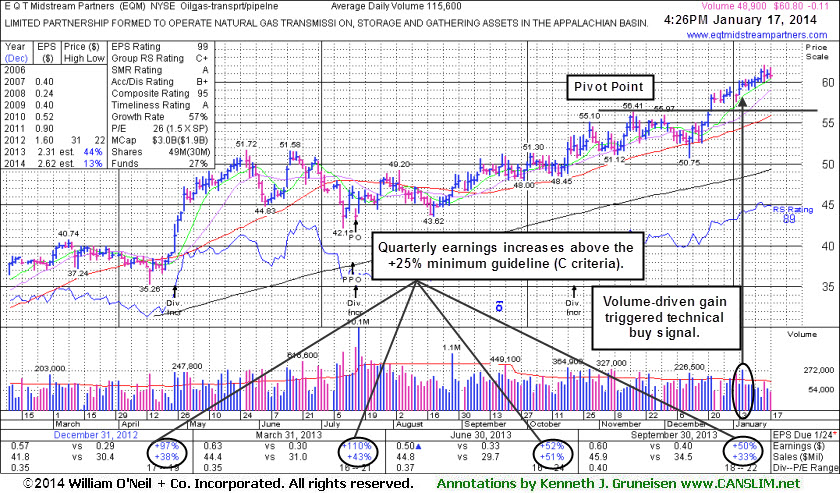
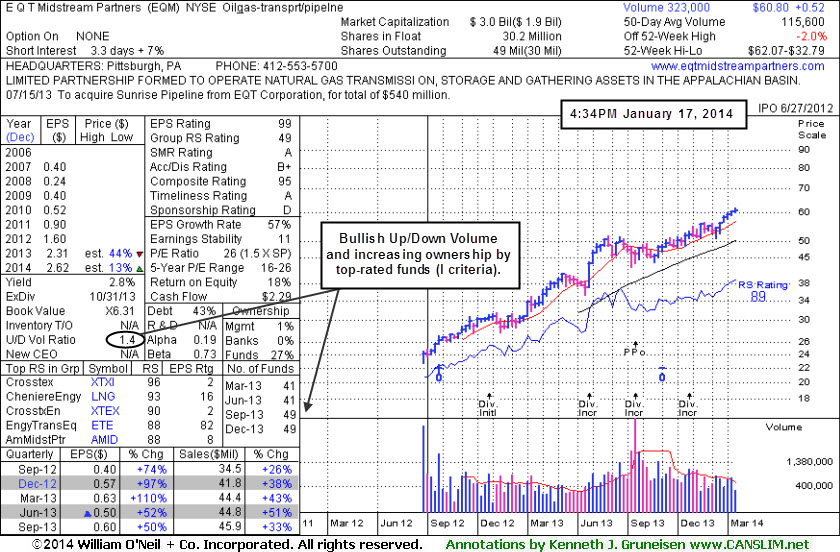
Extended From Base After Six Consecutive Weekly Gains
Kenneth J. Gruneisen - Passed the CAN SLIM® Master's Exam
E Q T Midstream Partners (EQM -$0.24 or -0.39% to $60.67) is quietly perched near its all-time high following a "negative reversal" on 1/15/14 after a streak of 4 consecutive gains on lighter volume. It is extended from any sound base pattern, and its weekly graph shows that it has tallied 6 consecutive weekly gains. Its last appearance in this FSU section was on 12/13/13 under the headline, "Finding Support Near 50-Day Moving Average While Perched Near Highs", after highlighted in yellow in the 12/12/13 mid-day report (read here) with new pivot point cited based on its 11/18/13 high plus 10 cents. It inched into new high territory with light volume, then subsequent volume-driven gains triggered a technical buy signal.
Patient investors may watch for a new base or secondary buy point to possibly develop and be noted in the weeks ahead. Meanwhile, near-term support is defined by its 50-day moving average (DMA) line and prior highs in the $56 area which closely coincide. Violations would raise concerns and trigger technical sell signals.
Recently it reported earnings +50% on +33% sales revenues for the Sep '13 quarter, continuing its strong earnings history (good C and A criteria). It completed a new Public Offering on 7/16/13, then made gradual progress afterward. This MLP in the Natural Gas business has seen the number of top-rated funds owning its shares rise from 20 in Jun '12 to 49 in Dec '13, a reassuring sign concerning the I criteria. Its Up/Down Volume Ratio of 1.4 is an unbiased indication its shares have been under accumulation over the past 50 days.
 |
|
|
Color Codes Explained :
Y - Better candidates highlighted by our
staff of experts.
G - Previously featured
in past reports as yellow but may no longer be buyable under the
guidelines.
***Last / Change / Volume data in this table is the closing quote data***
Symbol/Exchange
Company Name
Industry Group |
PRICE |
CHANGE
(%Change) |
Day High |
Volume
(% DAV)
(% 50 day avg vol) |
52 Wk Hi
% From Hi |
Featured
Date |
Price
Featured |
Pivot Featured |
|
Max Buy |
ARMH
-
NASDAQ
A R M Holdings Plc Ads
ELECTRONICS - Semiconductor - Specialized
|
$48.78
|
+0.13
0.27% |
$49.06
|
1,269,471
77.30% of 50 DAV
50 DAV is 1,642,300
|
$55.26
-11.73%
|
12/23/2013
|
$54.59
|
PP = $52.48
|
|
MB = $55.10
|
Most Recent Note - 1/14/2014 5:19:20 PM
G - Rebounded with a gain on higher volume finishing near its 50 DMA line ($49.43) which may now act as resistance following damaging losses which triggered technical sell signals. Disciplined investors always limit losses by selling any stock that falls more than -7% from their purchase price.
>>> FEATURED STOCK ARTICLE : No Overhead Supply Remains Following Volume-Driven Breakout - 12/23/2013
View all notes |
Set NEW NOTE alert |
CANSLIM.net Company Profile |
SEC
News |
Chart |
Request a new note
C
A N
S L
I M


|
BITA
-
NYSE
Bitauto Hldgs Ltd Ads
INTERNET - Internet Information Providers
|
$36.37
|
+0.54
1.51% |
$37.00
|
742,534
54.48% of 50 DAV
50 DAV is 1,362,900
|
$39.25
-7.34%
|
1/8/2014
|
$33.00
|
PP = $35.14
|
|
MB = $36.90
|
Most Recent Note - 1/13/2014 3:29:55 PM
G - Encountering distributional pressure this afternoon, it reversed into the red after early gains beyond its "max buy" level. Pyramiding is a tactic taught in the Certification designed to let the market action dictate your entries while proper discipline suggests that gains above a stock's pivot point should have at least +40% above average volume to trigger a valid technical buy signal.
>>> FEATURED STOCK ARTICLE : Finished Strong and Challenged Pivot Point After Highlighted in Mid-Day Report - 1/8/2014
View all notes |
Set NEW NOTE alert |
CANSLIM.net Company Profile |
SEC
News |
Chart |
Request a new note
C
A N
S L
I M
|
CELG
-
NASDAQ
Celgene Corp
DRUGS - Drug Manufacturers - Major
|
$167.04
|
-0.56
-0.33% |
$168.40
|
3,353,100
120.50% of 50 DAV
50 DAV is 2,782,600
|
$174.66
-4.36%
|
9/12/2013
|
$149.50
|
PP = $150.02
|
|
MB = $157.52
|
Most Recent Note - 1/13/2014 12:48:57 PM
G - Touched a new 52-week high today followed by a "negative reversal" for a loss on high volume. Its 50 DMA line which acted as support recently. Subsequent violations would raise greater concerns and trigger technical sell signals.
>>> FEATURED STOCK ARTICLE : Found Support Above 50-Day Average After Gapping Down on Prior Session - 1/7/2014
View all notes |
Set NEW NOTE alert |
CANSLIM.net Company Profile |
SEC
News |
Chart |
Request a new note
C
A N
S L
I M
|
EGOV
-
NASDAQ
N I C Inc
INTERNET - Internet Software and Services
|
$23.62
|
-0.52
-2.15% |
$24.26
|
267,361
102.79% of 50 DAV
50 DAV is 260,100
|
$25.99
-9.12%
|
12/20/2013
|
$24.00
|
PP = $26.09
|
|
MB = $27.39
|
Most Recent Note - 1/13/2014 3:32:15 PM
G - Color code is changed to green while sputtering below its 50 DMA line. A rally above recent resistance in the $25-26 area is needed for its technical stance to turn bullish. Meanwhile, a violation of the recent low ($22.17 on 12/16/13) would raise concern as that level defines near-term support above its 200 DMA line.
>>> FEATURED STOCK ARTICLE : Rebounded Above 50-Day Average; Relative Strength Rating Waned - 12/27/2013
View all notes |
Set NEW NOTE alert |
CANSLIM.net Company Profile |
SEC
News |
Chart |
Request a new note
C
A N
S L
I M
|
EQM
-
NYSE
E Q T Midstream Partners
ENERGY - Oil and Gas Pipelines
|
$60.67
|
-0.24
-0.39% |
$61.84
|
49,295
42.64% of 50 DAV
50 DAV is 115,600
|
$62.07
-2.26%
|
12/12/2013
|
$53.17
|
PP = $56.51
|
|
MB = $59.34
|
 Most Recent Note - 1/17/2014 5:28:02 PM
G - Reversed into the red again today for a loss on light volume. It is very extended from any sound base pattern, and prior highs in the $56 area define support to watch on pullbacks. See the latest FSU analysis for more details and new annotated graphs.
>>> FEATURED STOCK ARTICLE : Extended From Base After Six Consecutive Weekly Gains - 1/17/2014
View all notes |
Set NEW NOTE alert |
CANSLIM.net Company Profile |
SEC
News |
Chart |
Request a new note
C
A N
S L
I M
|
Symbol/Exchange
Company Name
Industry Group |
PRICE |
CHANGE
(%Change) |
Day High |
Volume
(% DAV)
(% 50 day avg vol) |
52 Wk Hi
% From Hi |
Featured
Date |
Price
Featured |
Pivot Featured |
|
Max Buy |
FB
-
NASDAQ
Facebook Inc Cl A
INTERNET
|
$56.30
|
-0.89
-1.56% |
$57.82
|
40,841,509
62.10% of 50 DAV
50 DAV is 65,762,900
|
$58.96
-4.51%
|
12/12/2013
|
$51.40
|
PP = $54.93
|
|
MB = $57.68
|
Most Recent Note - 1/15/2014 5:54:56 PM
G - Quietly perched near its "max buy" level with volume totals cooling. Prior highs in the $54 area acted as support during its recent consolidation. Disciplined investors always limit losses by selling any stock that falls more than -7% from their purchase price. See the latest FSU analysis for more details and new annotated graphs.
>>> FEATURED STOCK ARTICLE : Following New Offering Prior Highs Acted As Support - 1/15/2014
View all notes |
Set NEW NOTE alert |
CANSLIM.net Company Profile |
SEC
News |
Chart |
Request a new note
C
A N
S L
I M
|
GNRC
-
NYSE
Generac Hldgs Inc
CONSUMER DURABLES - Electronic Equipment
|
$49.86
|
-1.03
-2.02% |
$50.82
|
2,048,503
324.75% of 50 DAV
50 DAV is 630,800
|
$57.29
-12.97%
|
11/26/2013
|
$53.02
|
PP = $52.42
|
|
MB = $55.04
|
Most Recent Note - 1/17/2014 3:25:24 PM
G - Slumping further below its 50 DMA line and below prior highs in the $52 area with a 2nd consecutive volume-driven loss raising more concerns today. A prompt rebound above its 50 DMA line is needed for its outlook to improve.
>>> FEATURED STOCK ARTICLE : Volume Totals Cooling While Holding Ground Near Highs - 1/2/2014
View all notes |
Set NEW NOTE alert |
CANSLIM.net Company Profile |
SEC
News |
Chart |
Request a new note
C
A N
S L
I M
|
HLF
-
NYSE
Herbalife Ltd
DRUGS - Nutrition and Weight Management
|
$70.20
|
-1.43
-2.00% |
$74.00
|
6,056,802
203.03% of 50 DAV
50 DAV is 2,983,200
|
$83.51
-15.94%
|
11/22/2013
|
$72.21
|
PP = $75.04
|
|
MB = $78.79
|
Most Recent Note - 1/16/2014 12:32:56 PM
G - Gapped down today and undercut prior highs in the $74 area while testing support at its 50 DMA line. Disciplined investors always limit losses if any stock falls more than -7% from their purchase price.
>>> FEATURED STOCK ARTICLE : Volume Totals Cooling While Perched Near Highs - 12/30/2013
View all notes |
Set NEW NOTE alert |
CANSLIM.net Company Profile |
SEC
News |
Chart |
Request a new note
C
A N
S L
I M
|
JAZZ
-
NASDAQ
Jazz Pharmaceuticals Plc
DRUGS - Biotechnology
|
$150.02
|
+1.12
0.75% |
$152.94
|
1,070,798
138.01% of 50 DAV
50 DAV is 775,900
|
$149.49
0.35%
|
9/30/2013
|
$93.20
|
PP = $89.10
|
|
MB = $93.56
|
Most Recent Note - 1/14/2014 5:15:53 PM
G - Perched at its 52-week high, holding its ground stubbornly after considerable volume-driven gains, extended from any sound base. Its 50 DMA line defines important support to watch on pullbacks. See the latest FSU analysis for more details and a new annotated graph.
>>> FEATURED STOCK ARTICLE : Very Extended From Sound Base Following Big Volume-Driven Gains - 1/14/2014
View all notes |
Set NEW NOTE alert |
CANSLIM.net Company Profile |
SEC
News |
Chart |
Request a new note
C
A N
S L
I M
|
KORS
-
NYSE
Michael Kors Hldgs Ltd
RETAIL - Apparel Stores
|
$77.03
|
+1.33
1.76% |
$78.00
|
5,504,615
125.34% of 50 DAV
50 DAV is 4,391,800
|
$84.58
-8.93%
|
8/6/2013
|
$69.66
|
PP = $66.28
|
|
MB = $69.59
|
Most Recent Note - 1/16/2014 1:20:15 PM
G - Gapped down today, slumping further below its 50 DMA line. Damaging losses on higher volume indicate distributional pressure. Reports quarterly financial results on Tuesday, February 4, 2014, before the market opens.
>>> FEATURED STOCK ARTICLE : Technical Deterioration and RS Rating Slump Raises Concerns - 1/9/2014
View all notes |
Set NEW NOTE alert |
CANSLIM.net Company Profile |
SEC
News |
Chart |
Request a new note
C
A N
S L
I M
|
Symbol/Exchange
Company Name
Industry Group |
PRICE |
CHANGE
(%Change) |
Day High |
Volume
(% DAV)
(% 50 day avg vol) |
52 Wk Hi
% From Hi |
Featured
Date |
Price
Featured |
Pivot Featured |
|
Max Buy |
MRLN
-
NASDAQ
Marlin Business Services
DIVERSIFIED SERVICES - Rental and Leasing Services
|
$28.22
|
-1.01
-3.46% |
$29.38
|
35,727
117.91% of 50 DAV
50 DAV is 30,300
|
$29.39
-3.98%
|
12/19/2013
|
$26.69
|
PP = $28.74
|
|
MB = $30.18
|
Most Recent Note - 1/17/2014 5:32:01 PM
Y - Retreated from its 52-week high today with a loss on near average after 2 consecutive volume-driven gains triggered a technical buy signal. No resistance remains due to overhead supply.
>>> FEATURED STOCK ARTICLE : Finished Weak While Enduring Distributional Pressure - 12/19/2013
View all notes |
Set NEW NOTE alert |
CANSLIM.net Company Profile |
SEC
News |
Chart |
Request a new note
C
A N
S L
I M
|
PCLN
-
NASDAQ
Priceline.Com Inc
INTERNET - Internet Software and Services
|
$1,178.04
|
-6.61
-0.56% |
$1,186.86
|
610,036
101.33% of 50 DAV
50 DAV is 602,000
|
$1,198.75
-1.73%
|
12/18/2013
|
$1,156.20
|
PP = $1,198.85
|
|
MB = $1,258.79
|
Most Recent Note - 1/16/2014 12:46:57 PM
Y - Perched within close striking distance of its 52-week high while consolidating above its 50 DMA line which has recently acted as support. A volume-driven gain above its pivot point may trigger a technical buy signal, meanwhile, its 50 DMA line and prior low ($1,113.01 on 1/06/13) define near-term support to watch.
>>> FEATURED STOCK ARTICLE : Managed Positive Reversal at 50-Day Moving Average Line - 1/6/2014
View all notes |
Set NEW NOTE alert |
CANSLIM.net Company Profile |
SEC
News |
Chart |
Request a new note
C
A N
S L
I M
|
RGR
-
NYSE
Sturm Ruger & Co Inc
CONSUMER DURABLES - Sporting Goods
|
$80.34
|
-4.60
-5.42% |
$85.00
|
1,078,186
335.26% of 50 DAV
50 DAV is 321,600
|
$85.93
-6.51%
|
1/8/2014
|
$78.87
|
PP = $80.38
|
|
MB = $84.40
|
Most Recent Note - 1/17/2014 12:56:18 PM
Y - Abruptly retreating from its 52-week high with today's considerable loss on heavy volume following a streak of 9 consecutive gains. Prior note on 1/15/14 reminded members - "Prior highs in the $80 area define initial support to watch on pullbacks. Disciplined investors always limit losses by selling any stock if it falls more than -7% from their purchase price."
>>> FEATURED STOCK ARTICLE : Hit New Highs With 6th Consecutive Gain - 1/13/2014
View all notes |
Set NEW NOTE alert |
CANSLIM.net Company Profile |
SEC
News |
Chart |
Request a new note
C
A N
S L
I M
|
SFUN
-
NYSE
Soufun Hldgs Ltd Ads A
INTERNET - Internet Information Providers
|
$86.45
|
-1.49
-1.69% |
$89.29
|
935,633
78.41% of 50 DAV
50 DAV is 1,193,200
|
$93.49
-7.53%
|
10/17/2013
|
$58.02
|
PP = $53.87
|
|
MB = $56.56
|
Most Recent Note - 1/16/2014 1:23:20 PM
G - Volume totals have been cooling while remaining perched near its all-time high, stubbornly holding its ground. Its 50 DMA line defines important support to watch on pullbacks. Repeatedly noted - "Extended from any sound base."
>>> FEATURED STOCK ARTICLE : Extended From Base Following More Volume-Driven Gains - 1/10/2014
View all notes |
Set NEW NOTE alert |
CANSLIM.net Company Profile |
SEC
News |
Chart |
Request a new note
C
A N
S L
I M
|
SILC
-
NASDAQ
Silicom Ltd
COMPUTER HARDWARE - Networking andamp; Communication Dev
|
$47.23
|
+0.06
0.13% |
$47.30
|
19,831
59.55% of 50 DAV
50 DAV is 33,300
|
$47.70
-0.99%
|
12/23/2013
|
$44.62
|
PP = $46.25
|
|
MB = $48.56
|
Most Recent Note - 1/16/2014 1:29:34 PM
Y - Inching to yet another new 52-week high with today's 10th consecutive small gain, yet it remains below its "max buy" level. Last noted on 1/13/14, its small gain on the session with +122% above average volume confirmed a technical buy signal.
>>> FEATURED STOCK ARTICLE : Stock With Small Supply Has Formed a Sound Base Pattern - 12/24/2013
View all notes |
Set NEW NOTE alert |
CANSLIM.net Company Profile |
SEC
News |
Chart |
Request a new note
C
A N
S L
I M
|
Symbol/Exchange
Company Name
Industry Group |
PRICE |
CHANGE
(%Change) |
Day High |
Volume
(% DAV)
(% 50 day avg vol) |
52 Wk Hi
% From Hi |
Featured
Date |
Price
Featured |
Pivot Featured |
|
Max Buy |
SSNC
-
NASDAQ
S S & C Technologies
COMPUTER SOFTWARE and SERVICES - Application Software
|
$43.22
|
-0.18
-0.41% |
$43.40
|
240,023
89.36% of 50 DAV
50 DAV is 268,600
|
$46.61
-7.27%
|
10/22/2013
|
$39.17
|
PP = $40.04
|
|
MB = $42.04
|
Most Recent Note - 1/16/2014 5:45:31 PM
G - Down with above average volume for a 2nd day in a row and finished near the session low, enduring distributional pressure. See the latest FSU analysis for more details and new annotated graphs.
>>> FEATURED STOCK ARTICLE : Enduring Distributional Pressure While Retreating Near Prior Highs - 1/16/2014
View all notes |
Set NEW NOTE alert |
CANSLIM.net Company Profile |
SEC
News |
Chart |
Request a new note
C
A N
S L
I M
|
ULTI
-
NASDAQ
Ultimate Software Group
INTERNET - Internet Software and Services
|
$157.05
|
+0.87
0.56% |
$157.90
|
147,520
110.17% of 50 DAV
50 DAV is 133,900
|
$162.88
-3.58%
|
10/16/2013
|
$142.95
|
PP = $151.18
|
|
MB = $158.74
|
Most Recent Note - 1/15/2014 5:58:28 PM
G - Consolidating just above its 50 DMA line, enduring distributional pressure with 4 losses on above average volume in the past 5 sessions. Recent low ($144.04 on 12/12/13) defines the next near-term support to watch.
>>> FEATURED STOCK ARTICLE : Gain on Light Volume While Inching Above 50-Day Average - 12/26/2013
View all notes |
Set NEW NOTE alert |
CANSLIM.net Company Profile |
SEC
News |
Chart |
Request a new note
C
A N
S L
I M
|
VRX
-
NYSE
Valeant Pharmaceuticals
DRUGS - Drug Manufacturers - Other
|
$137.93
|
+0.59
0.43% |
$138.57
|
2,320,659
204.84% of 50 DAV
50 DAV is 1,132,900
|
$137.34
0.43%
|
9/11/2013
|
$100.26
|
PP = $105.50
|
|
MB = $110.78
|
Most Recent Note - 1/17/2014 1:04:08 PM
G - Perched at its all-time high, extended from any sound base after volume-driven gains. Its 50 DMA line and prior highs near $115 define near-term support to watch.
>>> FEATURED STOCK ARTICLE : Rebounding With Volume Backed Gains But Fundamental Concerns Remain - 12/18/2013
View all notes |
Set NEW NOTE alert |
CANSLIM.net Company Profile |
SEC
News |
Chart |
Request a new note
C
A N
S L
I M
|
YNDX
-
NASDAQ
Yandex N V Class A
INTERNET - Internet Information Providers
|
$43.02
|
-0.74
-1.69% |
$44.24
|
1,581,467
66.91% of 50 DAV
50 DAV is 2,363,500
|
$45.42
-5.28%
|
11/27/2013
|
$39.61
|
PP = $42.10
|
|
MB = $44.21
|
Most Recent Note - 1/14/2014 5:23:26 PM
Y - Hovering near its 52-week high following a volume-driven gain on 1/09/14 after a Morgan Stanley analysts raised their target price. Prior reports noted - "At least +40% above average volume should be behind gains above the pivot point to trigger a proper new technical buy signal."
>>> FEATURED STOCK ARTICLE : Best Ever Close With Gain on Light Volume - 12/31/2013
View all notes |
Set NEW NOTE alert |
CANSLIM.net Company Profile |
SEC
News |
Chart |
Request a new note
C
A N
S L
I M
|
YY
-
NASDAQ
YY Inc Ads
INTERNET - Internet Service Providers
|
$71.40
|
-0.05
-0.07% |
$72.78
|
1,855,930
122.29% of 50 DAV
50 DAV is 1,517,700
|
$72.47
-1.48%
|
1/3/2014
|
$55.08
|
PP = $56.85
|
|
MB = $59.69
|
Most Recent Note - 1/15/2014 4:43:21 PM
G - Rallied with above average volume for a 2nd consecutive big gain and new high close, getting more extended from any sound base. Prior highs in the $56 area define initial support to watch on pullbacks.
>>> FEATURED STOCK ARTICLE : Finished Strong With High Volume After Featured in Mid-Day Report - 1/3/2014
View all notes |
Set NEW NOTE alert |
CANSLIM.net Company Profile |
SEC
News |
Chart |
Request a new note
C
A N
S L
I M
|
Symbol/Exchange
Company Name
Industry Group |
PRICE |
CHANGE
(%Change) |
Day High |
Volume
(% DAV)
(% 50 day avg vol) |
52 Wk Hi
% From Hi |
Featured
Date |
Price
Featured |
Pivot Featured |
|
Max Buy |
|
|
|
THESE ARE NOT BUY RECOMMENDATIONS!
Comments contained in the body of this report are technical
opinions only. The material herein has been obtained
from sources believed to be reliable and accurate, however,
its accuracy and completeness cannot be guaranteed.
This site is not an investment advisor, hence it does
not endorse or recommend any securities or other investments.
Any recommendation contained in this report may not
be suitable for all investors and it is not to be deemed
an offer or solicitation on our part with respect to
the purchase or sale of any securities. All trademarks,
service marks and trade names appearing in this report
are the property of their respective owners, and are
likewise used for identification purposes only.
This report is a service available
only to active Paid Premium Members.
You may opt-out of receiving report notifications
at any time. Questions or comments may be submitted
by writing to Premium Membership Services 665 S.E. 10 Street, Suite 201 Deerfield Beach, FL 33441-5634 or by calling 1-800-965-8307
or 954-785-1121.
|
|
|

