You are not logged in.
This means you
CAN ONLY VIEW reports that were published prior to Saturday, January 11, 2025.
You
MUST UPGRADE YOUR MEMBERSHIP if you want to see any current reports.
AFTER MARKET UPDATE - TUESDAY, JANUARY 19TH, 2016
Previous After Market Report Next After Market Report >>>
|
|
|
|
DOW |
+27.94 |
16,016.02 |
+0.17% |
|
Volume |
1,170,104,400 |
-19% |
|
Volume |
2,177,290,740 |
-14% |
|
NASDAQ |
-11.47 |
4,476.95 |
-0.26% |
|
Advancers |
1,019 |
33% |
|
Advancers |
1,084 |
35% |
|
S&P 500 |
+1.00 |
1,881.33 |
+0.05% |
|
Decliners |
2,084 |
67% |
|
Decliners |
1,981 |
65% |
|
Russell 2000 |
-12.86 |
994.87 |
-1.28% |
|
52 Wk Highs |
8 |
|
|
52 Wk Highs |
8 |
|
|
S&P 600 |
-7.04 |
601.59 |
-1.16% |
|
52 Wk Lows |
695 |
|
|
52 Wk Lows |
465 |
|
|
 |
Breadth Negative as Indices Erase Early Gains to End Mixed
Kenneth J. Gruneisen - Passed the CAN SLIM® Master's Exam
Stocks fluctuated on Tuesday. The Dow added 28 points to 16016. The S&P 500 was up 1 point to 1881. The NASDAQ declined 11 points at 4476. Volume totals were lighter than the prior session totals on the NYSE and on the Nasdaq exchange. Breadth was negative as decliners led advancers by a 2-1 margin on the NYSE and by nearly 2-1 on the Nasdaq exchange. New leadership remained elusive as there were only 2 high-ranked companies from the Leaders List that made new 52-week highs and were listed on the BreakOuts Page. The Featured Stocks Page has been trimmed considerably as weakness weighed on prior leaders and the broader market. New 52-week lows solidly outnumbered new 52-week highs on the NYSE and on the Nasdaq exchange. Charts used courtesy of www.stockcharts.com
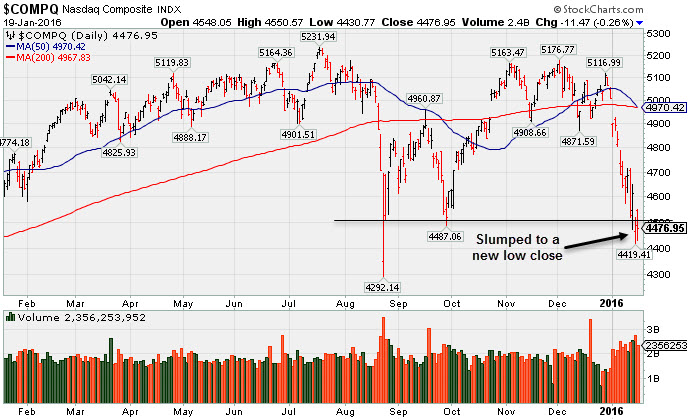 PICTURED: The Nasdaq Composite Index fell on Tuesday and finished further below its lowest closes of August 2015. The tech-heavy index is -14.4% off its record high hit in July 2015. Concerns rose as it and the other major averages again slumped well below their respective 50-day and 200-day moving average (DMA) lines. The fact-based investment system always prompts investors to reduce exposure by selling faltering stocks in weak markets. New leadership (stocks hitting new highs) has become elusive as the major averages (M criteria) resumed their previously noted "correction" and distributional pressure from the institutional crowd brought widespread damage to stocks. This is a good time to keep a watchlist of the strongest stocks, meanwhile, preserving cash and reducing risk until a new confirmed rally is finally noted. The major averages could not hold morning gains after oil prices tumbled lower once again. In economic news, China announced fourth quarter GDP growth of 6.8%, bringing total the 2015 increase to 6.9%. While that represents the slowest advance in 25 years, equities in Europe and Asia spiked on the expectation of more stimulus from Beijing. Domestic data was light although updates on inflation and housing will be released Tuesday morning. In earnings, Morgan Stanley (MS +1.1%) climbed after soundly beating consensus profit estimates. Despite missing EPS projections, Delta Airlines (DAL +3.2%) rose on higher first quarter guidance. Bank of America (BAC -1.5%) fell after falling short of revenue expectations. Yahoo (YHOO +2.1%) rose after Barron’s called for the company to be broken up. Five out of ten sectors in the S&P 500 finished higher on Tuesday. Consumer staples and utilities stocks paced the gains while energy materials shares again underperformed. Treasuries were lower with the benchmark 10-year note off 4/32 to yield 2.05%. In commodities, NYMEX WTI crude descended another 3.7% to $28.34/barrel. COMEX gold lost 0.2% to $1088.30/ounce. In FOREX, the dollar was little changed against its peers. The Featured Stocks Page includes most current notes with headline links for access to more detailed letter-by-letter analysis including price/volume graphs annotated by our experts. See the Premium Member Homepage for archives to all prior pay reports.
|
 Kenneth J. Gruneisen started out as a licensed stockbroker in August 1987, a couple of months prior to the historic stock market crash that took the Dow Jones Industrial Average down -22.6% in a single day. He has published daily fact-based fundamental and technical analysis on high-ranked stocks online for two decades. Through FACTBASEDINVESTING.COM, Kenneth provides educational articles, news, market commentary, and other information regarding proven investment systems that work in good times and bad.
Comments contained in the body of this report are technical opinions only and are not necessarily those of Gruneisen Growth Corp. The material herein has been obtained from sources believed to be reliable and accurate, however, its accuracy and completeness cannot be guaranteed. Our firm, employees, and customers may effect transactions, including transactions contrary to any recommendation herein, or have positions in the securities mentioned herein or options with respect thereto. Any recommendation contained in this report may not be suitable for all investors and it is not to be deemed an offer or solicitation on our part with respect to the purchase or sale of any securities. |
|
 |
Commodity-Linked Groups, Biotechs, and Financials Fell
Kenneth J. Gruneisen - Passed the CAN SLIM® Master's Exam
The Broker/Dealer Index ($XBD -1.13%) and Bank Index ($BKX-0.64%) both suffered losses and had a negative influence on the major averages while the Retail Index ($RLX+0.61%) posted a modest gain on Tuesday. The Semiconductor Index ($SOX +0.15%) eked out a small gain while the Networking Index ($NWX -0.76%) edged lower and the Biotechnology Index ($BTK -2.72%) suffered a large loss. The Oil Services Index ($OSX -3.51%) and the Integrated Oil Index ($XOI -1.97%) were down big again, and the Gold & Silver Index ($XAU -6.22%) was a standout decliner.Charts courtesy www.stockcharts.com
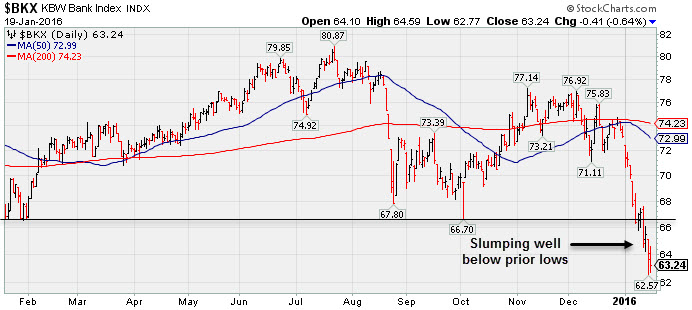
PICTURED: The Bank Index ($BKX-0.64%) has slumped badly as damaging losses undercut prior lows. Longtime readers of this commentary may remember that weak action from financial shares hurts the broader market outlook because the major indices have been prone to there most severe downdrafts when financial stocks are weak. Financials have a history of being reliable "leading indicators".
| Oil Services |
$OSX |
131.54 |
-4.79 |
-3.51% |
-16.60% |
| Integrated Oil |
$XOI |
925.63 |
-18.58 |
-1.97% |
-13.71% |
| Semiconductor |
$SOX |
575.18 |
+0.89 |
+0.15% |
-13.31% |
| Networking |
$NWX |
337.20 |
-2.57 |
-0.76% |
-10.30% |
| Broker/Dealer |
$XBD |
151.28 |
-1.72 |
-1.13% |
-15.05% |
| Retail |
$RLX |
1,160.97 |
+6.99 |
+0.61% |
-9.54% |
| Gold & Silver |
$XAU |
38.84 |
-2.58 |
-6.23% |
-14.26% |
| Bank |
$BKX |
63.24 |
-0.41 |
-0.64% |
-13.46% |
| Biotech |
$BTK |
3,130.31 |
-74.21 |
-2.32% |
-17.92% |
|
|
|
 |
Help Available For You in Making Fact-Based Buy/Sell Decisions With Greater Success
Kenneth J. Gruneisen - Passed the CAN SLIM® Master's Exam
There are few stocks included on the Featured Stocks list now and none of the companies need additional review. At times like these we have an opportunity to look back. In the past we reviewed Ambarella (AMBA) on 9/03/15 and Skyworks (SWKS) on 9/17/15. Previously featured stocks which were dropped can serve as great educational examples of the investment system's tactics. Some are vivid reminders that all high-ranked leaders eventually fall out of favor. If you wish to request for a specific stock to receive more detailed coverage in this section please use the inquiry form to submit your request. Thank you! Professional Money Management Services - A Winning System - Inquire today!
Our skilled portfolio manager knows how to follow the rules of this fact-based investment system. We do not follow opinion or the "conviction list" of some large Wall Street institution which would have us fully invested even during horrific bear markets. Instead, we remain fluid and only buy the best stocks when they are triggering proper technical buy signals. If you are not completely satisfied with the way your portfolio is being managed, Click here and indicate "Find a Broker" to get connected with our portfolio managers. *Accounts over $250,000 please. ** Serious inquires only, please. |
|
|
Color Codes Explained :
Y - Better candidates highlighted by our
staff of experts.
G - Previously featured
in past reports as yellow but may no longer be buyable under the
guidelines.
***Last / Change / Volume data in this table is the closing quote data***
|
|
|
THESE ARE NOT BUY RECOMMENDATIONS!
Comments contained in the body of this report are technical
opinions only. The material herein has been obtained
from sources believed to be reliable and accurate, however,
its accuracy and completeness cannot be guaranteed.
This site is not an investment advisor, hence it does
not endorse or recommend any securities or other investments.
Any recommendation contained in this report may not
be suitable for all investors and it is not to be deemed
an offer or solicitation on our part with respect to
the purchase or sale of any securities. All trademarks,
service marks and trade names appearing in this report
are the property of their respective owners, and are
likewise used for identification purposes only.
This report is a service available
only to active Paid Premium Members.
You may opt-out of receiving report notifications
at any time. Questions or comments may be submitted
by writing to Premium Membership Services 665 S.E. 10 Street, Suite 201 Deerfield Beach, FL 33441-5634 or by calling 1-800-965-8307
or 954-785-1121.
|
|
|

