You are not logged in.
This means you
CAN ONLY VIEW reports that were published prior to Thursday, April 10, 2025.
You
MUST UPGRADE YOUR MEMBERSHIP if you want to see any current reports.
AFTER MARKET UPDATE - FRIDAY, JANUARY 2ND, 2015
Previous After Market Report Next After Market Report >>>
|
|
|
|
DOW |
+9.92 |
17,832.99 |
+0.06% |
|
Volume |
627,595,500 |
-4% |
|
Volume |
1,336,639,260 |
-2% |
|
NASDAQ |
-9.24 |
4,726.81 |
-0.20% |
|
Advancers |
1,710 |
54% |
|
Advancers |
1,203 |
42% |
|
S&P 500 |
-0.70 |
2,058.20 |
-0.03% |
|
Decliners |
1,384 |
44% |
|
Decliners |
1,613 |
56% |
|
Russell 2000 |
-5.90 |
1,198.80 |
-0.49% |
|
52 Wk Highs |
79 |
|
|
52 Wk Highs |
52 |
|
|
S&P 600 |
-4.91 |
690.17 |
-0.71% |
|
52 Wk Lows |
18 |
|
|
52 Wk Lows |
25 |
|
|
 |
Major Averages Fell for the Week
Kenneth J. Gruneisen - Passed the CAN SLIM® Master's Exam
Stocks finished mixed and little changed on the first trading day of the new year. For the week, the Dow lost -1.2%, the S&P slumped -1.5% and the NASDAQ was off -1.7%. Friday's volume totals on the NYSE and on the Nasdaq exchange were lighter and below average. Advancers led decliners by a 6-5 margin on the NYSE while decliners outnumbered advancers by a 4-3 margin on the Nasdaq exchange. Leadership contracted as there were 17 high-ranked companies from the CANSLIM.net Leaders List that made new 52-week highs and appeared on the CANSLIM.net BreakOuts Page, down from the prior session total of 60 stocks. New 52-week highs contracted but still outnumbered new 52-week lows on the NYSE and on the Nasdaq exchange. There were gains for 4 of the 10 high-ranked companies currently on the Featured Stocks Page, a list that has recently been getting trimmed.
Recent new highs for the Dow Jones Industrial Average and S&P 500 Index coupled with healthy leadership signaled that the market (M criteria) is in a confirmed uptrend. New buying efforts should only be made in stocks meeting all fundamental and technical guidelines of the fact-based investment system!
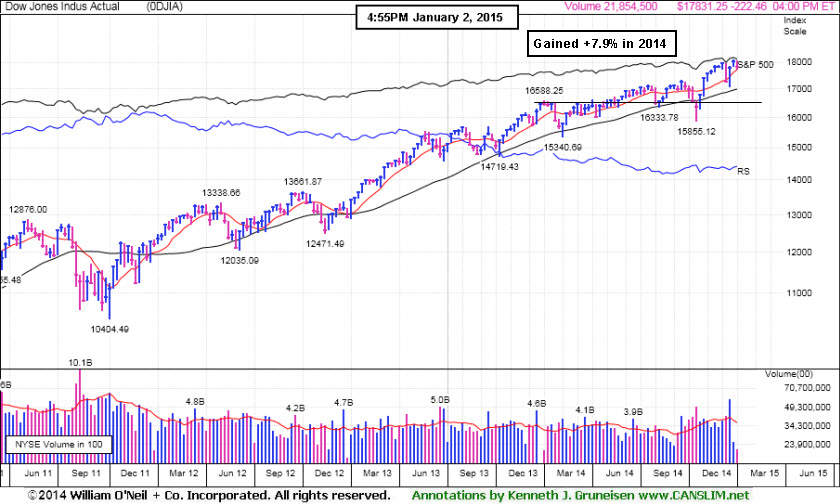
PICTURED: The Dow Jones Industrial Average closed up 9 points to 17,832 but was both up and down more than 90 points during the session. It advanced +7.9% in 2014, finding prompt support and rallying for 7 straight weekly gains after violating its 200-day moving average (DMA) line in October.
Stocks finished mixed on the first day of 2015 trading. The S&P 500 declined less than a point to 2,058. The NASDAQ fell 9 points to 4,726. Disappointing economic data included Markit's manufacturing activity for December which rose less than forecasted, meanwhile a similar gauge from ISM fell below analyst projections. Separately, a measure of construction spending for November contracted -0.3% versus expectations for a +0.4% increase.
At the close, six of the 10 S&P 500 sectors were in positive territory. Utilities were up the most after a two-day rout. Exelon (EXC +1.3%). In telecom, Verizon (VZ +0.4%) rose after announcing new promotional plans. Tech was a relative underperformer as Apple (AAPL -1%) fell on reports of hacking vulnerability. Following the disappointing construction data, Home Depot (HD -1.5%) fell.
In treasuries, the 10-year note gained 16/32 to yield 2.12%, and the 30-year bond advanced more than a full point to yield 2.69%.
Commodities were mixed as WTI crude lost 1.2% to $52.63/barrel, but gold climbed 0.4% to $1,188.70/ounce.
Disciplined investors know that new buying efforts should only be made in stocks when all fundamental and technical guidelines are met. This should be done as the stock is breaking out of a sound base pattern. Historic studies have shown that odds are not as favorable for investors when buying stocks on pullbacks.
The Featured Stocks Page shows recent notes and Headline Links directing members to detailed analysis with data-packed graphs annotated by a Certified expert. See the Premium Member Homepage for archives to all prior pay reports published.
|
 Kenneth J. Gruneisen started out as a licensed stockbroker in August 1987, a couple of months prior to the historic stock market crash that took the Dow Jones Industrial Average down -22.6% in a single day. He has published daily fact-based fundamental and technical analysis on high-ranked stocks online for two decades. Through FACTBASEDINVESTING.COM, Kenneth provides educational articles, news, market commentary, and other information regarding proven investment systems that work in good times and bad.
Comments contained in the body of this report are technical opinions only and are not necessarily those of Gruneisen Growth Corp. The material herein has been obtained from sources believed to be reliable and accurate, however, its accuracy and completeness cannot be guaranteed. Our firm, employees, and customers may effect transactions, including transactions contrary to any recommendation herein, or have positions in the securities mentioned herein or options with respect thereto. Any recommendation contained in this report may not be suitable for all investors and it is not to be deemed an offer or solicitation on our part with respect to the purchase or sale of any securities. |
|
 |
Retail and Financial Groups Edged Lower
Kenneth J. Gruneisen - Passed the CAN SLIM® Master's Exam
The Retail Index ($RLX -0.67%) was a negative influence on the major averages along with weakness in the financials as the Bank Index ($BKX -0.28%) and the Broker/Dealer Index ($XBD -0.27%) both edged lower. Energy-related shares were quiet as the Oil Services Index ($OSX -0.08%) and Integrated Oil Index ($XOI +0.13%) ended Friday's session with little change. The Gold & Silver Index ($XAU +2.52%) was a standout gainer. The Biotechnology Index ($BTK +0.44%) led the tech sector while the Semiconductor Index ($SOX -0.02%) finished flat, but the Networking Index ($NWX -0.12%) edged lower.
Charts courtesy www.stockcharts.com
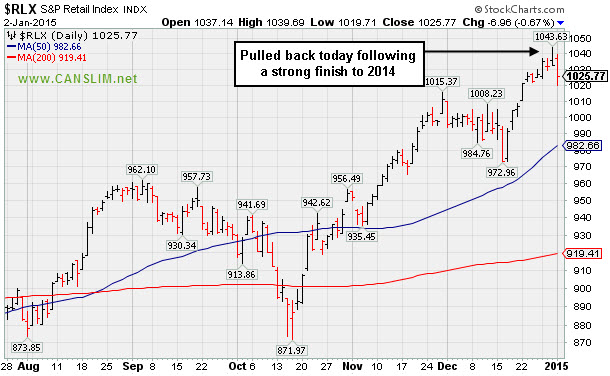
PICTURED: The Retail Index ($RLX -0.67%) pulled back on Friday following a strong finish to 2014.
| Oil Services |
$OSX |
210.70 |
-0.17 |
-0.08% |
-0.08% |
| Integrated Oil |
$XOI |
1,349.84 |
+1.71 |
+0.13% |
+0.13% |
| Semiconductor |
$SOX |
686.73 |
-0.14 |
-0.02% |
-0.02% |
| Networking |
$NWX |
357.52 |
-0.41 |
-0.12% |
-0.12% |
| Broker/Dealer |
$XBD |
184.14 |
-0.50 |
-0.27% |
-0.27% |
| Retail |
$RLX |
1,025.77 |
-6.95 |
-0.67% |
-0.67% |
| Gold & Silver |
$XAU |
70.51 |
+1.73 |
+2.52% |
+2.52% |
| Bank |
$BKX |
74.05 |
-0.21 |
-0.28% |
-0.28% |
| Biotech |
$BTK |
3,454.27 |
+15.16 |
+0.44% |
+0.44% |
|
|
|
 |
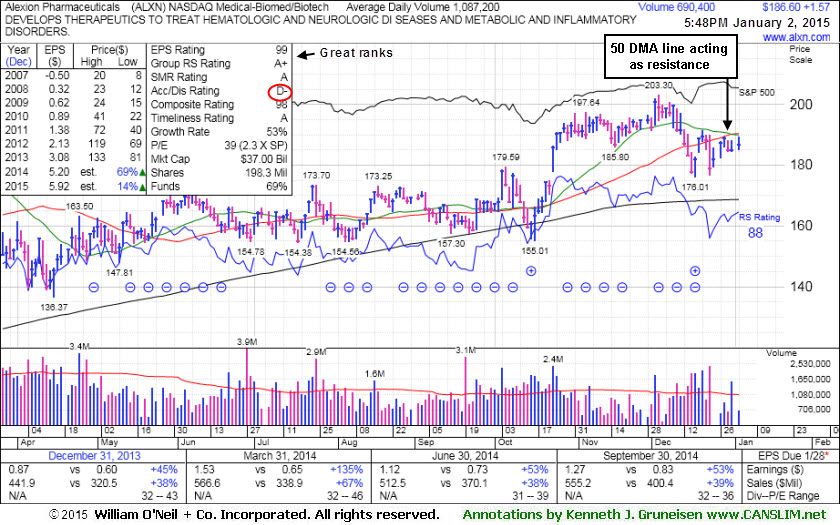
50-Day Moving Average Acted as Resistance After Damaging Losses
Kenneth J. Gruneisen - Passed the CAN SLIM® Master's Exam
Alexion Pharmaceuticals Inc (ALXN +1.57 or +0.85% to $186.60) has been sputtering below its 50-day moving average (DMA) line which recently acted as resistance, plus it faces resistance due to overhead supply up through $203. Its Accumulation/Distribution rating has slumped to a D- (see red circle). The recent low ($176.01 on 12/17/14) defines the next important support level. Disciplined investors limit losses by selling if any stock falls more than -7% from their purchase price.
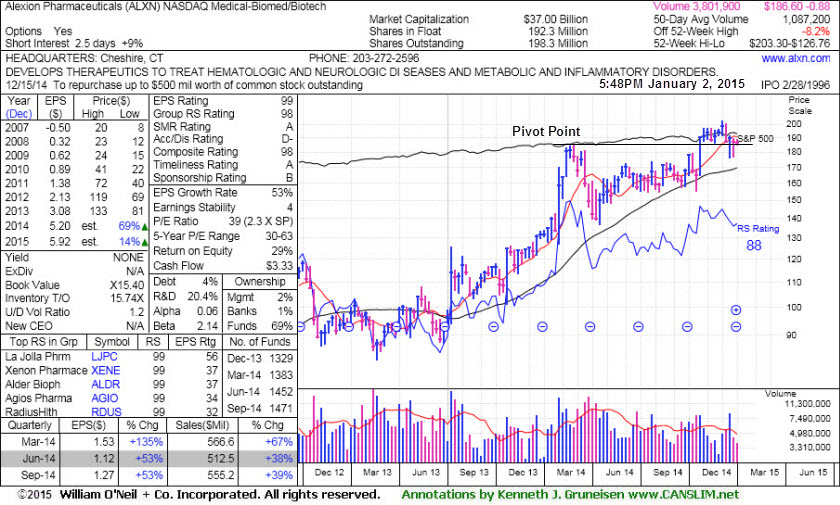
It was last shown in this FSU section on 12/17/14 with annotated graphs under the headline, "Recent 50-Day Moving Average Violation Triggered Sell Signal", following a damaging volume-driven loss. The weekly graph below shows the pivot point based on its 2/25/14 high, at it has been finding support near those old highs which were resistance.
The Medical - Biomed/Biotech industry group has demonstrated leadership and earned a 98 for its Group Relative Strength Rating, a reassuring sign concerning the L criteria. ALXN reported earnings +53% on +39% sales revenues for the Sep '14 quarter, continuing its strong earnings history. Its Relative Strength Rank (88) remains high. It easily satisfies the C and A criteria with a very strong quarterly and annual earnings history which has earned it a highest possible 99 Earnings Per Share rank. The number of top-rated funds owning its shares rose from 1,325 in Dec '13 to 1,471 in Sep '14, a reassuring sign concerning the I criteria of the fact-based investment system. ALXN completed a new Public Offering on 5/25/12.
|
|
|
Color Codes Explained :
Y - Better candidates highlighted by our
staff of experts.
G - Previously featured
in past reports as yellow but may no longer be buyable under the
guidelines.
***Last / Change / Volume data in this table is the closing quote data***
Symbol/Exchange
Company Name
Industry Group |
PRICE |
CHANGE
(%Change) |
Day High |
Volume
(% DAV)
(% 50 day avg vol) |
52 Wk Hi
% From Hi |
Featured
Date |
Price
Featured |
Pivot Featured |
|
Max Buy |
ACT
-
NYSE
Actavis plc
Medical-Generic Drugs
|
$259.13
|
+1.72
0.67% |
$262.27
|
2,179,989
73.25% of 50 DAV
50 DAV is 2,976,000
|
$272.75
-4.99%
|
12/29/2014
|
$260.22
|
PP = $272.85
|
|
MB = $286.49
|
Most Recent Note - 12/29/2014 6:03:30 PM
Y - Color code is changed to yellow with new pivot point cited based on its 11/26/14 high plus 10 cents. Consolidating above support at prior highs and its 50 DMA line. See the latest FSU analysis for more details and new annotated graphs.
>>> FEATURED STOCK ARTICLE : Formed New Base Above Prior Highs and 50-Day Moving Average - 12/29/2014
View all notes |
Set NEW NOTE alert |
CANSLIM.net Company Profile |
SEC
News |
Chart |
Request a new note
C
A N
S L
I M


|
AFSI
-
NASDAQ
Amtrust Financial Svcs
INSURANCE - Property and; Casualty Insurance
|
$55.11
|
-1.14
-2.03% |
$56.73
|
655,896
62.23% of 50 DAV
50 DAV is 1,054,000
|
$59.31
-7.08%
|
10/17/2014
|
$45.24
|
PP = $46.02
|
|
MB = $48.32
|
Most Recent Note - 12/30/2014 6:01:52 PM
G - Found support near prior highs in the $53 area well above its 50 DMA line. More damaging losses would raise greater concerns.
>>> FEATURED STOCK ARTICLE : Finding Support Near Prior Highs - 12/24/2014
View all notes |
Set NEW NOTE alert |
CANSLIM.net Company Profile |
SEC
News |
Chart |
Request a new note
C
A N
S L
I M
|
ALXN
-
NASDAQ
Alexion Pharmaceuticals
DRUGS - Drug Manufacturers - Other
|
$186.60
|
+1.57
0.85% |
$189.41
|
690,514
63.52% of 50 DAV
50 DAV is 1,087,000
|
$203.30
-8.21%
|
10/23/2014
|
$184.01
|
PP = $185.53
|
|
MB = $194.81
|
 Most Recent Note - 1/2/2015 6:12:28 PM
G - Its 50 DMA line recently acted as resistance, plus it faces resistance due to overhead supply up through $203. The recent low ($176.01 on 12/17/14) defines the next important support level. See the latest FSU analysis for more details and new annotated graphs.
>>> FEATURED STOCK ARTICLE : 50-Day Moving Average Acted as Resistance After Damaging Losses - 1/2/2015
View all notes |
Set NEW NOTE alert |
CANSLIM.net Company Profile |
SEC
News |
Chart |
Request a new note
C
A N
S L
I M
|
BIDU
-
NASDAQ
Baidu Inc Ads
INTERNET - Internet Information Providers
|
$223.08
|
-4.89
-2.15% |
$230.45
|
3,484,394
108.08% of 50 DAV
50 DAV is 3,224,000
|
$251.99
-11.47%
|
10/30/2014
|
$234.08
|
PP = $231.51
|
|
MB = $243.09
|
Most Recent Note - 1/2/2015 6:14:27 PM
G - Color code is changed to green while slumping below its 50 DMA line with higher (near average) volume. Recent lows in the $217-218 area define important near-term support where subsequent losses would raise more serious concerns.
>>> FEATURED STOCK ARTICLE : Rebound Above 50-Day Moving Average Helped Technical Stance - 12/19/2014
View all notes |
Set NEW NOTE alert |
CANSLIM.net Company Profile |
SEC
News |
Chart |
Request a new note
C
A N
S L
I M
|
EPAM
-
NYSE
Epam Systems Inc
COMPUTER SOFTWARE and SERVICES - Information Technology Service
|
$46.47
|
-1.28
-2.68% |
$48.16
|
379,328
85.82% of 50 DAV
50 DAV is 442,000
|
$52.89
-12.14%
|
10/23/2014
|
$45.21
|
PP = $46.09
|
|
MB = $48.39
|
Most Recent Note - 1/2/2015 6:17:28 PM
G - Slumped further below its 50 DMA line today raising concerns with higher (near average) volume. Subsequent losses below its recent low close ($46.24 on 12/16/14) would raise concerns and trigger a more worrisome technical sell signal.
>>> FEATURED STOCK ARTICLE : Halted Slide at 50-Day Moving Average - 12/31/2014
View all notes |
Set NEW NOTE alert |
CANSLIM.net Company Profile |
SEC
News |
Chart |
Request a new note
C
A N
S L
I M
|
Symbol/Exchange
Company Name
Industry Group |
PRICE |
CHANGE
(%Change) |
Day High |
Volume
(% DAV)
(% 50 day avg vol) |
52 Wk Hi
% From Hi |
Featured
Date |
Price
Featured |
Pivot Featured |
|
Max Buy |
FB
-
NASDAQ
Facebook Inc Cl A
INTERNET
|
$78.45
|
+0.43
0.55% |
$78.93
|
18,139,172
60.25% of 50 DAV
50 DAV is 30,108,000
|
$82.17
-4.53%
|
12/22/2014
|
$81.79
|
PP = $81.26
|
|
MB = $85.32
|
Most Recent Note - 12/31/2014 6:09:21 PM
Y - Pulled back for a 3rd consecutive loss, retreating from its all-time high. No resistance remains due to overhead supply. Volume-driven gains above the pivot point are needed to clinch a proper new (or add-on) technical buy signal.
>>> FEATURED STOCK ARTICLE : Gains for New Highs Backed By Lighter Volume - 12/22/2014
View all notes |
Set NEW NOTE alert |
CANSLIM.net Company Profile |
SEC
News |
Chart |
Request a new note
C
A N
S L
I M
|
ILMN
-
NASDAQ
Illumina Inc
DRUGS - Biotechnology
|
$185.42
|
+0.84
0.46% |
$189.99
|
1,531,726
138.24% of 50 DAV
50 DAV is 1,108,000
|
$197.37
-6.05%
|
12/30/2014
|
$186.26
|
PP = $196.00
|
|
MB = $205.80
|
Most Recent Note - 1/2/2015 12:28:24 PM
Y - Quietly consolidating near its 50 DMA line forming a "double bottom" base. Subsequent volume-driven gains above the pivot point may trigger a new (or add-on) technical buy signal. Faces some resistance due to overhead supply up through $197. See the latest FSU analysis for more details and annotated graphs.
>>> FEATURED STOCK ARTICLE : Forming New Base And Fundamentals Remain Favorable - 12/30/2014
View all notes |
Set NEW NOTE alert |
CANSLIM.net Company Profile |
SEC
News |
Chart |
Request a new note
C
A N
S L
I M
|
PANW
-
NYSE
Palo Alto Networks
Computer Sftwr-Security
|
$121.42
|
-1.15
-0.94% |
$122.96
|
1,650,443
107.45% of 50 DAV
50 DAV is 1,536,000
|
$128.20
-5.29%
|
7/30/2014
|
$84.21
|
PP = $85.88
|
|
MB = $90.17
|
Most Recent Note - 12/29/2014 12:35:40 PM
G - Pulling back today on slightly higher volume. Prior reports cautioned members - "It has not formed a sound base. The 50 DMA line defines near-term support to watch below recent lows."
>>> FEATURED STOCK ARTICLE : Latest Consolidation Was Not a Base of Sufficient Length - 12/18/2014
View all notes |
Set NEW NOTE alert |
CANSLIM.net Company Profile |
SEC
News |
Chart |
Request a new note
C
A N
S L
I M
|
RH
-
NYSE
Restoration Hardware Hld
RETAIL - Home Furnishing Stores
|
$95.14
|
-0.87
-0.91% |
$97.62
|
961,398
107.78% of 50 DAV
50 DAV is 892,000
|
$100.66
-5.48%
|
12/11/2014
|
$98.66
|
PP = $94.60
|
|
MB = $99.33
|
Most Recent Note - 12/30/2014 6:07:42 PM
Y - Volume totals have been cooling while stubbornly holding its ground near its all-time high. Subsequent losses leading to a close below its old high close ($93.05 on 6/30/14) would completely negate the recent breakout and raise concerns.
>>> FEATURED STOCK ARTICLE : Consolidating Above Prior Highs With Volume Totals Cooling - 12/26/2014
View all notes |
Set NEW NOTE alert |
CANSLIM.net Company Profile |
SEC
News |
Chart |
Request a new note
C
A N
S L
I M
|
UIHC
-
NASDAQ
United Insurance Holding
Insurance-Prop/Cas/Titl
|
$21.17
|
-0.78
-3.55% |
$22.44
|
415,877
189.90% of 50 DAV
50 DAV is 219,000
|
$22.41
-5.53%
|
12/5/2014
|
$20.64
|
PP = $20.31
|
|
MB = $21.33
|
Most Recent Note - 1/2/2015 12:53:36 PM
Y - Touched a new 52-week high today but reversed early gains. Color code is changed to yellow after retreating below its "max buy" level. Prior highs and its 50 DMA line ($19.55) define near-term support to watch.
>>> FEATURED STOCK ARTICLE : Recent Streak of Gains Lacked Volume Conviction - 12/23/2014
View all notes |
Set NEW NOTE alert |
CANSLIM.net Company Profile |
SEC
News |
Chart |
Request a new note
C
A N
S L
I M
|
Symbol/Exchange
Company Name
Industry Group |
PRICE |
CHANGE
(%Change) |
Day High |
Volume
(% DAV)
(% 50 day avg vol) |
52 Wk Hi
% From Hi |
Featured
Date |
Price
Featured |
Pivot Featured |
|
Max Buy |
|
|
|
THESE ARE NOT BUY RECOMMENDATIONS!
Comments contained in the body of this report are technical
opinions only. The material herein has been obtained
from sources believed to be reliable and accurate, however,
its accuracy and completeness cannot be guaranteed.
This site is not an investment advisor, hence it does
not endorse or recommend any securities or other investments.
Any recommendation contained in this report may not
be suitable for all investors and it is not to be deemed
an offer or solicitation on our part with respect to
the purchase or sale of any securities. All trademarks,
service marks and trade names appearing in this report
are the property of their respective owners, and are
likewise used for identification purposes only.
This report is a service available
only to active Paid Premium Members.
You may opt-out of receiving report notifications
at any time. Questions or comments may be submitted
by writing to Premium Membership Services 665 S.E. 10 Street, Suite 201 Deerfield Beach, FL 33441-5634 or by calling 1-800-965-8307
or 954-785-1121.
|
|
|

