You are not logged in.
This means you
CAN ONLY VIEW reports that were published prior to Wednesday, April 9, 2025.
You
MUST UPGRADE YOUR MEMBERSHIP if you want to see any current reports.
AFTER MARKET UPDATE - WEDNESDAY, DECEMBER 31ST, 2014
Previous After Market Report Next After Market Report >>>
|
|
|
|
DOW |
-160.00 |
17,823.07 |
-0.89% |
|
Volume |
655,715,780 |
+25% |
|
Volume |
1,360,386,210 |
+16% |
|
NASDAQ |
-41.39 |
4,736.05 |
-0.87% |
|
Advancers |
1,113 |
35% |
|
Advancers |
1,220 |
41% |
|
S&P 500 |
-21.45 |
2,058.90 |
-1.03% |
|
Decliners |
2,019 |
63% |
|
Decliners |
1,654 |
56% |
|
Russell 2000 |
-8.36 |
1,204.70 |
-0.69% |
|
52 Wk Highs |
187 |
|
|
52 Wk Highs |
121 |
|
|
S&P 600 |
-5.00 |
695.08 |
-0.71% |
|
52 Wk Lows |
32 |
|
|
52 Wk Lows |
44 |
|
|
 |
Major Averages Ended Profitable 2014 With a Pullback
Kenneth J. Gruneisen - Passed the CAN SLIM® Master's Exam
Stocks finished the final trading day of the year lower. The Dow lost 160 points to 17,823. The S&P 500 declined 21 points to 2,058. The NASDAQ finished off 41 points to 4,736. For the year, the Dow Jones Industrial Average advanced +7.9%, the S&P 500 Index climbed +11.7% and the Nasdaq Composite Index gained +13.7%. Wednesday's volume totals on the NYSE and on the Nasdaq exchange were higher but still below average. Breadth was negative as decliners led advancers by a 2-1 margin on the NYSE and 4-3 on the Nasdaq exchange. There were 60 high-ranked companies from the CANSLIM.net Leaders List that made new 52-week highs and appeared on the CANSLIM.net BreakOuts Page, up from the prior session total of 51 stocks. New 52-week highs contracted but still outnumbered new 52-week lows on the NYSE and on the Nasdaq exchange. There were gains for 4 of the 10 high-ranked companies currently on the Featured Stocks Page, a list that has recently been getting trimmed.
Recent new highs for the Dow Jones Industrial Average and S&P 500 Index coupled with healthy leadership signaled that the market (M criteria) is in a confirmed uptrend. New buying efforts should only be made in stocks meeting all fundamental and technical guidelines of the fact-based investment system!
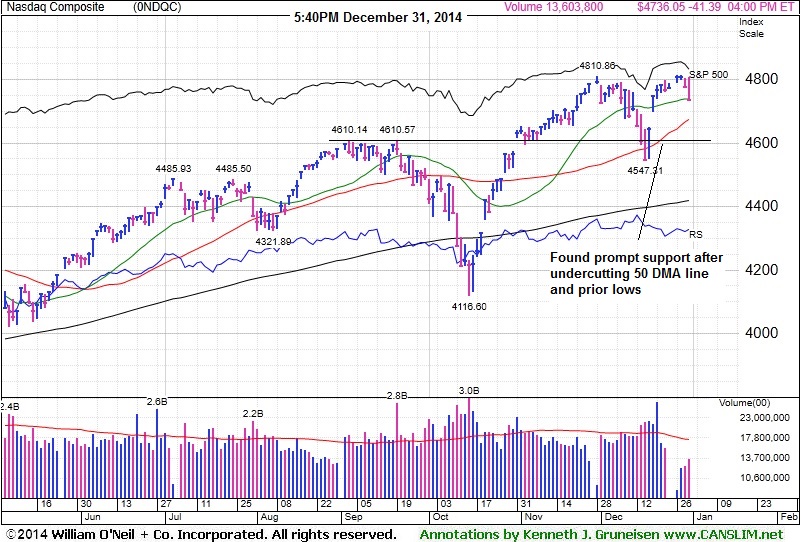
PICTURED: The Dow Jones Industrial Average recently found prompt support after briefly undercutting its 50-day moving average (DMA) line and prior lows.
The major averages fell as a round of profit taking ensued on the last day of trading. Investor attention was also focused on economic data. The number of jobless claims last week unexpectedly rose to 298,000, but remained below the important 300,000 level. Meanwhile, a gauge of December's manufacturing activity in the Chicago region fell more than projected, but a measure of new home sales for November topped analyst estimates.
At the close, all 10 sectors of the S&P 500 were in negative territory. Utilities extended recent losses as Dominion Resources (D -1.8%). In telecom, shares of AT&T (T -1.4%) after speculation of increased competition set in. Home improvement retailers helped limit losses in the consumer discretionary sector. Home Depot (HD +0.7%) and Lowe's (LOW +0.4%) edged higher.
Treasuries were little changed in a shortened trading day. The 10-year note climbed 5/32 to yield 2.17%.
In commodities, WTI crude finished off of earlier lows but still lost -0.6% to $53.82/barrel.
Disciplined investors know that new buying efforts should only be made in stocks when all fundamental and technical guidelines are met. This should be done as the stock is breaking out of a sound base pattern. Historic studies have shown that odds are not as favorable for investors when buying stocks on pullbacks.
The Featured Stocks Page shows recent notes and Headline Links directing members to detailed analysis with data-packed graphs annotated by a Certified expert. See the Premium Member Homepage for archives to all prior pay reports published.
|
 Kenneth J. Gruneisen started out as a licensed stockbroker in August 1987, a couple of months prior to the historic stock market crash that took the Dow Jones Industrial Average down -22.6% in a single day. He has published daily fact-based fundamental and technical analysis on high-ranked stocks online for two decades. Through FACTBASEDINVESTING.COM, Kenneth provides educational articles, news, market commentary, and other information regarding proven investment systems that work in good times and bad.
Comments contained in the body of this report are technical opinions only and are not necessarily those of Gruneisen Growth Corp. The material herein has been obtained from sources believed to be reliable and accurate, however, its accuracy and completeness cannot be guaranteed. Our firm, employees, and customers may effect transactions, including transactions contrary to any recommendation herein, or have positions in the securities mentioned herein or options with respect thereto. Any recommendation contained in this report may not be suitable for all investors and it is not to be deemed an offer or solicitation on our part with respect to the purchase or sale of any securities. |
|
 |
Financial, Tech, and Commodity-Linked Groups Fell
Kenneth J. Gruneisen - Passed the CAN SLIM® Master's Exam
The Retail Index ($RLX +0.07%) eked out a tiny gain while most groups ended lower on Wednesday. The Bank Index ($BKX -1.14%) and the Broker/Dealer Index ($XBD -0.59%) both lost ground and weighed on the major averages. The Networking Index ($NWX -1.10%), Semiconductor Index ($SOX -0.60%), and the Biotechnology Index ($BTK -0.38%) finished unanimously lower. Commodity-linked groups also had a negative bias as the Oil Services Index ($OSX -0.60%), Integrated Oil Index ($XOI -0.57%), and the Gold & Silver Index ($XAU -0.41%) lost ground.
Charts courtesy www.stockcharts.com
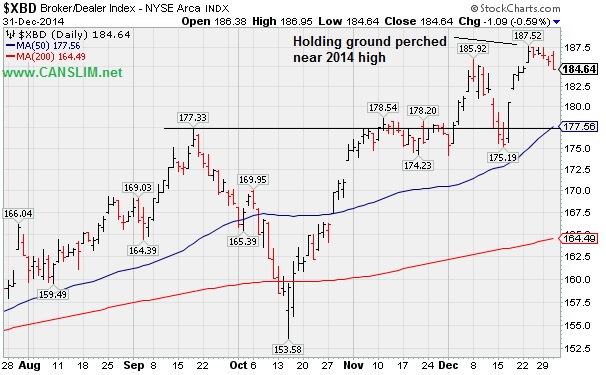
PICTURED: The Broker/Dealer Index ($XBD -0.59%) pulled back for a 3rd consecutive small loss, still holding its ground near its 2014 highs.
| Oil Services |
$OSX |
210.87 |
-1.27 |
-0.60% |
-24.97% |
| Integrated Oil |
$XOI |
1,348.13 |
-7.72 |
-0.57% |
-10.31% |
| Semiconductor |
$SOX |
686.87 |
-4.12 |
-0.60% |
+28.38% |
| Networking |
$NWX |
357.94 |
-3.97 |
-1.10% |
+10.49% |
| Broker/Dealer |
$XBD |
184.64 |
-1.09 |
-0.59% |
+15.00% |
| Retail |
$RLX |
1,032.73 |
+0.75 |
+0.07% |
+9.89% |
| Gold & Silver |
$XAU |
68.78 |
-0.28 |
-0.41% |
-18.27% |
| Bank |
$BKX |
74.26 |
-0.86 |
-1.14% |
+7.22% |
| Biotech |
$BTK |
3,439.11 |
-13.22 |
-0.38% |
+47.57% |
|
|
|
 |
Halted Slide at 50-Day Moving Average
Kenneth J. Gruneisen - Passed the CAN SLIM® Master's Exam
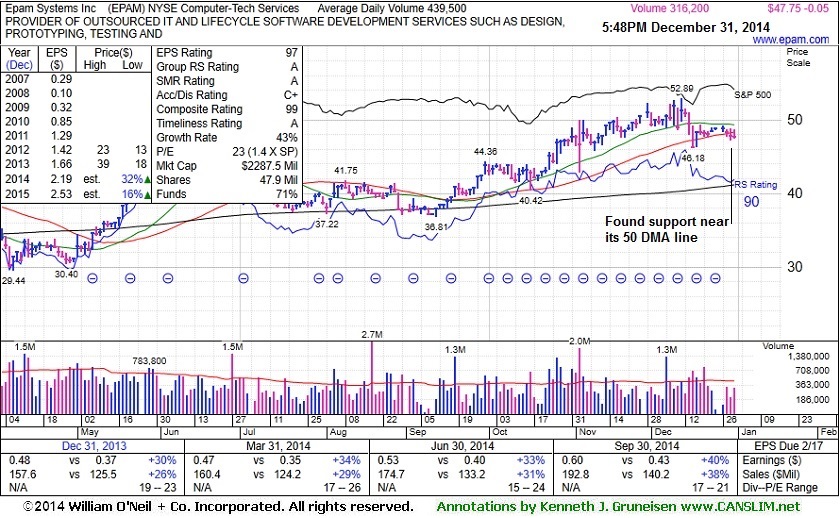
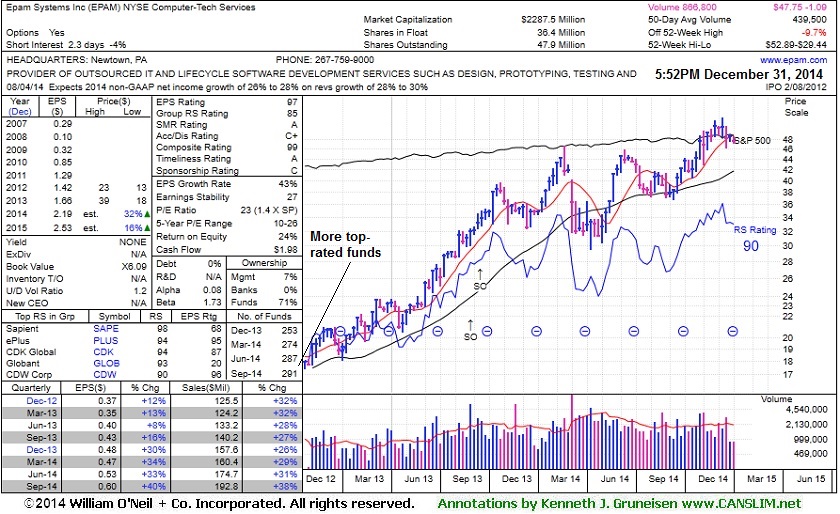
Epam Systems Inc (EPAM -$0.05 or -0.10% to $47.75) has been consolidating near its 50-day moving average (DMA) line, an important support level. Prior highs in the $46 area acted as support, and subsequent losses below recent lows would raise concerns and trigger a more worrisome technical sell signal. It halted its slide, but showed more signs of distributional pressure while gains lacked volume conviction after last shown in this FSU section on 12/16/14 with annotated graphs under the headline, "Violated 50-Day Moving Average Triggering Technical Sell Signal".
The high-ranked Computer - Tech Services firm reported earnings +40% on +38% sales revenues for the Sep '14 quarter and also gave upbeat sales guidance. It had previously reported earnings +33% on +31% sales revenues for the Jun '14 quarter. Its 4 consecutive quarters with earnings above the +25% guideline makes it a solid match concerning the C criteria. Annual earnings growth (A criteria) has been strong.
It completed Secondary Offerings 8/30/13 and 9/17/13. Its current Up/Down Volume Ratio of 1.2 is an unbiased indication its shares have been under accumulation in the past 50 days. The number of top-rated funds owning its shares rose from 254 in Dec '13 to 291 in Sep '14, a reassuring sign concerning the I criteria. Its small supply of only 36.4 million shares (S criteria) can contribute to greater volatility in the event of institutional buying or selling.
|
|
|
Color Codes Explained :
Y - Better candidates highlighted by our
staff of experts.
G - Previously featured
in past reports as yellow but may no longer be buyable under the
guidelines.
***Last / Change / Volume data in this table is the closing quote data***
Symbol/Exchange
Company Name
Industry Group |
PRICE |
CHANGE
(%Change) |
Day High |
Volume
(% DAV)
(% 50 day avg vol) |
52 Wk Hi
% From Hi |
Featured
Date |
Price
Featured |
Pivot Featured |
|
Max Buy |
ACT
-
NYSE
Actavis plc
Medical-Generic Drugs
|
$257.41
|
-2.16
-0.83% |
$261.88
|
1,396,254
46.82% of 50 DAV
50 DAV is 2,982,000
|
$272.75
-5.62%
|
12/29/2014
|
$260.22
|
PP = $272.85
|
|
MB = $286.49
|
Most Recent Note - 12/29/2014 6:03:30 PM
Y - Color code is changed to yellow with new pivot point cited based on its 11/26/14 high plus 10 cents. Consolidating above support at prior highs and its 50 DMA line. See the latest FSU analysis for more details and new annotated graphs.
>>> FEATURED STOCK ARTICLE : Formed New Base Above Prior Highs and 50-Day Moving Average - 12/29/2014
View all notes |
Set NEW NOTE alert |
CANSLIM.net Company Profile |
SEC
News |
Chart |
Request a new note
C
A N
S L
I M


|
AFSI
-
NASDAQ
Amtrust Financial Svcs
INSURANCE - Property and; Casualty Insurance
|
$56.25
|
+1.27
2.31% |
$56.48
|
606,154
57.08% of 50 DAV
50 DAV is 1,062,000
|
$59.31
-5.16%
|
10/17/2014
|
$45.24
|
PP = $46.02
|
|
MB = $48.32
|
Most Recent Note - 12/30/2014 6:01:52 PM
G - Found support near prior highs in the $53 area well above its 50 DMA line. More damaging losses would raise greater concerns.
>>> FEATURED STOCK ARTICLE : Finding Support Near Prior Highs - 12/24/2014
View all notes |
Set NEW NOTE alert |
CANSLIM.net Company Profile |
SEC
News |
Chart |
Request a new note
C
A N
S L
I M
|
ALXN
-
NASDAQ
Alexion Pharmaceuticals
DRUGS - Drug Manufacturers - Other
|
$185.03
|
+0.09
0.05% |
$188.12
|
1,569,849
145.49% of 50 DAV
50 DAV is 1,079,000
|
$203.30
-8.99%
|
10/23/2014
|
$184.01
|
PP = $185.53
|
|
MB = $194.81
|
Most Recent Note - 12/30/2014 6:03:33 PM
G - Its 50 DMA line recently acted as resistance, plus it faces resistance due to overhead supply up through $203. The recent low ($176.01 on 12/17/14) defines the next important support level. Disciplined investors limit losses by selling if any stock falls more than -7% from their purchase price.
>>> FEATURED STOCK ARTICLE : Recent 50-Day Moving Average Violation Triggered Sell Signal - 12/17/2014
View all notes |
Set NEW NOTE alert |
CANSLIM.net Company Profile |
SEC
News |
Chart |
Request a new note
C
A N
S L
I M
|
BIDU
-
NASDAQ
Baidu Inc Ads
INTERNET - Internet Information Providers
|
$227.97
|
-2.04
-0.89% |
$231.00
|
1,933,770
59.76% of 50 DAV
50 DAV is 3,236,000
|
$251.99
-9.53%
|
10/30/2014
|
$234.08
|
PP = $231.51
|
|
MB = $243.09
|
Most Recent Note - 12/30/2014 6:05:42 PM
Y - Quietly consolidating near its 50 DMA line. Recent lows in the $217-218 area define important near-term support where subsequent losses would raise more serious concerns.
>>> FEATURED STOCK ARTICLE : Rebound Above 50-Day Moving Average Helped Technical Stance - 12/19/2014
View all notes |
Set NEW NOTE alert |
CANSLIM.net Company Profile |
SEC
News |
Chart |
Request a new note
C
A N
S L
I M
|
EPAM
-
NYSE
Epam Systems Inc
COMPUTER SOFTWARE and SERVICES - Information Technology Service
|
$47.75
|
-0.05
-0.10% |
$48.69
|
316,239
72.04% of 50 DAV
50 DAV is 439,000
|
$52.89
-9.72%
|
10/23/2014
|
$45.21
|
PP = $46.09
|
|
MB = $48.39
|
 Most Recent Note - 12/31/2014 6:06:40 PM
G - Consolidating at its 50 DMA line. Subsequent losses below recent lows would raise concerns and trigger a more worrisome technical sell signal. See the latest FSU analysis for more details and new annotated graphs.
>>> FEATURED STOCK ARTICLE : Halted Slide at 50-Day Moving Average - 12/31/2014
View all notes |
Set NEW NOTE alert |
CANSLIM.net Company Profile |
SEC
News |
Chart |
Request a new note
C
A N
S L
I M
|
Symbol/Exchange
Company Name
Industry Group |
PRICE |
CHANGE
(%Change) |
Day High |
Volume
(% DAV)
(% 50 day avg vol) |
52 Wk Hi
% From Hi |
Featured
Date |
Price
Featured |
Pivot Featured |
|
Max Buy |
FB
-
NASDAQ
Facebook Inc Cl A
INTERNET
|
$78.02
|
-1.20
-1.51% |
$79.80
|
20,018,479
65.85% of 50 DAV
50 DAV is 30,402,000
|
$82.17
-5.05%
|
12/22/2014
|
$81.79
|
PP = $81.26
|
|
MB = $85.32
|
Most Recent Note - 12/31/2014 6:09:21 PM
Y - Pulled back for a 3rd consecutive loss, retreating from its all-time high. No resistance remains due to overhead supply. Volume-driven gains above the pivot point are needed to clinch a proper new (or add-on) technical buy signal.
>>> FEATURED STOCK ARTICLE : Gains for New Highs Backed By Lighter Volume - 12/22/2014
View all notes |
Set NEW NOTE alert |
CANSLIM.net Company Profile |
SEC
News |
Chart |
Request a new note
C
A N
S L
I M
|
ILMN
-
NASDAQ
Illumina Inc
DRUGS - Biotechnology
|
$184.58
|
-1.71
-0.92% |
$189.65
|
509,866
44.88% of 50 DAV
50 DAV is 1,136,000
|
$197.37
-6.48%
|
12/30/2014
|
$186.26
|
PP = $196.00
|
|
MB = $205.80
|
Most Recent Note - 12/30/2014 5:57:16 PM
Y - Color code is changed to yellow while consolidating near its 50 DMA line forming a "double bottom" base. Subsequent volume-driven gains above the pivot point may trigger a technical buy signal. Faces some resistance due to overhead supply up through $197. See the latest FSU analysis for more details and new annotated graphs.
>>> FEATURED STOCK ARTICLE : Forming New Base And Fundamentals Remain Favorable - 12/30/2014
View all notes |
Set NEW NOTE alert |
CANSLIM.net Company Profile |
SEC
News |
Chart |
Request a new note
C
A N
S L
I M
|
PANW
-
NYSE
Palo Alto Networks
Computer Sftwr-Security
|
$122.57
|
+0.77
0.63% |
$124.53
|
717,607
45.88% of 50 DAV
50 DAV is 1,564,000
|
$128.20
-4.39%
|
7/30/2014
|
$84.21
|
PP = $85.88
|
|
MB = $90.17
|
Most Recent Note - 12/29/2014 12:35:40 PM
G - Pulling back today on slightly higher volume. Prior reports cautioned members - "It has not formed a sound base. The 50 DMA line defines near-term support to watch below recent lows."
>>> FEATURED STOCK ARTICLE : Latest Consolidation Was Not a Base of Sufficient Length - 12/18/2014
View all notes |
Set NEW NOTE alert |
CANSLIM.net Company Profile |
SEC
News |
Chart |
Request a new note
C
A N
S L
I M
|
RH
-
NYSE
Restoration Hardware Hld
RETAIL - Home Furnishing Stores
|
$96.01
|
-0.75
-0.78% |
$97.07
|
626,821
69.57% of 50 DAV
50 DAV is 901,000
|
$100.66
-4.62%
|
12/11/2014
|
$98.66
|
PP = $94.60
|
|
MB = $99.33
|
Most Recent Note - 12/30/2014 6:07:42 PM
Y - Volume totals have been cooling while stubbornly holding its ground near its all-time high. Subsequent losses leading to a close below its old high close ($93.05 on 6/30/14) would completely negate the recent breakout and raise concerns.
>>> FEATURED STOCK ARTICLE : Consolidating Above Prior Highs With Volume Totals Cooling - 12/26/2014
View all notes |
Set NEW NOTE alert |
CANSLIM.net Company Profile |
SEC
News |
Chart |
Request a new note
C
A N
S L
I M
|
UIHC
-
NASDAQ
United Insurance Holding
Insurance-Prop/Cas/Titl
|
$21.95
|
+0.66
3.10% |
$22.38
|
290,105
130.68% of 50 DAV
50 DAV is 222,000
|
$22.41
-2.05%
|
12/5/2014
|
$20.64
|
PP = $20.31
|
|
MB = $21.33
|
Most Recent Note - 12/31/2014 6:10:45 PM
G - Challenged its 52-week high with today's volume-driven gain. Prior highs and its 50 DMA line define near-term support in the $20 area.
>>> FEATURED STOCK ARTICLE : Recent Streak of Gains Lacked Volume Conviction - 12/23/2014
View all notes |
Set NEW NOTE alert |
CANSLIM.net Company Profile |
SEC
News |
Chart |
Request a new note
C
A N
S L
I M
|
Symbol/Exchange
Company Name
Industry Group |
PRICE |
CHANGE
(%Change) |
Day High |
Volume
(% DAV)
(% 50 day avg vol) |
52 Wk Hi
% From Hi |
Featured
Date |
Price
Featured |
Pivot Featured |
|
Max Buy |
|
|
|
THESE ARE NOT BUY RECOMMENDATIONS!
Comments contained in the body of this report are technical
opinions only. The material herein has been obtained
from sources believed to be reliable and accurate, however,
its accuracy and completeness cannot be guaranteed.
This site is not an investment advisor, hence it does
not endorse or recommend any securities or other investments.
Any recommendation contained in this report may not
be suitable for all investors and it is not to be deemed
an offer or solicitation on our part with respect to
the purchase or sale of any securities. All trademarks,
service marks and trade names appearing in this report
are the property of their respective owners, and are
likewise used for identification purposes only.
This report is a service available
only to active Paid Premium Members.
You may opt-out of receiving report notifications
at any time. Questions or comments may be submitted
by writing to Premium Membership Services 665 S.E. 10 Street, Suite 201 Deerfield Beach, FL 33441-5634 or by calling 1-800-965-8307
or 954-785-1121.
|
|
|

