You are not logged in.
This means you
CAN ONLY VIEW reports that were published prior to Thursday, April 10, 2025.
You
MUST UPGRADE YOUR MEMBERSHIP if you want to see any current reports.
AFTER MARKET UPDATE - MONDAY, JANUARY 5TH, 2015
Previous After Market Report Next After Market Report >>>
|
|
|
|
DOW |
-331.34 |
17,501.65 |
-1.86% |
|
Volume |
822,600,590 |
+31% |
|
Volume |
1,659,161,430 |
+24% |
|
NASDAQ |
-74.24 |
4,652.57 |
-1.57% |
|
Advancers |
724 |
22% |
|
Advancers |
804 |
27% |
|
S&P 500 |
-37.62 |
2,020.58 |
-1.83% |
|
Decliners |
2,435 |
76% |
|
Decliners |
2,125 |
71% |
|
Russell 2000 |
-17.45 |
1,181.35 |
-1.46% |
|
52 Wk Highs |
90 |
|
|
52 Wk Highs |
46 |
|
|
S&P 600 |
-10.90 |
679.27 |
-1.58% |
|
52 Wk Lows |
85 |
|
|
52 Wk Lows |
47 |
|
|
Damaging losses prompted a shift for the market (M criteria) outlook which is noted in today's commentary. Investors should have a bias toward reducing market exposure and be prepared to wait until strength returns before new buying efforts can again be considered under the fact-based investment system.
|
 |
Major Averages Fell Under Heavier Distributional Pressure
Kenneth J. Gruneisen - Passed the CAN SLIM® Master's Exam
Stocks experienced a selloff on Monday with each of the major averages losing at least -1.6%. The Dow fell 331 points to 17,501. The S&P 500 declined 37 points to 2,020. The NASDAQ Composite lost 74 points to 4,652. The volume totals on the NYSE and on the Nasdaq exchange were higher than the prior session, a clear sign of distributional pressure. Decliners led advancers by more than a 3-1 margin on the NYSE and nearly a 3-1 margin on the Nasdaq exchange. Leadership contracted even more as there were only 13 high-ranked companies from the CANSLIM.net Leaders List that made new 52-week highs and appeared on the CANSLIM.net BreakOuts Page, down from the prior session total of 17 stocks. New 52-week highs outnumbered new 52-week lows on the NYSE while the mix was even on the Nasdaq exchange. There were gains for 4 of the 12 high-ranked companies currently on the Featured Stocks Page, a list that has recently been getting trimmed.
The Dow Jones Industrial Average, S&P 500 Index, and Nasdaq Composite Index collectively violated their respective 50-day moving average (DMA) lines on Monday coupled with waning leadership. The change in behavior earned the market (M criteria) the label of a "correction" again. New buying efforts should not be made in stocks, even if meeting all fundamental and technical guidelines of the fact-based investment system, until the broader market shows renewed strength.

PICTURED: The S&P 500 Index violated its 50-day moving average (DMA) line with a big loss on Monday. Prior lows and its 200 DMA line define the next near-term support to watch.
A further drop in oil prices weighed on the market as WTI crude fell -5.4% to a fresh five-year low of $49.87. As a result, energy was the worst performing sector in the S&P 500. Exxon (XOM -2.4%), ConocoPhillips (COP -4.6%) and shares of EOG Resources (EOG -5.8%) fell.
Materials and industrials were also under pressure as DuPont (DD -2.5%) and General Electric (GE -1.9%) fell. Index-heavyweight Apple (AAPL -2.8%) contributed the most to the S&P 500's drop.. Gilead Sciences (GILD +2.3%) rallied after the company agreed to make its hepatitis C drugs the exclusive treatments for CVS Health customers.
The latest economic data was on the back burner. Automakers posted the best annual sales since 1996 and an ISM survey revealed business conditions in the New York area improved to a four-year high in December.
Treasuries staged a rally. The 10-year note gained 21/32 to yield 2.04%. The 30-year bond jumped nearly two full points to yield 2.61%, its lowest level since August 2012.
Disciplined investors know that new buying efforts should only be made in stocks when all fundamental and technical guidelines are met. This should be done as the stock is breaking out of a sound base pattern. Historic studies have shown that odds are not as favorable for investors when buying stocks on pullbacks.
The Featured Stocks Page shows recent notes and Headline Links directing members to detailed analysis with data-packed graphs annotated by a Certified expert. See the Premium Member Homepage for archives to all prior pay reports published.
|
 Kenneth J. Gruneisen started out as a licensed stockbroker in August 1987, a couple of months prior to the historic stock market crash that took the Dow Jones Industrial Average down -22.6% in a single day. He has published daily fact-based fundamental and technical analysis on high-ranked stocks online for two decades. Through FACTBASEDINVESTING.COM, Kenneth provides educational articles, news, market commentary, and other information regarding proven investment systems that work in good times and bad.
Comments contained in the body of this report are technical opinions only and are not necessarily those of Gruneisen Growth Corp. The material herein has been obtained from sources believed to be reliable and accurate, however, its accuracy and completeness cannot be guaranteed. Our firm, employees, and customers may effect transactions, including transactions contrary to any recommendation herein, or have positions in the securities mentioned herein or options with respect thereto. Any recommendation contained in this report may not be suitable for all investors and it is not to be deemed an offer or solicitation on our part with respect to the purchase or sale of any securities. |
|
 |
Energy-Linked Groups Led Retail, Financials, and Techs Lower
Kenneth J. Gruneisen - Passed the CAN SLIM® Master's Exam
The Integrated Oil Index ($XOI -4.61%) and Oil Services Index ($OSX -3.88%) were standout decliners on Monday's mostly negative session while the Gold & Silver Index ($XAU +1.83%) was a standout gainer. A pullback for the Retail Index ($RLX -1.88%) and weakness in financials pressured the major averages as the Bank Index ($BKX -2.94%) and the Broker/Dealer Index ($XBD -1.98%) both fell. The Semiconductor Index ($SOX -1.91%) and the Networking Index ($NWX -1.56%) both dragged the tech sector down, meanwhile the Biotechnology Index ($BTK +0.30%) fought for a small gain.
Charts courtesy www.stockcharts.com
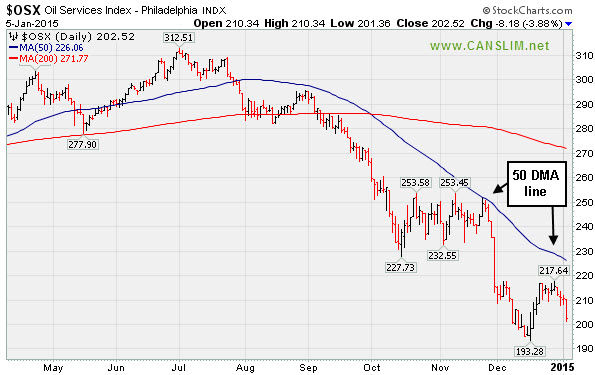
PICTURED: The Oil Services Index ($OSX -3.88%) slumped toward recent lows with a large loss. It did not even manage to challenge its 50-day moving average (DMA) line on the latest rally effort, and that short-term average acted as resistance in late November.
| Oil Services |
$OSX |
202.52 |
-8.18 |
-3.88% |
-3.96% |
| Integrated Oil |
$XOI |
1,287.66 |
-62.18 |
-4.61% |
-4.49% |
| Semiconductor |
$SOX |
673.59 |
-13.14 |
-1.91% |
-1.93% |
| Networking |
$NWX |
351.96 |
-5.56 |
-1.56% |
-1.67% |
| Broker/Dealer |
$XBD |
180.49 |
-3.65 |
-1.98% |
-2.25% |
| Retail |
$RLX |
1,006.44 |
-19.33 |
-1.88% |
-2.55% |
| Gold & Silver |
$XAU |
71.80 |
+1.29 |
+1.83% |
+4.39% |
| Bank |
$BKX |
71.87 |
-2.18 |
-2.94% |
-3.22% |
| Biotech |
$BTK |
3,464.55 |
+10.28 |
+0.30% |
+0.74% |
|
|
|
 |
Little Resistance Remains Due to Overhead Supply
Kenneth J. Gruneisen - Passed the CAN SLIM® Master's Exam
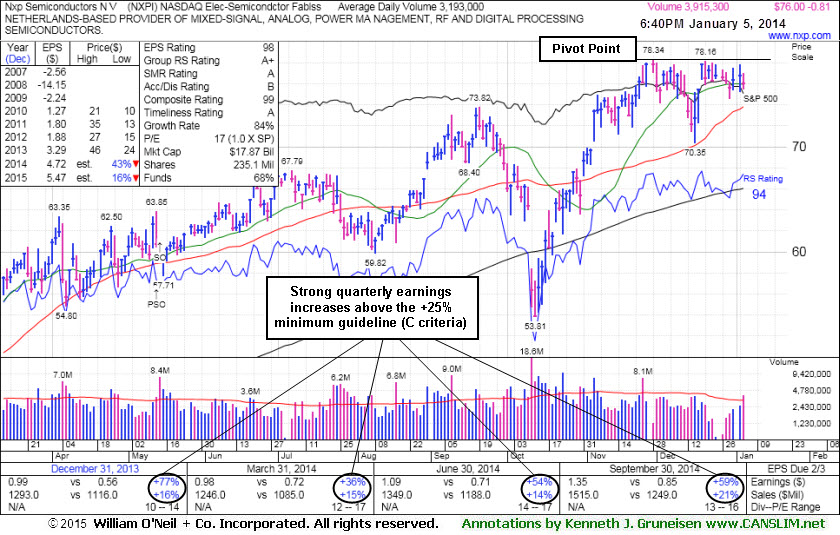
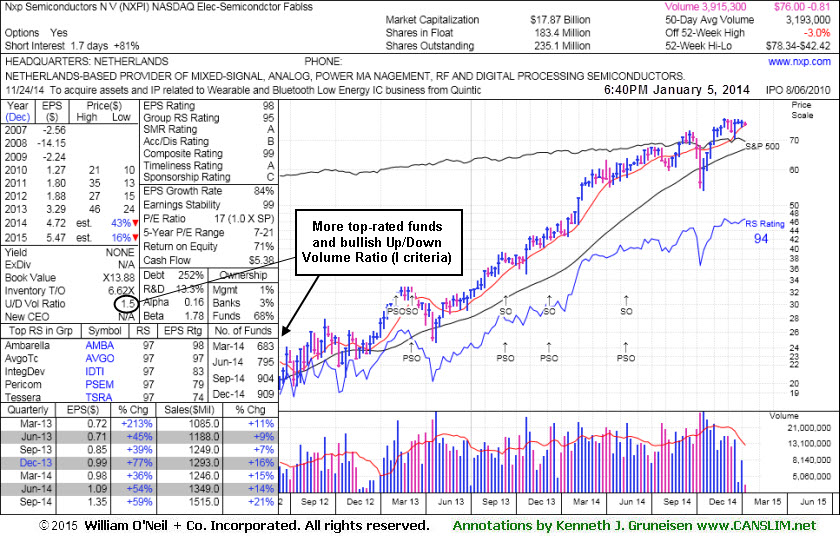
Nxp Semiconductors N V (NXPI -$0.81 or -1.05% to $76.00) has been building a new flat base while consolidating above its 50-day moving average (DMA) line, perched within close striking distance of its 52-week high. It was highlighted in yellow with a pivot point based on its 11/28/14 high plus 10 cents in the earlier mid-day report (read here). Subsequent gains above the pivot point backed by at least +40% above average volume may trigger a new technical buy signal. Little resistance remains, however investors are reminded to be patient and watch for fresh proof of institutional buying demand driving the stock to new highs (N criteria).
Fundamentals remain strong through the Sep '14 quarter with earnings above the +25% minimum guideline (C criteria) and its annual earnings (A criteria) history is a good match the investment system guidelines. NXPI rebounded impressively since damaging losses violated its 200 DMA line and it was dropped from the Featured Stocks list on 10/13/14. It was last shown in this FSU section on 10/06/14 with annotated graphs under the headline,, "Halted Slide After Negating Breakout and Undercutting 50-Day Average. Disciplined investors avoid chasing stocks more than +5% above their prior high or pivot point and always limit losses by selling any stock that falls more than -7% from their purchase price.
Its bullish 1.5 Up/Down Volume Ratio is above 1.0, an unbiased indication of institutional accumulation over the past 50 days. The number of top-rated funds owning its shares rose from 683 in Mar '14 to 909 in Dec '14, a reassuring sign concerning the I criteria. The Elec - Semicondctor Fablss group has a high 95 Group Relative Strength Rating and leadership from others in the industry group is a reassuring sign concerning the L criteria. It completed a Secondary Offering on 5/14/14 and earlier Secondary Offerings on 2/04/13, 3/08/13, 9/13/13, and 12/10/13.
|
|
|
Color Codes Explained :
Y - Better candidates highlighted by our
staff of experts.
G - Previously featured
in past reports as yellow but may no longer be buyable under the
guidelines.
***Last / Change / Volume data in this table is the closing quote data***
Symbol/Exchange
Company Name
Industry Group |
PRICE |
CHANGE
(%Change) |
Day High |
Volume
(% DAV)
(% 50 day avg vol) |
52 Wk Hi
% From Hi |
Featured
Date |
Price
Featured |
Pivot Featured |
|
Max Buy |
ACT
-
NYSE
Actavis plc
Medical-Generic Drugs
|
$256.69
|
-2.44
-0.94% |
$259.27
|
2,410,949
80.74% of 50 DAV
50 DAV is 2,986,000
|
$272.75
-5.89%
|
12/29/2014
|
$260.22
|
PP = $272.85
|
|
MB = $286.49
|
 Most Recent Note - 1/5/2015 7:07:22 PM
Y - Subsequent volume-driven gains above the pivot point may trigger a technical buy signal. Volume totals have been quiet while recently consolidating above support at prior highs and its 50 DMA line.
>>> FEATURED STOCK ARTICLE : Formed New Base Above Prior Highs and 50-Day Moving Average - 12/29/2014
View all notes |
Set NEW NOTE alert |
CANSLIM.net Company Profile |
SEC
News |
Chart |
Request a new note
C
A N
S L
I M


|
AFSI
-
NASDAQ
Amtrust Financial Svcs
INSURANCE - Property and; Casualty Insurance
|
$53.52
|
-1.59
-2.89% |
$55.41
|
689,006
66.12% of 50 DAV
50 DAV is 1,042,000
|
$59.31
-9.76%
|
10/17/2014
|
$45.24
|
PP = $46.02
|
|
MB = $48.32
|
Most Recent Note - 1/5/2015 7:09:26 PM
G - Fell near prior highs in the $53 area and its 50 DMA line ($52.73). More damaging losses would raise greater concerns.
>>> FEATURED STOCK ARTICLE : Finding Support Near Prior Highs - 12/24/2014
View all notes |
Set NEW NOTE alert |
CANSLIM.net Company Profile |
SEC
News |
Chart |
Request a new note
C
A N
S L
I M
|
ALXN
-
NASDAQ
Alexion Pharmaceuticals
DRUGS - Drug Manufacturers - Other
|
$182.17
|
-4.43
-2.37% |
$185.32
|
1,511,813
140.63% of 50 DAV
50 DAV is 1,075,000
|
$203.30
-10.39%
|
10/23/2014
|
$184.01
|
PP = $185.53
|
|
MB = $194.81
|
Most Recent Note - 1/5/2015 7:16:50 PM
G - Gapped down today for a loss on above average volume after its 50 DMA line recently acted as resistance. Faces resistance due to overhead supply up through $203. The recent low ($176.01 on 12/17/14) defines the next important support level.
>>> FEATURED STOCK ARTICLE : 50-Day Moving Average Acted as Resistance After Damaging Losses - 1/2/2015
View all notes |
Set NEW NOTE alert |
CANSLIM.net Company Profile |
SEC
News |
Chart |
Request a new note
C
A N
S L
I M
|
BIDU
-
NASDAQ
Baidu Inc Ads
INTERNET - Internet Information Providers
|
$219.79
|
-3.30
-1.48% |
$224.83
|
2,746,548
85.46% of 50 DAV
50 DAV is 3,214,000
|
$251.99
-12.78%
|
10/30/2014
|
$234.08
|
PP = $231.51
|
|
MB = $243.09
|
Most Recent Note - 1/2/2015 6:14:27 PM
G - Color code is changed to green while slumping below its 50 DMA line with higher (near average) volume. Recent lows in the $217-218 area define important near-term support where subsequent losses would raise more serious concerns.
>>> FEATURED STOCK ARTICLE : Rebound Above 50-Day Moving Average Helped Technical Stance - 12/19/2014
View all notes |
Set NEW NOTE alert |
CANSLIM.net Company Profile |
SEC
News |
Chart |
Request a new note
C
A N
S L
I M
|
EPAM
-
NYSE
Epam Systems Inc
COMPUTER SOFTWARE and SERVICES - Information Technology Service
|
$46.27
|
-0.20
-0.43% |
$47.62
|
294,289
65.84% of 50 DAV
50 DAV is 447,000
|
$52.89
-12.52%
|
10/23/2014
|
$45.21
|
PP = $46.09
|
|
MB = $48.39
|
Most Recent Note - 1/2/2015 6:17:28 PM
G - Slumped further below its 50 DMA line today raising concerns with higher (near average) volume. Subsequent losses below its recent low close ($46.24 on 12/16/14) would raise concerns and trigger a more worrisome technical sell signal.
>>> FEATURED STOCK ARTICLE : Halted Slide at 50-Day Moving Average - 12/31/2014
View all notes |
Set NEW NOTE alert |
CANSLIM.net Company Profile |
SEC
News |
Chart |
Request a new note
C
A N
S L
I M
|
Symbol/Exchange
Company Name
Industry Group |
PRICE |
CHANGE
(%Change) |
Day High |
Volume
(% DAV)
(% 50 day avg vol) |
52 Wk Hi
% From Hi |
Featured
Date |
Price
Featured |
Pivot Featured |
|
Max Buy |
FB
-
NASDAQ
Facebook Inc Cl A
INTERNET
|
$77.19
|
-1.26
-1.61% |
$79.25
|
26,395,476
88.50% of 50 DAV
50 DAV is 29,827,000
|
$82.17
-6.06%
|
12/22/2014
|
$81.79
|
PP = $81.26
|
|
MB = $85.32
|
Most Recent Note - 1/5/2015 7:15:07 PM
Y - Pulled back today on higher but below average volume, retreating near its 50 DMA line ($76.69). Little resistance remains due to overhead supply up through the $82 level, however, convincing volume-driven gains above the pivot point are needed to clinch a proper new (or add-on) technical buy signal.
>>> FEATURED STOCK ARTICLE : Gains for New Highs Backed By Lighter Volume - 12/22/2014
View all notes |
Set NEW NOTE alert |
CANSLIM.net Company Profile |
SEC
News |
Chart |
Request a new note
C
A N
S L
I M
|
ILMN
-
NASDAQ
Illumina Inc
DRUGS - Biotechnology
|
$190.72
|
+5.30
2.86% |
$193.77
|
1,548,596
145.27% of 50 DAV
50 DAV is 1,066,000
|
$197.37
-3.37%
|
12/30/2014
|
$186.26
|
PP = $196.00
|
|
MB = $205.80
|
Most Recent Note - 1/5/2015 12:52:47 PM
Y - Trading above its 50 DMA line today while still working on a new "double bottom" base. Subsequent volume-driven gains above the pivot point may trigger a new (or add-on) technical buy signal. Faces little resistance due to overhead supply up through $197.
>>> FEATURED STOCK ARTICLE : Forming New Base And Fundamentals Remain Favorable - 12/30/2014
View all notes |
Set NEW NOTE alert |
CANSLIM.net Company Profile |
SEC
News |
Chart |
Request a new note
C
A N
S L
I M
|
NXPI
-
NASDAQ
Nxp Semiconductors N V
ELECTRONICS - Semiconductor - Broad Line
|
$76.00
|
-0.81
-1.05% |
$77.00
|
3,929,637
123.07% of 50 DAV
50 DAV is 3,193,000
|
$78.34
-2.99%
|
1/5/2015
|
$76.43
|
PP = $78.44
|
|
MB = $82.36
|
Most Recent Note - 1/5/2015 7:04:55 PM
Y - Building a new flat base above its 50 DMA line, perched within close striking distance of its 52-week high. Highlighted in yellow with pivot point based on its 11/28/14 high plus 10 cents in the earlier mid-day report (read here). Subsequent volume-driven gains above the pivot point may trigger a new technical buy signal. Rebounded impressively since damaging losses violated its 200 DMA line and it was dropped from the Featured Stocks list on 10/13/14. See the latest FSU analysis for more details and new annotated graphs.
>>> FEATURED STOCK ARTICLE : Little Resistance Remains Due to Overhead Supply - 1/5/2015
View all notes |
Set NEW NOTE alert |
CANSLIM.net Company Profile |
SEC
News |
Chart |
Request a new note
C
A N
S L
I M
|
PANW
-
NYSE
Palo Alto Networks
Computer Sftwr-Security
|
$123.73
|
+2.31
1.90% |
$124.19
|
1,350,409
88.49% of 50 DAV
50 DAV is 1,526,000
|
$128.20
-3.49%
|
7/30/2014
|
$84.21
|
PP = $85.88
|
|
MB = $90.17
|
Most Recent Note - 1/5/2015 7:10:39 PM
G - Posted a gain on below average volume today. Prior reports cautioned members - "It has not formed a sound base. The 50 DMA line defines near-term support to watch below recent lows."
>>> FEATURED STOCK ARTICLE : Latest Consolidation Was Not a Base of Sufficient Length - 12/18/2014
View all notes |
Set NEW NOTE alert |
CANSLIM.net Company Profile |
SEC
News |
Chart |
Request a new note
C
A N
S L
I M
|
RH
-
NYSE
Restoration Hardware Hld
RETAIL - Home Furnishing Stores
|
$95.29
|
+0.15
0.16% |
$96.50
|
957,793
106.66% of 50 DAV
50 DAV is 898,000
|
$100.66
-5.33%
|
12/11/2014
|
$98.66
|
PP = $94.60
|
|
MB = $99.33
|
Most Recent Note - 1/5/2015 7:12:31 PM
Y - Still stubbornly holding its ground near its all-time high. Subsequent losses leading to a close below its old high close ($93.05 on 6/30/14) would completely negate the recent breakout and raise concerns.
>>> FEATURED STOCK ARTICLE : Consolidating Above Prior Highs With Volume Totals Cooling - 12/26/2014
View all notes |
Set NEW NOTE alert |
CANSLIM.net Company Profile |
SEC
News |
Chart |
Request a new note
C
A N
S L
I M
|
Symbol/Exchange
Company Name
Industry Group |
PRICE |
CHANGE
(%Change) |
Day High |
Volume
(% DAV)
(% 50 day avg vol) |
52 Wk Hi
% From Hi |
Featured
Date |
Price
Featured |
Pivot Featured |
|
Max Buy |
UIHC
-
NASDAQ
United Insurance Holding
Insurance-Prop/Cas/Titl
|
$21.25
|
+0.08
0.38% |
$21.55
|
152,537
68.71% of 50 DAV
50 DAV is 222,000
|
$22.41
-5.18%
|
12/5/2014
|
$20.64
|
PP = $20.31
|
|
MB = $21.33
|
Most Recent Note - 1/2/2015 12:53:36 PM
Y - Touched a new 52-week high today but reversed early gains. Color code is changed to yellow after retreating below its "max buy" level. Prior highs and its 50 DMA line ($19.55) define near-term support to watch.
>>> FEATURED STOCK ARTICLE : Recent Streak of Gains Lacked Volume Conviction - 12/23/2014
View all notes |
Set NEW NOTE alert |
CANSLIM.net Company Profile |
SEC
News |
Chart |
Request a new note
C
A N
S L
I M
|
VRX
-
NYSE
Valeant Pharmaceuticals
DRUGS - Drug Manufacturers - Other
|
$144.29
|
-0.16
-0.11% |
$146.73
|
2,674,901
130.36% of 50 DAV
50 DAV is 2,052,000
|
$153.10
-5.75%
|
1/5/2015
|
$144.84
|
PP = $149.90
|
|
MB = $157.40
|
Most Recent Note - 1/5/2015 1:37:54 PM
Y - Fundamentals remain strong with earnings above the +25% minimum guideline (C criteria) through the Sep '14 quarter. Color code is changed to yellow with new pivot point cited based on the 12/22/14 high while building a cup-with-handle base. Subsequent volume-driven gains above the pivot point may trigger a new technical buy signal. Faces little resistance due to overhead supply up through the $153 level. Went through a deep consolidation below its 200 DMA line then rebounded since dropped from the Featured Stocks list on 4/04/14.

>>> FEATURED STOCK ARTICLE : After Damaging Losses a Rebound Above 50 DMA Line is Needed - 4/2/2014
View all notes |
Set NEW NOTE alert |
CANSLIM.net Company Profile |
SEC
News |
Chart |
Request a new note
C
A N
S L
I M
|
|
|
|
THESE ARE NOT BUY RECOMMENDATIONS!
Comments contained in the body of this report are technical
opinions only. The material herein has been obtained
from sources believed to be reliable and accurate, however,
its accuracy and completeness cannot be guaranteed.
This site is not an investment advisor, hence it does
not endorse or recommend any securities or other investments.
Any recommendation contained in this report may not
be suitable for all investors and it is not to be deemed
an offer or solicitation on our part with respect to
the purchase or sale of any securities. All trademarks,
service marks and trade names appearing in this report
are the property of their respective owners, and are
likewise used for identification purposes only.
This report is a service available
only to active Paid Premium Members.
You may opt-out of receiving report notifications
at any time. Questions or comments may be submitted
by writing to Premium Membership Services 665 S.E. 10 Street, Suite 201 Deerfield Beach, FL 33441-5634 or by calling 1-800-965-8307
or 954-785-1121.
|
|
|

