You are not logged in.
This means you
CAN ONLY VIEW reports that were published prior to Tuesday, March 11, 2025.
You
MUST UPGRADE YOUR MEMBERSHIP if you want to see any current reports.
AFTER MARKET UPDATE - MONDAY, DECEMBER 30TH, 2024
Previous After Market Report Next After Market Report >>>
|
|
|
|
DOW |
-361.56 |
42,630.65 |
-0.84% |
|
Volume |
205,387,556 |
-49% |
|
Volume |
4,775,557,700 |
-0% |
|
NASDAQ |
-174.94 |
19,547.09 |
-0.89% |
|
Advancers |
922 |
34% |
|
Advancers |
1,361 |
31% |
|
S&P 500 |
-48.32 |
5,922.52 |
-0.81% |
|
Decliners |
1,823 |
66% |
|
Decliners |
2,976 |
69% |
|
Russell 2000 |
-16.71 |
2,227.89 |
-0.74% |
|
52 Wk Highs |
13 |
|
|
52 Wk Highs |
68 |
|
|
S&P 600 |
-7.03 |
1,409.51 |
-0.50% |
|
52 Wk Lows |
144 |
|
|
52 Wk Lows |
140 |
|
|
 |
Leadership was Elusive as Major Indices Fell
Kenneth J. Gruneisen - Passed the CAN SLIM® Master's Exam
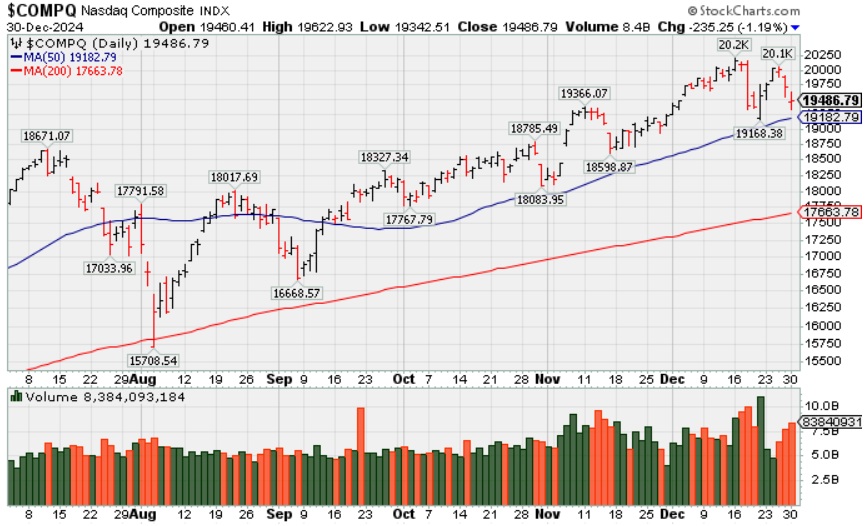
The S&P 500 was more than 100 points lower at its intraday close and settled about 64 points lower, showing a 1.1% decline. The Nasdaq Composite traded down as much as 1.9% at its low and closed 1.2% below its prior close. The volume totals were higher than the prior session totals on the NYSE and on the Nasdaq exchange. Breadth was negative as decliners led advancers by a 2-1 margin at the NYSE and by more than 2-1 at the Nasdaq exchange. Leadership remained thin as there was 1 high-ranked company from the Leaders List that hit a new 52-week high and was listed on the BreakOuts Page, versus the total of 5 on the prior session. New 52-week lows outnumbered new 52-week highs on the NYSE and on the Nasdaq exchange. The major indices' uptrend has come under pressure (M criteria). Disciplined investors know that new buying efforts are only to be made in stocks meeting all key criteria of the fact-based investment system.
PICTURED: The Nasdaq Composite Index is consolidating above its 50-day moving average (DMA) line and perched -3.6% off its all-time high.
Turnaround action in NVIDIA (NVDA +0.35%) helped the major indices recover off of the session lows. NVDA shares had been down as much as -2.2% at their worst levels of the day. However, all 11 S&P 500 sectors logged declines ranging from -0.1% (energy) to -1.6% (consumer discretionary).
The 10-yr yield settled seven basis points lower at 4.55% and the 2-yr yield settled eight basis points lower at 4.25%. The U.S. markets are open for a full day of trading on Tuesday, but will be closed Wednesday.
|
 Kenneth J. Gruneisen started out as a licensed stockbroker in August 1987, a couple of months prior to the historic stock market crash that took the Dow Jones Industrial Average down -22.6% in a single day. He has published daily fact-based fundamental and technical analysis on high-ranked stocks online for two decades. Through FACTBASEDINVESTING.COM, Kenneth provides educational articles, news, market commentary, and other information regarding proven investment systems that work in good times and bad.
Comments contained in the body of this report are technical opinions only and are not necessarily those of Gruneisen Growth Corp. The material herein has been obtained from sources believed to be reliable and accurate, however, its accuracy and completeness cannot be guaranteed. Our firm, employees, and customers may effect transactions, including transactions contrary to any recommendation herein, or have positions in the securities mentioned herein or options with respect thereto. Any recommendation contained in this report may not be suitable for all investors and it is not to be deemed an offer or solicitation on our part with respect to the purchase or sale of any securities. |
|
 |
Tech, Retail, Financial, and Gold & Silver Indexes Fell
Kenneth J. Gruneisen - Passed the CAN SLIM® Master's Exam
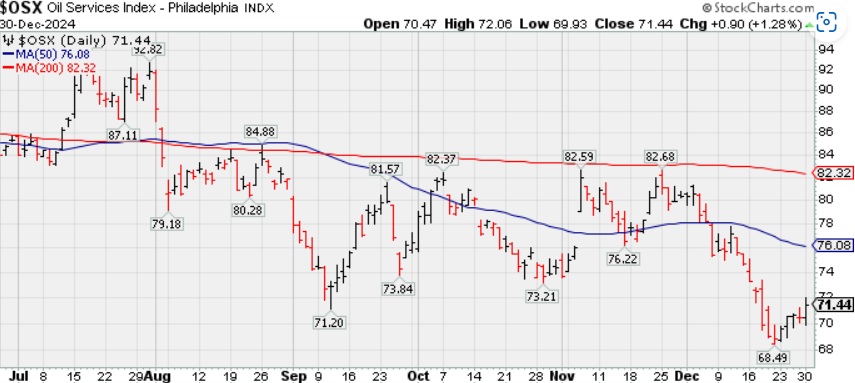
The Broker/Dealer Index ($XBD -0.90%), Bank Index ($BKX -0.64%), and the Retail Index ($RLX -1.16%) each finished the session lower. The tech sector had a negative bias as the Semiconductor Index ($SOX -1.88%), Networking Index ($NWX -1.76%), and the Biotech Index ($BTK -1.29%) posted unanimous losses. The Oil Services Index ($OSX +1.28%) finished the session higher while the Integrated Oil Index ($XOI +0.19%) eked out a smaller gain, but the Gold & Silver Index ($XAU -1.86%) lost ground.
PICTURED: The Oil Services Index ($OSX +1.28%) posted its 3rd gain in the span of 4 sessions, rebounding from its 2024 low.
| Oil Services |
$OSX |
71.68 |
+1.14 |
+1.62% |
-14.55% |
| Integrated Oil |
$XOI |
1,737.68 |
+8.48 |
+0.49% |
-6.70% |
| Semiconductor |
$SOX |
5,040.90 |
-82.07 |
-1.60% |
+20.73% |
| Networking |
$NWX |
1,256.86 |
-17.76 |
-1.39% |
+50.92% |
| Broker/Dealer |
$XBD |
809.80 |
-5.41 |
-0.66% |
+45.31% |
| Retail Index |
$RLX |
5,328.47 |
+81.72 |
+1.56% |
+37.02% |
| Gold & Silver |
$XAU |
135.93 |
-2.89 |
-2.08% |
+8.15% |
| Bank |
$BKX |
127.81 |
-0.65 |
-0.51% |
+33.11% |
| Biotech |
$BTK |
5,728.90 |
-59.77 |
-1.03% |
+5.72% |
|
|
|
 |
Featured Stocks
Kenneth J. Gruneisen - Passed the CAN SLIM® Master's Exam
Symbol/Exchange
Company Name
Industry Group | PRICE | CHANGE
(%Change) | Day High | Volume
(% DAV)
(% 50 day avg vol) | 52 Wk Hi
% From Hi | Featured
Date | Price
Featured | Pivot Featured | | Max Buy |  USLM - NASDAQ USLM - NASDAQ
U.S. Lime & Minerals
Bldg-Cement/Concrt/Ag | $137.05 | +1.47
1.08% | $137.05 | 26,267
25.02% of 50 DAV
50 DAV is 105,000 | $159.53
-14.09%
| 9/17/2024 | $71.26 | PP = $87.23 | | MB = $91.59 | Most Recent Note - 12/24/2024 2:03:13 PM
G - Finding prompt support at its 50 DMA line ($132.29). More damaging losses would raise concerns and trigger a technical sell signal.
>>> FEATURED STOCK ARTICLE : Extended From Any Sound Base After Impressive Rally - 11/12/2024 | View all notes | Set NEW NOTE alert | Company Profile | SEC News | Chart | Request a new note C A S I | GVA - NYSE
Granite Construction
Bldg-Heavy Construction | $89.21 | +0.11
0.12% | $89.21 | 54,065
7.89% of 50 DAV
50 DAV is 685,000 | $105.20
-15.20%
| 6/11/2024 | $59.76 | PP = $64.33 | | MB = $67.55 | Most Recent Note - 12/24/2024 1:04:18 PM
G - Sputtering below its 50 DMA line ($92), enduring distributional pressure after a "negative reversal" at its all-time high. Reported Sep ''24 quarterly earnings +19% on +14% sales revenues versus the year-ago period, repeatedly noted as "below the +25% minimum guideline (C criteria) of the fact-based investment system."
>>> FEATURED STOCK ARTICLE : Negative Reversal After Hitting New All-Time High - 12/6/2024 | View all notes | Set NEW NOTE alert | Company Profile | SEC News | Chart | Request a new note C A S I | TXRH - NASDAQ
Texas Roadhouse
Retail-Restaurants | $181.41 | -0.45
-0.25% | $181.70 | 210,325
29.67% of 50 DAV
50 DAV is 709,000 | $206.04
-11.95%
| 7/26/2024 | $173.08 | PP = $175.82 | | MB = $184.61 | Most Recent Note - 12/24/2024 1:14:41 PM
G - Still lingering below its 50 DMA line ($191) and raising concerns with recent losses. A rebound above the 50 DMA line is needed for its outlook to improve.
>>> FEATURED STOCK ARTICLE : Hovering Near High After Recent Volume-driven Gains - 11/15/2024 | View all notes | Set NEW NOTE alert | Company Profile | SEC News | Chart | Request a new note C A S I | HWM - NYSE
Howmet Aerospace
Aerospace/Defense | $110.62 | -0.62
-0.55% | $110.63 | 347,283
14.59% of 50 DAV
50 DAV is 2,380,000 | $120.71
-8.36%
| 7/30/2024 | $93.95 | PP = $85.52 | | MB = $89.80 | Most Recent Note - 12/24/2024 1:05:36 PM
G - Finding prompt support near its 50 DMA line ($110.84) and well above the prior high ($106.93 on 10/21/24) defining near-term support levels to watch. Fundamentals remain strong.
>>> FEATURED STOCK ARTICLE : Extended From Prior Base and Perched at High - 12/5/2024 | View all notes | Set NEW NOTE alert | Company Profile | SEC News | Chart | Request a new note C A S I | NGVC - NYSE
Natural Grocers
Retail-Super/Mini Mkts | $39.15 | -0.13
-0.33% | $39.21 | 17,274
15.85% of 50 DAV
50 DAV is 109,000 | $47.57
-17.70%
| 11/5/2024 | $30.57 | PP = $30.42 | | MB = $31.94 | Most Recent Note - 12/24/2024 2:02:03 PM
G - Consolidating above its 50 DMA line ($35.81) and still very extended from any sound base. Reported Sep '24 quarterly earnings +50% on +9% sales revenues versus the year-ago period.
>>> FEATURED STOCK ARTICLE : Consolidating After Considerable Rally to New Highs - 12/16/2024 | View all notes | Set NEW NOTE alert | Company Profile | SEC News | Chart | Request a new note C A S I | Symbol/Exchange
Company Name
Industry Group | PRICE | CHANGE
(%Change) | Day High | Volume
(% DAV)
(% 50 day avg vol) | 52 Wk Hi
% From Hi | Featured
Date | Price
Featured | Pivot Featured | | Max Buy | CLS - NYSE
Celestica
Elec-Contract Mfg | $94.59 | -0.51
-0.54% | $94.65 | 557,560
23.55% of 50 DAV
50 DAV is 2,368,000 | $100.51
-5.89%
| 10/11/2024 | $57.62 | PP = $63.59 | | MB = $66.77 | Most Recent Note - 12/24/2024 2:00:31 PM
G - Volume totals have been cooling while hovering near its all-time high, very extended from any sound base. Its 50 DMA line ($81.32) defines initial support to watch on pullbacks.
>>> FEATURED STOCK ARTICLE : Pulling Back After Considerable Rally - 11/13/2024 | View all notes | Set NEW NOTE alert | Company Profile | SEC News | Chart | Request a new note C A S I | PAY - NYSE
Paymentus Holdings
Finance-CrdtCard/PmtPr | $32.92 | -0.09
-0.27% | $32.94 | 78,108
17.05% of 50 DAV
50 DAV is 458,000 | $38.94
-15.46%
| 10/17/2024 | $26.15 | PP = $25.31 | | MB = $26.58 | Most Recent Note - 12/23/2024 7:48:51 PM
G - Pulled back today with below average volume, still perched well above its 50 DMA line ($30.94) which defines important near-term support to watch. It is extended from any sound base.
>>> FEATURED STOCK ARTICLE : Extended From Prior Base After Considerable Spike Higher - 11/14/2024 | View all notes | Set NEW NOTE alert | Company Profile | SEC News | Chart | Request a new note C A S I | RMD - NYSE
ResMed
Medical-Products | $229.19 | -3.99
-1.71% | $232.52 | 105,194
11.21% of 50 DAV
50 DAV is 938,000 | $260.49
-12.02%
| 10/25/2024 | $256.64 | PP = $255.28 | | MB = $268.04 |  Most Recent Note - 12/30/2024 9:57:20 PM Most Recent Note - 12/30/2024 9:57:20 PM
G - Ended down today with a loss on light volume, still sputtering after recently shaking out below prior lows. A rebound above its 50 DMA line ($242) is needed for its outlook to improve. Its Relative Strength Rating is 80, right at the 80+ minimum guideline for buy candidates.
>>> FEATURED STOCK ARTICLE : Recent Slump Below 50-Day Moving Average Raised Concerns - 11/18/2024 | View all notes | Set NEW NOTE alert | Company Profile | SEC News | Chart | Request a new note C A S I | ATGE - NYSE
Adtalem Global Education
Consumer Svcs-Education | $90.81 | -0.06
-0.07% | $90.89 | 39,671
9.77% of 50 DAV
50 DAV is 406,000 | $92.93
-2.28%
| 10/30/2024 | $83.34 | PP = $80.28 | | MB = $84.29 | Most Recent Note - 12/23/2024 7:53:27 PM
G - Posted a gain today with below-average volume. Consolidating in an orderly fashion above its 50 DMA line ($84.76) which defines initial support above prior highs in the $80 area. Fundamentals remain strong.
>>> FEATURED STOCK ARTICLE : Hovering Near High With Volume Totals Cooling - 12/4/2024 | View all notes | Set NEW NOTE alert | Company Profile | SEC News | Chart | Request a new note C A S I | TW - NASDAQ
Tradeweb Markets
Financial Svcs-Specialty | $133.22 | -1.71
-1.27% | $134.82 | 107,492
12.75% of 50 DAV
50 DAV is 843,000 | $141.69
-5.98%
| 11/19/2024 | $134.41 | PP = $136.23 | | MB = $143.04 | Most Recent Note - 12/24/2024 1:13:15 PM
Y - Finding support and consolidating above its 50 DMA line ($131.93). Since recently featured it has not produced a volume-driven gain above the pivot point to trigger a proper technical buy signal. It was highlighted in yellow with pivot point cited based on its 10/15/24 high plus 10 cents.
>>> FEATURED STOCK ARTICLE : Tradeweb Markets Perched Near High - 11/19/2024 | View all notes | Set NEW NOTE alert | Company Profile | SEC News | Chart | Request a new note C A S I | Symbol/Exchange
Company Name
Industry Group | PRICE | CHANGE
(%Change) | Day High | Volume
(% DAV)
(% 50 day avg vol) | 52 Wk Hi
% From Hi | Featured
Date | Price
Featured | Pivot Featured | | Max Buy | ATAT - NASDAQ
Atour Lifestyle Hldgs ADR
Leisure-Lodging | $26.44 | -0.57
-2.09% | $26.65 | 473,868
37.37% of 50 DAV
50 DAV is 1,268,000 | $29.90
-11.59%
| 12/9/2024 | $29.34 | PP = $29.25 | | MB = $30.71 | Most Recent Note - 12/24/2024 11:30:53 AM
Y - Challenging the prior high with today's 4th consecutive gain. Found support near its 50 DMA line ($26.67). A violation would trigger a technical sell signal.
>>> FEATURED STOCK ARTICLE : Volume Above Average Behind Breakout Gain - 12/9/2024 | View all notes | Set NEW NOTE alert | Company Profile | SEC News | Chart | Request a new note C A S I | VEEV - NYSE
Veeva Systems Inc Cl A
Computer Sftwr-Medical | $212.21 | -1.80
-0.84% | $212.58 | 253,240
21.75% of 50 DAV
50 DAV is 1,164,400 | $258.93
-18.04%
| 12/9/2024 | $250.70 | PP = $240.68 | | MB = $252.71 | Most Recent Note - 12/24/2024 2:06:15 PM
G - Color code is changed to green after slumping below its 50 DMA line ($223) raising serious concerns. A rebound above the 50 DMA line is needed for its outlook to improve. Its Relative Strength Rating has slumped to 74, well below the 80+ minimum guideline for buy candidates. Slumped considerably following a noted 12/06/24 "breakaway gap".Fundamentals remain strong.
>>> FEATURED STOCK ARTICLE : Veeva Systems Consolidating After "Breakaway Gap" - 12/10/2024 | View all notes | Set NEW NOTE alert | Company Profile | SEC News | Chart | Request a new note C A S I | CRAI - NASDAQ
CRA International
Comml Svcs-Consulting | $185.02 | -1.82
-0.97% | $185.30 | 6,173
18.16% of 50 DAV
50 DAV is 34,000 | $210.70
-12.19%
| 12/17/2024 | $208.34 | PP = $208.48 | | MB = $218.90 | Most Recent Note - 12/24/2024 1:59:29 PM
Y - Negated the prior breakout promptly and slumped well below its 50 DMA line raising concerns with big volume-driven losses. A rebound above the 50 DMA line ($192) is needed for its outlook to improve. Fundamentals remain strong.
>>> FEATURED STOCK ARTICLE : Volume-Driven Gain for New High Triggered Technical Buy Signal - 12/17/2024 | View all notes | Set NEW NOTE alert | Company Profile | SEC News | Chart | Request a new note C A S I |
|
|
|
Color Codes Explained :
Y - Better candidates highlighted by our
staff of experts.
G - Previously featured
in past reports as yellow but may no longer be buyable under the
guidelines.
***Last / Change / Volume data in this table is the closing quote data***
|
|
|
THESE ARE NOT BUY RECOMMENDATIONS!
Comments contained in the body of this report are technical
opinions only. The material herein has been obtained
from sources believed to be reliable and accurate, however,
its accuracy and completeness cannot be guaranteed.
This site is not an investment advisor, hence it does
not endorse or recommend any securities or other investments.
Any recommendation contained in this report may not
be suitable for all investors and it is not to be deemed
an offer or solicitation on our part with respect to
the purchase or sale of any securities. All trademarks,
service marks and trade names appearing in this report
are the property of their respective owners, and are
likewise used for identification purposes only.
This report is a service available
only to active Paid Premium Members.
You may opt-out of receiving report notifications
at any time. Questions or comments may be submitted
by writing to Premium Membership Services 665 S.E. 10 Street, Suite 201 Deerfield Beach, FL 33441-5634 or by calling 1-800-965-8307
or 954-785-1121.
|
|
|