You are not logged in.
This means you
CAN ONLY VIEW reports that were published prior to Thursday, February 27, 2025.
You
MUST UPGRADE YOUR MEMBERSHIP if you want to see any current reports.
AFTER MARKET UPDATE - WEDNESDAY, NOVEMBER 22ND, 2023
Previous After Market Report Next After Market Report >>>
|
|
|
|
DOW |
+184.74 |
35,273.03 |
+0.53% |
|
Volume |
705,428,006 |
-11% |
|
Volume |
3,895,764,600 |
-7% |
|
NASDAQ |
+65.88 |
14,265.86 |
+0.46% |
|
Advancers |
1,752 |
63% |
|
Advancers |
2,625 |
62% |
|
S&P 500 |
+18.43 |
4,556.62 |
+0.41% |
|
Decliners |
1,037 |
37% |
|
Decliners |
1,629 |
38% |
|
Russell 2000 |
+12.28 |
1,795.54 |
+0.69% |
|
52 Wk Highs |
77 |
|
|
52 Wk Highs |
134 |
|
|
S&P 600 |
+6.32 |
1,167.96 |
+0.54% |
|
52 Wk Lows |
23 |
|
|
52 Wk Lows |
126 |
|
|
 |
Indices Posted Gains With Lighter Volume Totals
Kenneth J. Gruneisen - Passed the CAN SLIM® Master's Exam
The major indices all posted small gains on Wednesday. Volume was reported lighter than the prior session on the NYSE and on the Nasdaq exchange. Breadth was positive as advancers led decliners by about a 3-2 margin on the NYSE and on the Nasdaq exchange. There were 82 high-ranked companies from the Leaders List that hit new 52-week highs and were listed on the BreakOuts Page, versus the total of 57 on the prior session. New 52-week highs outnumbered new 52-week lows on the NYSE and on the Nasdaq exchange. The major indices are in a confirmed uptrend (M criteria). New buying efforts should be only made in stocks fitting all key criteria of the fact-based investment system.
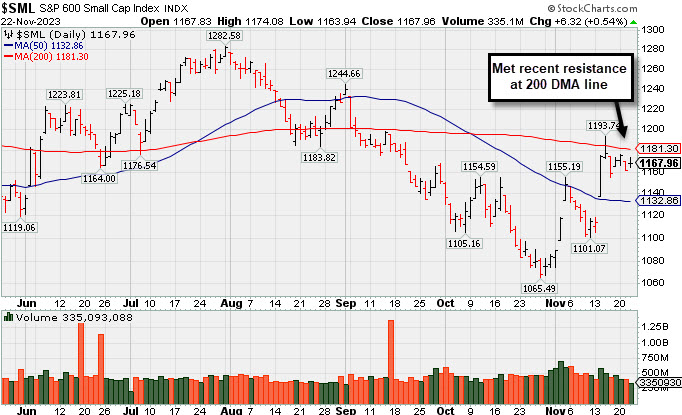
PICTURED: The S&P 600 Small Cap Index met recent resistance at its 200-day moving avergae (DMA) line. After an encouraging initial jobless claims report on Wednesday every sector finished the session higher with the exception of the energy sector (-0.1%). The energy sector trailed all day and finished the session at $77.05 per barrel, down -0.7% after OPEC+ delayed its weekend meeting until November 30th. Saudi Arabia is reportedly dissatisfied with the oil production levels of other members.
An impressive earnings report from NVIDIA (NVDA -2.5%) failed to excite buyers. Deere (DE -3.11%), Guess? (GES -12.27%), Urban Outfitters (URBN -12.37%), Nordstrom (JWN -4.63%), and Autodesk (ADSK -6.90%) were some laggards of note following their earnings reports. Tesla (TSLA -2.90%) quietly slipped back below its 50-day moving average.
Israel and Hamas agreeing to a four day pause in fighting as part of a hostage release deal. Markets remained calm following the news that Rainbow Bridge at Niagara Falls was closed after a vehicle traveling to the U.S. from Canada had exploded. Law enforcement officials were reportedly not calling this incident an act of terrorism.
As a reminder, the stock market will be closed on Thursday and will end trading early at 1PM on Friday. |
 Kenneth J. Gruneisen started out as a licensed stockbroker in August 1987, a couple of months prior to the historic stock market crash that took the Dow Jones Industrial Average down -22.6% in a single day. He has published daily fact-based fundamental and technical analysis on high-ranked stocks online for two decades. Through FACTBASEDINVESTING.COM, Kenneth provides educational articles, news, market commentary, and other information regarding proven investment systems that work in good times and bad.
Comments contained in the body of this report are technical opinions only and are not necessarily those of Gruneisen Growth Corp. The material herein has been obtained from sources believed to be reliable and accurate, however, its accuracy and completeness cannot be guaranteed. Our firm, employees, and customers may effect transactions, including transactions contrary to any recommendation herein, or have positions in the securities mentioned herein or options with respect thereto. Any recommendation contained in this report may not be suitable for all investors and it is not to be deemed an offer or solicitation on our part with respect to the purchase or sale of any securities. |
|
 |
Retail, Financial, Tech, and Gold & Silver Indexes Rose
Kenneth J. Gruneisen - Passed the CAN SLIM® Master's Exam
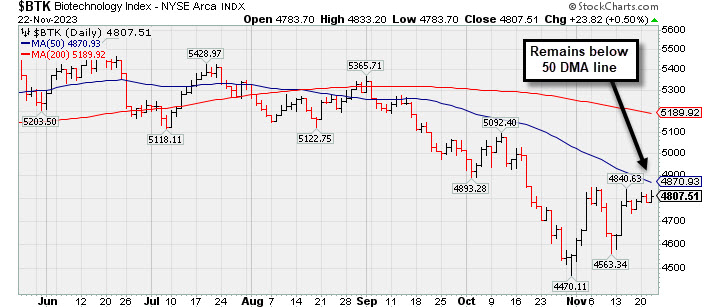
The Retail Index ($RLX +1.52%) posted a solid gain while the Bank Index ($BKX +0.22%) and Broker/Dealer Index ($XBD +0.64%) bothn edged higher. The tech sector saw modst gains from the Semiconductor Index ($SOX +0.33%), Networking Index ($NWX +0.87%), and the Biotech Index ($BTK +0.50%). The Integrated Oil Index ($XOI -0.21%) and the Oil Services Index ($OSX -0.12%) both ended slightly lower, meanwhile, the Gold & Silver Index ($XAU +0.46%) posted a small gain.
PICTURED: The Biotech Index ($BTK +0.50%) remains below its 50-day moving average (DMA) line.
| Oil Services |
$OSX |
83.00 |
-0.10 |
-0.12% |
-1.02% |
| Integrated Oil |
$XOI |
1,843.20 |
-3.93 |
-0.21% |
+3.13% |
| Semiconductor |
$SOX |
3,744.96 |
+12.16 |
+0.33% |
+47.90% |
| Networking |
$NWX |
722.64 |
+6.21 |
+0.87% |
-7.75% |
| Broker/Dealer |
$XBD |
491.72 |
+3.11 |
+0.64% |
+9.48% |
| Retail |
$RLX |
3,685.07 |
+55.35 |
+1.52% |
+33.81% |
| Gold & Silver |
$XAU |
116.02 |
+0.53 |
+0.46% |
-4.01% |
| Bank |
$BKX |
82.42 |
+0.18 |
+0.22% |
-18.28% |
| Biotech |
$BTK |
4,807.51 |
+23.82 |
+0.50% |
-8.97% |
|
|
|
 |
Featured Stocks
Kenneth J. Gruneisen - Passed the CAN SLIM® Master's Exam
Symbol/Exchange
Company Name
Industry Group | PRICE | CHANGE
(%Change) | Day High | Volume
(% DAV)
(% 50 day avg vol) | 52 Wk Hi
% From Hi | Featured
Date | Price
Featured | Pivot Featured | | Max Buy |  ANET - NYSE ANET - NYSE
Arista Networks
Computer-Networking | $217.69 | +2.37
1.10% | $221.41 | 1,739,218
80.37% of 50 DAV
50 DAV is 2,164,000 | $218.36
-0.31%
| 10/31/2023 | $188.84 | PP = $198.80 | | MB = $208.74 |  Most Recent Note - 11/22/2023 5:01:27 PM Most Recent Note - 11/22/2023 5:01:27 PM
G - Hit a new all-time high with a gain today backed by below-average volume. Prior highs in the $198 area define near-term support above its 50 DMA line ($195). Fundamentals remain strong.
>>> FEATURED STOCK ARTICLE : Powerful Gain Following Earnings Report for Arista Networks - 10/31/2023 | View all notes | Set NEW NOTE alert | Company Profile | SEC News | Chart | Request a new note C A S I | NVO - NYSE
Novo Nordisk ADR
Medical-Ethical Drugs | $103.26 | +0.48
0.47% | $103.71 | 2,500,485
50.88% of 50 DAV
50 DAV is 4,914,000 | $104.00
-0.71%
| 11/2/2023 | $100.97 | PP = $104.10 | | MB = $109.31 | Most Recent Note - 11/22/2023 5:03:42 PM
Y - Stubbornly holding its ground perched only -0.7% off its 52-week high. Found prompt support last week at its 50 DMA line ($96.60). Subsequent gains for new highs backed by at least +40% above average volume are needed to trigger a technical buy signal.
>>> FEATURED STOCK ARTICLE : Approaching Prior High With Strong Fundamentals - 11/2/2023 | View all notes | Set NEW NOTE alert | Company Profile | SEC News | Chart | Request a new note C A S I | QLYS - NASDAQ
Qualys
Computer Sftwr-Security | $179.24 | -1.53
-0.85% | $183.49 | 287,046
82.48% of 50 DAV
50 DAV is 348,000 | $180.96
-0.95%
| 11/3/2023 | $167.50 | PP = $165.03 | | MB = $173.28 | Most Recent Note - 11/22/2023 5:06:23 PM
G - There was a "negative reversal" today after hitting another new all-time high and it closed near the session low. Prior high ($165) defines initial support to watch on pullbacks.
>>> FEATURED STOCK ARTICLE : Powerful Breakout for Qualys - 11/3/2023 | View all notes | Set NEW NOTE alert | Company Profile | SEC News | Chart | Request a new note C A S I | AXON - NASDAQ
Axon Enterprise
Security/Sfty | $226.87 | -1.55
-0.68% | $230.82 | 233,168
48.88% of 50 DAV
50 DAV is 477,000 | $231.71
-2.09%
| 11/8/2023 | $127.84 | PP = $223.30 | | MB = $234.47 | Most Recent Note - 11/22/2023 5:02:36 PM
Y - Paused today following 4 consecutive small gains backed by light volume as it inched back above the pivot point. More damaging losses below the recent low ($212.89 on 11/09/23) would raise greater concerns.
>>> FEATURED STOCK ARTICLE : Breakout for Axon as it Returns to Featured Stocks List - 11/8/2023 | View all notes | Set NEW NOTE alert | Company Profile | SEC News | Chart | Request a new note C A S I | TDG - NYSE
TransDigm Group
Aerospace/Defense | $970.20 | -0.83
-0.09% | $979.71 | 137,342
52.82% of 50 DAV
50 DAV is 260,000 | $1,013.08
-4.23%
| 11/9/2023 | $982.68 | PP = $940.10 | | MB = $987.11 | Most Recent Note - 11/22/2023 5:07:01 PM
G - It stalled after briefly trading above the $1,000 threshold last week. Fundamentals remain strong. Prior high ($940) defines initial support to watch on pullbacks.
>>> FEATURED STOCK ARTICLE : TransDigm''s Big Gap Up Gain Triggered Technical Buy Signal - 11/9/2023 | View all notes | Set NEW NOTE alert | Company Profile | SEC News | Chart | Request a new note C A S I | Symbol/Exchange
Company Name
Industry Group | PRICE | CHANGE
(%Change) | Day High | Volume
(% DAV)
(% 50 day avg vol) | 52 Wk Hi
% From Hi | Featured
Date | Price
Featured | Pivot Featured | | Max Buy | PANW - NASDAQ
Palo Alto Networks
Computer Sftwr-Security | $263.14 | -0.89
-0.34% | $268.10 | 2,744,233
75.98% of 50 DAV
50 DAV is 3,612,000 | $265.90
-1.04%
| 11/13/2023 | $255.90 | PP = $266.00 | | MB = $279.30 | Most Recent Note - 11/22/2023 5:05:01 PM
Y - There was a "negative reversal" today after touching a new all-time high following 3 consecutive gains. Subsequent gains above the pivot point backed by at least +40% above average volume may trigger a technical buy signal. Recovered quickly above its 50 DMA line after testing the prior low ($233.81 on 11/06/23) last week. Fundamentals remain strong after it reported Oct '23 quarterly earnings +66% on +20% sales revenues versus the year-ago period.
>>> FEATURED STOCK ARTICLE : Earnings New Due While Perched Near Prior High - 11/13/2023 | View all notes | Set NEW NOTE alert | Company Profile | SEC News | Chart | Request a new note C A S I |
|
|
|
Color Codes Explained :
Y - Better candidates highlighted by our
staff of experts.
G - Previously featured
in past reports as yellow but may no longer be buyable under the
guidelines.
***Last / Change / Volume data in this table is the closing quote data***
|
|
|
THESE ARE NOT BUY RECOMMENDATIONS!
Comments contained in the body of this report are technical
opinions only. The material herein has been obtained
from sources believed to be reliable and accurate, however,
its accuracy and completeness cannot be guaranteed.
This site is not an investment advisor, hence it does
not endorse or recommend any securities or other investments.
Any recommendation contained in this report may not
be suitable for all investors and it is not to be deemed
an offer or solicitation on our part with respect to
the purchase or sale of any securities. All trademarks,
service marks and trade names appearing in this report
are the property of their respective owners, and are
likewise used for identification purposes only.
This report is a service available
only to active Paid Premium Members.
You may opt-out of receiving report notifications
at any time. Questions or comments may be submitted
by writing to Premium Membership Services 665 S.E. 10 Street, Suite 201 Deerfield Beach, FL 33441-5634 or by calling 1-800-965-8307
or 954-785-1121.
|
|
|