You are not logged in.
This means you
CAN ONLY VIEW reports that were published prior to Monday, April 21, 2025.
You
MUST UPGRADE YOUR MEMBERSHIP if you want to see any current reports.
AFTER MARKET UPDATE - WEDNESDAY, OCTOBER 12TH, 2022
Previous After Market Report Next After Market Report >>>
|
|
|
|
DOW |
-28.34 |
29,210.85 |
-0.10% |
|
Volume |
897,981,375 |
-18% |
|
Volume |
4,038,169,500 |
-14% |
|
NASDAQ |
-9.09 |
10,417.10 |
-0.09% |
|
Advancers |
1,137 |
37% |
|
Advancers |
2,029 |
45% |
|
S&P 500 |
-11.81 |
3,577.03 |
-0.33% |
|
Decliners |
1,903 |
63% |
|
Decliners |
2,463 |
55% |
|
Russell 2000 |
-5.15 |
1,687.76 |
-0.30% |
|
52 Wk Highs |
8 |
|
|
52 Wk Highs |
31 |
|
|
S&P 600 |
-7.24 |
1,089.14 |
-0.66% |
|
52 Wk Lows |
464 |
|
|
52 Wk Lows |
602 |
|
|
The market (M criteria) is still in a correction. Disciplined investors know to protect cash by avoiding any new buys until a new uptrend is confirmed with a proper follow-through day.
|
 |
Major Averages Sputter and Continue to Lack Leadership
Kenneth J. Gruneisen - Passed the CAN SLIM® Master's Exam
The Dow lost 28 points, while the Nasdaq Composite fell 0.1%. The S&P 500 slid 0.3%. Seven of 11 S&P 500 sectors ended in negative territory, with Utilities leading laggards. The volume totals reported were lighter than the prior session on the NYSE and on the Nasdaq exchange. Breadth was negative as decliners led advancers by a 3-2 margin on the NYSE and 5-4 on the Nasdaq exchange. There was 1 high-ranked company from the Leaders List that hit a new 52-week high and was listed on the BreakOuts Page, versus the total of 2 on the prior session. New 52-week lows totals again solidly outnumbered shrinking new 52-week highs totals on both the NYSE and the Nasdaq exchange. The market is still in a correction (M criteria). Caution and patience remain paramount. Disciplined investors know to watch for a follow-through day of big gains to confirm a new uptrend.
Chart courtesy of www.stockcharts.com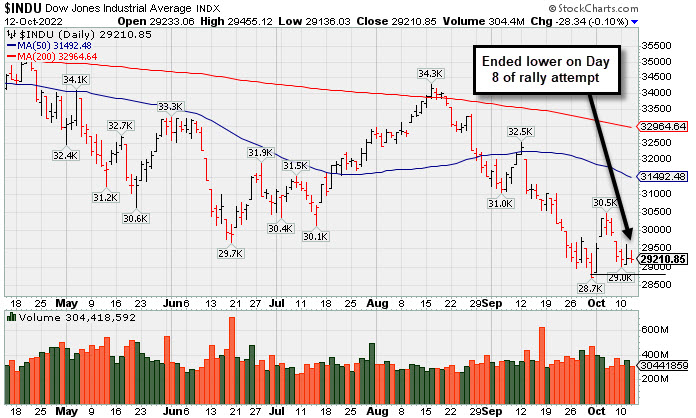 PICTURED: The Dow Jones Industrial Average ended lower on Day 8 of the rally attempt. A solid follow-through day of gains is needed as confirmation of a new market uptrend. Only the Dow Jones Industrial Average has avoided undercutting its Day 1 low.
U.S. equities finished lower after volatile afternoon trading Wednesday as investors shift their focus to tomorrow’s Consumer Price Index (CPI) report. Market participants will parse through the report for any clues as to the future course of interest rate hikes by the Federal Reserve (Fed).
On the data front, market participants assessed September’s Producer Price Index (PPI) data. The PPI climbed more-than-expected to 0.4% month-over-month. Meanwhile, core PPI (which excludes the more volatile food and energy prices), remained unchanged from August’s revised 0.3% monthly gain. The headline PPI figure came in slightly higher than expected at 8.5%, while the headline core PPI print remain unchanged from August’s 7.2% year-over-year rise. This afternoon, the Fed released their meeting minutes from September. The key takeaway was Fed officials expect interest rates to remain elevated for some time. The minutes confirmed they will continue to hike rates until they see clear signs of slowing inflation.
Treasuries strengthened in the afternoon, with the yield on the benchmark 10-year note down four basis points (0.04%) to 3.94%, while the 30-year bond shed three basis points (0.03%) to 3.88% The yield on the two-year note dipped two basis points (0.02%) to 4.29%. In commodities, West Texas Intermediate (WTI) crude slipped 2.6% to $87.02/barrel amid a darkening economic outlook. However, increasingly tight supply conditions have kept a floor under prices. |
 Kenneth J. Gruneisen started out as a licensed stockbroker in August 1987, a couple of months prior to the historic stock market crash that took the Dow Jones Industrial Average down -22.6% in a single day. He has published daily fact-based fundamental and technical analysis on high-ranked stocks online for two decades. Through FACTBASEDINVESTING.COM, Kenneth provides educational articles, news, market commentary, and other information regarding proven investment systems that work in good times and bad.
Comments contained in the body of this report are technical opinions only and are not necessarily those of Gruneisen Growth Corp. The material herein has been obtained from sources believed to be reliable and accurate, however, its accuracy and completeness cannot be guaranteed. Our firm, employees, and customers may effect transactions, including transactions contrary to any recommendation herein, or have positions in the securities mentioned herein or options with respect thereto. Any recommendation contained in this report may not be suitable for all investors and it is not to be deemed an offer or solicitation on our part with respect to the purchase or sale of any securities. |
|
 |
Integrated Oil, Gold & Silver, and Biotech Indexes Rose
Kenneth J. Gruneisen - Passed the CAN SLIM® Master's Exam
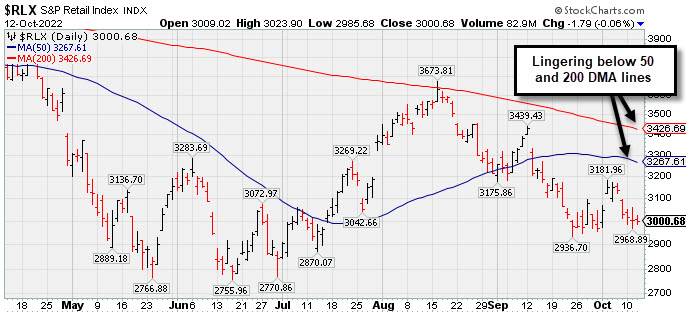
The Oil Services Index ($OSX -0.43%) edged lower while the Integrated Oil Index ($XOI +1.08%) and Gold & Silver Index ($XAU +0.74%) both notched gains. The Semiconductor Index ($SOX -0.90%) and Networking Index ($NWX -0.82%) both lost ground while the Biotech Index ($BTK +0.43%) eked out a modest gain. The Broker/Dealer Index ($XBD +0.21%) and Bank Index ($BKX -0.14%) were mixed and little changed and the Retail Index ($RLX -0.06%) finished flat.
PICTURED: The Retail Index ($RLX -0.06%) has been lingering below its 50-day and 200-day moving average (DMA) lines.
| Oil Services |
$OSX |
66.59 |
-0.29 |
-0.43% |
+26.31% |
| Integrated Oil |
$XOI |
1,659.73 |
+17.80 |
+1.08% |
+40.87% |
| Semiconductor |
$SOX |
2,198.60 |
-19.89 |
-0.90% |
-44.29% |
| Networking |
$NWX |
727.28 |
-6.03 |
-0.82% |
-25.11% |
| Broker/Dealer |
$XBD |
425.21 |
+0.91 |
+0.21% |
-12.66% |
| Retail |
$RLX |
3,000.68 |
-1.79 |
-0.06% |
-29.00% |
| Gold & Silver |
$XAU |
101.83 |
+0.75 |
+0.74% |
-23.12% |
| Bank |
$BKX |
94.66 |
-0.13 |
-0.14% |
-28.41% |
| Biotech |
$BTK |
4,566.60 |
+19.35 |
+0.43% |
-17.25% |
|
|
|
 |
Featured Stocks
Kenneth J. Gruneisen - Passed the CAN SLIM® Master's Exam
|
|
|
Color Codes Explained :
Y - Better candidates highlighted by our
staff of experts.
G - Previously featured
in past reports as yellow but may no longer be buyable under the
guidelines.
***Last / Change / Volume data in this table is the closing quote data***
|
|
|
THESE ARE NOT BUY RECOMMENDATIONS!
Comments contained in the body of this report are technical
opinions only. The material herein has been obtained
from sources believed to be reliable and accurate, however,
its accuracy and completeness cannot be guaranteed.
This site is not an investment advisor, hence it does
not endorse or recommend any securities or other investments.
Any recommendation contained in this report may not
be suitable for all investors and it is not to be deemed
an offer or solicitation on our part with respect to
the purchase or sale of any securities. All trademarks,
service marks and trade names appearing in this report
are the property of their respective owners, and are
likewise used for identification purposes only.
This report is a service available
only to active Paid Premium Members.
You may opt-out of receiving report notifications
at any time. Questions or comments may be submitted
by writing to Premium Membership Services 665 S.E. 10 Street, Suite 201 Deerfield Beach, FL 33441-5634 or by calling 1-800-965-8307
or 954-785-1121.
|
|
|