You are not logged in.
This means you
CAN ONLY VIEW reports that were published prior to Monday, March 17, 2025.
You
MUST UPGRADE YOUR MEMBERSHIP if you want to see any current reports.
AFTER MARKET UPDATE - TUESDAY, OCTOBER 11TH, 2022
Previous After Market Report Next After Market Report >>>
|
|
|
|
DOW |
+36.31 |
29,239.19 |
+0.12% |
|
Volume |
1,098,868,733 |
+31% |
|
Volume |
4,670,036,200 |
+18% |
|
NASDAQ |
-115.91 |
10,426.19 |
-1.10% |
|
Advancers |
1,274 |
42% |
|
Advancers |
1,674 |
39% |
|
S&P 500 |
-23.55 |
3,588.84 |
-0.65% |
|
Decliners |
1,758 |
58% |
|
Decliners |
2,621 |
61% |
|
Russell 2000 |
+1.00 |
1,692.92 |
+0.06% |
|
52 Wk Highs |
14 |
|
|
52 Wk Highs |
40 |
|
|
S&P 600 |
+2.77 |
1,096.38 |
+0.25% |
|
52 Wk Lows |
580 |
|
|
52 Wk Lows |
819 |
|
|
The market (M criteria) is still in a correction. Disciplined investors know to protect cash by avoiding any new buys until a new uptrend is confirmed with a proper follow-through day.
|
 |
Leadership was Thin as Major Average Ended Mixed
Kenneth J. Gruneisen - Passed the CAN SLIM® Master's Exam
The Dow added 36 points, while the Nasdaq Composite shed 1.1% amid weakness in Technology shares. The S&P 500 fell 0.7% with seven of 11 sectors in negative territory. The volume totals reported were higher than the prior session on the NYSE and on the Nasdaq exchange. Breadth was negative as decliners led advancers by a 3-2 margin on the NYSE and 5-3 on the Nasdaq exchange. There were 2 high-ranked companies from the Leaders List that hit new 52-week highs and were listed on the BreakOuts Page, versus the total of 5 on the prior session. New 52-week lows totals expanded again and solidly outnumbered shrinking new 52-week highs totals on both the NYSE and the Nasdaq exchange. The market is still in a correction (M criteria). Caution and patience remain paramount. Disciplined investors know to watch for a follow-through day of big gains to confirm a new uptrend.
Chart courtesy of www.stockcharts.com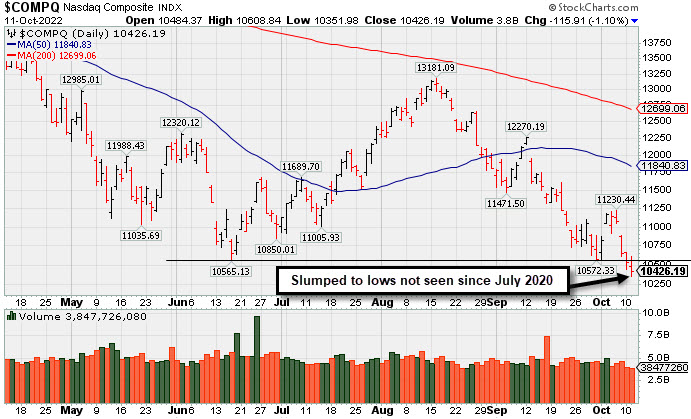 PICTURED: The Nasdaq Composite Index pulled back for a 5th consecutive loss, slumping to lows not seen since July 2020. A solid follow-through day of gains is needed as confirmation of a new market uptrend. Only the Dow Jones Industrial Average has avoided undercutting its Day 1 low.
U.S. equities finished mixed in volatile trading Tuesday as investors looked towards this week’s inflation data. Also weighing on sentiment was Bank of England Governor Andrew Bailey’s statement which warned investors to rebalance positions before the end of the emergency bond market support program on Friday.
In the central bank space, Cleveland Federal Reserve (Fed) President Loretta Mester warned a slowing economy and aggressive monetary policy may result in a recession. However, she reaffirmed the central bank is committed to curbing inflation, even if it causes short-term pain. On the data front, the New York Fed September Survey of Consumer Expectations reported consumers expected their spending to rise by 6% over the year, down sharply from the 7.8% rise predicted in August. The report also showed short-term inflation expectations were lowered, while long-term expectations were slightly raised.
Longer-dated Treasuries weakened, with the yield on the 10-year note adding six basis points (0.06%) to 3.94%, while the 30-year bond yield climbed seven basis points (0.07%) to 3.91%. Meanwhile, the more Fed-sensitive two-year note yield was little changed at 4.31%. In commodities, West Texas Intermediate (WTI) crude lost 2.6% to $88.53/barrel amid global demand concerns due to recession worries and a surge in COVID-19 cases in China. However, increasingly tight supply conditions have kept a floor under prices. The U.S. Dollar Index advanced 0.1% as investors flocked to the perceived safe-haven asset ahead of Thursday’s inflation data. |
 Kenneth J. Gruneisen started out as a licensed stockbroker in August 1987, a couple of months prior to the historic stock market crash that took the Dow Jones Industrial Average down -22.6% in a single day. He has published daily fact-based fundamental and technical analysis on high-ranked stocks online for two decades. Through FACTBASEDINVESTING.COM, Kenneth provides educational articles, news, market commentary, and other information regarding proven investment systems that work in good times and bad.
Comments contained in the body of this report are technical opinions only and are not necessarily those of Gruneisen Growth Corp. The material herein has been obtained from sources believed to be reliable and accurate, however, its accuracy and completeness cannot be guaranteed. Our firm, employees, and customers may effect transactions, including transactions contrary to any recommendation herein, or have positions in the securities mentioned herein or options with respect thereto. Any recommendation contained in this report may not be suitable for all investors and it is not to be deemed an offer or solicitation on our part with respect to the purchase or sale of any securities. |
|
 |
Financial, Retail, Tech, and Commodity-Linked Groups Fell
Kenneth J. Gruneisen - Passed the CAN SLIM® Master's Exam
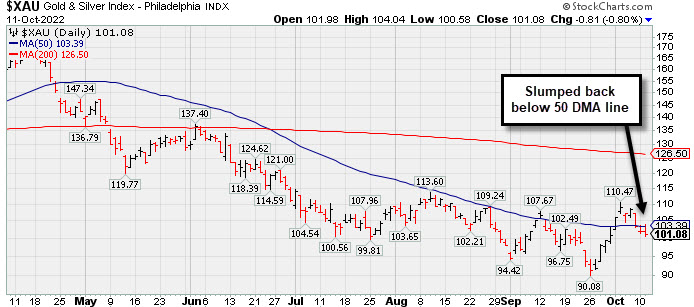
The Broker/Dealer Index ($XBD -2.01%) and Bank Index ($BKX -2.06%) both lost ground and the Retail Index ($RLX -0.46%) edged lower. Commodity-linked groups lost ground as the Oil Services Index ($OSX -1.23%) and Integrated Oil Index ($XOI -1.16%) both outpaced the Gold & Silver Index ($XAU -0.80%) to the downside. The Semiconductor Index ($SOX -2.50%) and Networking Index ($NWX -2.17%) both dragged the tech sector lower, meanwhile the Biotech Index ($BTK +0.21%) eked out a small gain.
PICTURED: The Gold & Silver Index ($XAU -0.80%) has slumped back below its 50-day moving average (DMA) line.
| Oil Services |
$OSX |
66.88 |
-0.83 |
-1.23% |
+26.86% |
| Integrated Oil |
$XOI |
1,641.93 |
-19.35 |
-1.16% |
+39.36% |
| Semiconductor |
$SOX |
2,218.49 |
-56.85 |
-2.50% |
-43.78% |
| Networking |
$NWX |
733.31 |
-16.29 |
-2.17% |
-24.48% |
| Broker/Dealer |
$XBD |
424.30 |
-8.69 |
-2.01% |
-12.85% |
| Retail |
$RLX |
3,002.47 |
-13.93 |
-0.46% |
-28.96% |
| Gold & Silver |
$XAU |
101.08 |
-0.81 |
-0.80% |
-23.68% |
| Bank |
$BKX |
94.79 |
-1.99 |
-2.06% |
-28.31% |
| Biotech |
$BTK |
4,547.25 |
+9.54 |
+0.21% |
-17.60% |
|
|
|
 |
Featured Stocks
Kenneth J. Gruneisen - Passed the CAN SLIM® Master's Exam
|
|
|
Color Codes Explained :
Y - Better candidates highlighted by our
staff of experts.
G - Previously featured
in past reports as yellow but may no longer be buyable under the
guidelines.
***Last / Change / Volume data in this table is the closing quote data***
|
|
|
THESE ARE NOT BUY RECOMMENDATIONS!
Comments contained in the body of this report are technical
opinions only. The material herein has been obtained
from sources believed to be reliable and accurate, however,
its accuracy and completeness cannot be guaranteed.
This site is not an investment advisor, hence it does
not endorse or recommend any securities or other investments.
Any recommendation contained in this report may not
be suitable for all investors and it is not to be deemed
an offer or solicitation on our part with respect to
the purchase or sale of any securities. All trademarks,
service marks and trade names appearing in this report
are the property of their respective owners, and are
likewise used for identification purposes only.
This report is a service available
only to active Paid Premium Members.
You may opt-out of receiving report notifications
at any time. Questions or comments may be submitted
by writing to Premium Membership Services 665 S.E. 10 Street, Suite 201 Deerfield Beach, FL 33441-5634 or by calling 1-800-965-8307
or 954-785-1121.
|
|
|