You are not logged in.
This means you
CAN ONLY VIEW reports that were published prior to Tuesday, April 8, 2025.
You
MUST UPGRADE YOUR MEMBERSHIP if you want to see any current reports.
AFTER MARKET UPDATE - MONDAY, OCTOBER 10TH, 2022
Previous After Market Report Next After Market Report >>>
|
|
|
|
DOW |
-93.91 |
29,202.88 |
-0.32% |
|
Volume |
841,142,222 |
-16% |
|
Volume |
3,958,093,700 |
-14% |
|
NASDAQ |
-110.30 |
10,542.10 |
-1.04% |
|
Advancers |
983 |
32% |
|
Advancers |
1,586 |
36% |
|
S&P 500 |
-27.27 |
3,612.39 |
-0.75% |
|
Decliners |
2,072 |
68% |
|
Decliners |
2,775 |
64% |
|
Russell 2000 |
-10.23 |
1,691.92 |
-0.60% |
|
52 Wk Highs |
25 |
|
|
52 Wk Highs |
56 |
|
|
S&P 600 |
-0.12 |
1,093.61 |
-0.01% |
|
52 Wk Lows |
426 |
|
|
52 Wk Lows |
657 |
|
|
The market (M criteria) is still in a correction. Disciplined investors know to protect cash by avoiding any new buys until a new uptrend is confirmed with a proper follow-through day.
|
 |
Major Averages Slump Again as Rally Attempt Flops
Kenneth J. Gruneisen - Passed the CAN SLIM® Master's Exam
The Dow shed 93 points, while the Nasdaq Composite lost 1% after touching its lowest level since September 2020 earlier in the session. The S&P 500 slid 0.8% amid weakness in Energy and Information Technology shares. The volume totals reported were lighter than the prior session on the NYSE and on the Nasdaq exchange, indicative of less selling pressure from the institutional crowd. Breadth was negative as decliners led advancers by more than a 2-1 margin on the NYSE and 7-4 on the Nasdaq exchange. There were 5 high-ranked companies from the Leaders List that hit new 52-week highs and were listed on the BreakOuts Page, versus the total of 4 on the prior session. New 52-week lows totals expanded again and solidly outnumbered new 52-week highs totals on both the NYSE and the Nasdaq exchange. The market is still in a correction (M criteria). Caution and patience remain paramount. Disciplined investors know to watch for a follow-through day of big gains to confirm a new uptrend.
Chart courtesy of www.stockcharts.com%20on%20Tuesday.%20Yesterday,%20the%20broad%20benchmark%20eclipsed%20the%204,300%20level%20for%20the%20first%20time%20since%20late%20April.%20The%20Nasdaq%20Composite%20fell%201.3%%20amid%20weakness%20in%20mega-cap%20tech%20shares.%20The%20volume%20totals%20reported%20were%20mixed,%20lighter%20than%20the%20prior%20session%20on%20the%20NYSE%20and%20higher%20on%20the%20Nasdaq%20exchange.%20Decliners%20led%20advancers%20by%20a%204-1%20margin%20on%20the%20NYSE%20ad%20by%20a%203-1%20margin%20on%20the%20Nasdaq%20exchange.%20There%20were%2017%20high-ranked%20companies%20from%20the%20Leaders%20List%20that%20hit%20new%2052-week%20highs%20and%20were%20listed%20on%20the%20BreakOuts%20Page,%20down%20from%20the%20total%20of%2045%20on%20the%20prior%20session.%20New%2052-week%20highs%20outnumbered%20new%2052-week%20lows%20on%20the%20NYSE,%20but%20new%20lows%20outnumbered%20new%20highs%20on%20the%20Nasdaq%20exchange.%20The%20market%20is%20in%20a%20confirmed%20uptrend%20(M%20criteria).%20Any%20sustainable%20rally%20requires%20a%20healthy%20crop%20of%20leading%20stocks%20hitting%20new%20highs,%20so%20the%20recent%20improvement%20in%20leadership%20was%20a%20reassuring%20sign.) 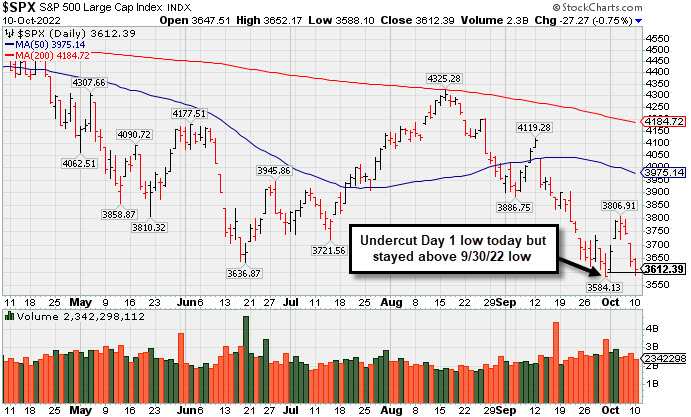 PICTURED: The S&P 500 Index pulled back for a 4th consecutive loss, undercutting the rally attempt's Day 1 low, but staying above the 9/30/22 low. A solid follow-through day of gains is needed as confirmation of a new market uptrend. Only the Dow Jones Industrial Average has avoided undercutting its Day 1 low.
U.S. equities finished lower, though pared back losses, as a perceived risk-off mood took hold. Investors digested Friday’s jobs report and commentary from Federal Reserve (Fed) officials. Speaking at a conference this morning, Chicago Fed President Charles Evans said he believes the benchmark federal-funds rate will need to rise and remain at a high level for some time. He also said the high rate, coupled with the central bank’s quantitative tightening program, may restrict growth and soften the jobs market. Meanwhile, Fed Vice Chair Lael Brainard restated the need for the Fed to make policy decisions based on data.
Semiconductor stocks were the main laggards today following news the U.S. is planning to limit their exports to China. The domestic bond market was closed today due to the Columbus Day holiday. Elsewhere, the U.S. Dollar Index added 0.3% amid Fed jitters and reports Russia carried out air strikes in Kyiv. In commodities, West Texas Intermediate (WTI) crude slid 1.8% to $90.86/barrel despite last week’s news that the Organization of Petroleum Exporting Countries and their allies (OPEC+) will cut production by two million barrels per day. Oil prices have whipsawed in recent weeks as market participants weighed tight global supply conditions against growing recessionary worries.
|
 Kenneth J. Gruneisen started out as a licensed stockbroker in August 1987, a couple of months prior to the historic stock market crash that took the Dow Jones Industrial Average down -22.6% in a single day. He has published daily fact-based fundamental and technical analysis on high-ranked stocks online for two decades. Through FACTBASEDINVESTING.COM, Kenneth provides educational articles, news, market commentary, and other information regarding proven investment systems that work in good times and bad.
Comments contained in the body of this report are technical opinions only and are not necessarily those of Gruneisen Growth Corp. The material herein has been obtained from sources believed to be reliable and accurate, however, its accuracy and completeness cannot be guaranteed. Our firm, employees, and customers may effect transactions, including transactions contrary to any recommendation herein, or have positions in the securities mentioned herein or options with respect thereto. Any recommendation contained in this report may not be suitable for all investors and it is not to be deemed an offer or solicitation on our part with respect to the purchase or sale of any securities. |
|
 |
Financial, Retail, Tech, and Commodity-Linked Groups Fell
Kenneth J. Gruneisen - Passed the CAN SLIM® Master's Exam
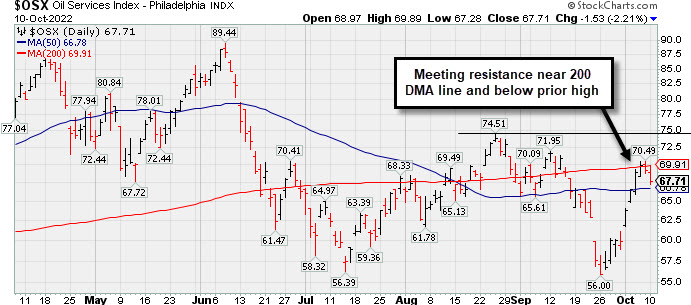
The Broker/Dealer Index ($XBD -0.49%), Bank Index ($BKX -0.79%), and Retail Index ($RLX -0.48%) each edged lower and weighed on the major averages. The Semiconductor Index ($SOX -3.45%) led the tech sector lower while the Networking Index ($NWX -1.92%) and Biotech Index ($BTK -1.22%) also slumped. Commodity-linked groups had a negative bias as the Oil Services Index ($OSX -2.21%) and Integrated Oil Index ($XOI -1.98%) both outpaced the Gold & Silver Index ($XAU -1.37%) to the downside.
PICTURED: The Oil Services Index ($OSX -2.21%) is meeting resistance near the 200-day moving average (DMA) line and below the August high.
| Oil Services |
$OSX |
67.71 |
-1.53 |
-2.21% |
+28.44% |
| Integrated Oil |
$XOI |
1,661.28 |
-33.62 |
-1.98% |
+41.00% |
| Semiconductor |
$SOX |
2,275.34 |
-81.40 |
-3.45% |
-42.34% |
| Networking |
$NWX |
749.60 |
-14.70 |
-1.92% |
-22.81% |
| Broker/Dealer |
$XBD |
433.00 |
-2.13 |
-0.49% |
-11.06% |
| Retail |
$RLX |
3,016.40 |
-14.63 |
-0.48% |
-28.63% |
| Gold & Silver |
$XAU |
101.89 |
-1.42 |
-1.37% |
-23.07% |
| Bank |
$BKX |
96.79 |
-0.77 |
-0.79% |
-26.80% |
| Biotech |
$BTK |
4,537.71 |
-55.88 |
-1.22% |
-17.77% |
|
|
|
 |
Featured Stocks
Kenneth J. Gruneisen - Passed the CAN SLIM® Master's Exam
|
|
|
Color Codes Explained :
Y - Better candidates highlighted by our
staff of experts.
G - Previously featured
in past reports as yellow but may no longer be buyable under the
guidelines.
***Last / Change / Volume data in this table is the closing quote data***
Symbol/Exchange
Company Name
Industry Group |
PRICE |
CHANGE
(%Change) |
Day High |
Volume
(% DAV)
(% 50 day avg vol) |
52 Wk Hi
% From Hi |
Featured
Date |
Price
Featured |
Pivot Featured |
|
Max Buy |
 CI
-
NYSE
CI
-
NYSE
Cigna Corp
Medical-Managed Care
|
$285.73
|
-2.65
-0.92% |
$289.68
|
2,845,241
145.69% of 50 DAV
50 DAV is 1,953,000
|
$296.29
-3.56%
|
7/7/2022
|
$276.55
|
PP = $273.68
|
|
MB = $287.36
|
 Most Recent Note - 10/10/2022 5:24:10 PM
G - Pulled back today for a 3rd consecutive loss with above average volume, testing near its 50 DMA line ($286.09). It has not formed a new base of sufficient length. Fundamental concerns also remain after the Jun '22 quarter rose +19% on +5% sales revenues versus the year ago period, breaking a streak of 3 quarterly earnings increases above the +25% minimum guideline (C criteria).
>>> FEATURED STOCK ARTICLE : No Resistance Remains Due to Overhead Supply - 10/4/2022 |
View all notes |
Set NEW NOTE alert |
Company Profile |
SEC
News |
Chart |
Request a new note
C
A
S
I |
ESQ
-
NASDAQ
Esquire Financial Hldgs
Finance-Commercial Loans
|
$37.63
|
+0.44
1.18% |
$38.15
|
16,066
64.26% of 50 DAV
50 DAV is 25,000
|
$41.68
-9.72%
|
7/26/2022
|
$37.74
|
PP = $39.19
|
|
MB = $41.15
|
Most Recent Note - 10/10/2022 5:25:37 PM
G - Still lingering below its 50 DMA line ($38.19) and the recent slump below the pivot point raised concerns. A rebound above the 50 DMA line is needed for its outlook to improve. Faces some near-term resistance due to overhead supply up to the $41 level. The market is in a correction (M criteria) and disciplined investors know to avoid new buying efforts until a new rally confirmed with a follow-through day.
>>> FEATURED STOCK ARTICLE : Rebound Above 50-Day Moving Average Needed for Outlook to Improve - 10/7/2022 |
View all notes |
Set NEW NOTE alert |
Company Profile |
SEC
News |
Chart |
Request a new note
C
A
S
I |
CCRN
-
NASDAQ
Cross Country Healthcare
DIVERSIFIED SERVICES - Staffing and Outsourcing Service
|
$32.26
|
+0.68
2.15% |
$32.64
|
1,024,166
111.81% of 50 DAV
50 DAV is 916,000
|
$34.98
-7.78%
|
9/9/2022
|
$27.32
|
PP = $30.61
|
|
MB = $32.14
|
Most Recent Note - 10/10/2022 5:22:55 PM
G - Managed a "positive reversal" today to post a gain with near average volume, and its color code is changed to green after closing above its "max buy" level. Prior highs in the $30.50 area define initial support to watch above its 50 DMA line ($26.61). The market is in a correction (M criteria) and disciplined investors know to avoid new buying efforts until a new rally confirmed with a follow-through day.
>>> FEATURED STOCK ARTICLE : Powerful Breakout While Market Rally Still Needs Confirmation - 10/3/2022 |
View all notes |
Set NEW NOTE alert |
Company Profile |
SEC
News |
Chart |
Request a new note
C
A
S
I |
|
|
|
THESE ARE NOT BUY RECOMMENDATIONS!
Comments contained in the body of this report are technical
opinions only. The material herein has been obtained
from sources believed to be reliable and accurate, however,
its accuracy and completeness cannot be guaranteed.
This site is not an investment advisor, hence it does
not endorse or recommend any securities or other investments.
Any recommendation contained in this report may not
be suitable for all investors and it is not to be deemed
an offer or solicitation on our part with respect to
the purchase or sale of any securities. All trademarks,
service marks and trade names appearing in this report
are the property of their respective owners, and are
likewise used for identification purposes only.
This report is a service available
only to active Paid Premium Members.
You may opt-out of receiving report notifications
at any time. Questions or comments may be submitted
by writing to Premium Membership Services 665 S.E. 10 Street, Suite 201 Deerfield Beach, FL 33441-5634 or by calling 1-800-965-8307
or 954-785-1121.
|
|
|