You are not logged in.
This means you
CAN ONLY VIEW reports that were published prior to Saturday, March 8, 2025.
You
MUST UPGRADE YOUR MEMBERSHIP if you want to see any current reports.
AFTER MARKET UPDATE - THURSDAY, OCTOBER 6TH, 2022
Previous After Market Report Next After Market Report >>>
|
|
|
|
DOW |
-346.93 |
29,926.94 |
-1.15% |
|
Volume |
946,881,510 |
+2% |
|
Volume |
4,402,645,200 |
+8% |
|
NASDAQ |
-75.33 |
11,073.31 |
-0.68% |
|
Advancers |
933 |
31% |
|
Advancers |
1,719 |
41% |
|
S&P 500 |
-38.76 |
3,744.52 |
-1.02% |
|
Decliners |
2,055 |
69% |
|
Decliners |
2,521 |
59% |
|
Russell 2000 |
-10.18 |
1,752.51 |
-0.58% |
|
52 Wk Highs |
28 |
|
|
52 Wk Highs |
42 |
|
|
S&P 600 |
-6.50 |
1,120.96 |
-0.58% |
|
52 Wk Lows |
163 |
|
|
52 Wk Lows |
167 |
|
|
The market (M criteria) is still in a correction. Disciplined investors know to protect cash by avoiding any new buys until a new uptrend is confirmed with a proper follow-through day.
|
 |
Indices Pulled Back With Higher Volume on Day 4 of Rally Attempt
Kenneth J. Gruneisen - Passed the CAN SLIM® Master's Exam
The Dow lost 346 points, while the Nasdaq Composite ended 0.7% lower. The S&P 500 shed 1%. The volume totals reported were lighter than the prior session on the NYSE and on the Nasdaq exchange. Breadth was negative as decliners led advancers by more than a 2-1 margin on the NYSE and nearly 2-1 on the Nasdaq exchange. There were 9 high-ranked companies from the Leaders List that hit new 52-week highs and were listed on the BreakOuts Page, matching the total of 9 on the prior session. New 52-week lows totals outnumbered shrinking new 52-week highs totals on both the NYSE and the Nasdaq exchange. The major indices have paused after enjoying 2 consecutive days of big gains, and the market is still in a correction (M criteria). Caution and patience remain paramount because some of the biggest up days occur during ongoing corrections. Disciplined investors know to watch for a follow-through day of big gains to confirm a new uptrend on Day 4-7 of a new rally.
Chart courtesy of www.stockcharts.com%20on%20Tuesday.%20Yesterday,%20the%20broad%20benchmark%20eclipsed%20the%204,300%20level%20for%20the%20first%20time%20since%20late%20April.%20The%20Nasdaq%20Composite%20fell%201.3%%20amid%20weakness%20in%20mega-cap%20tech%20shares.%20The%20volume%20totals%20reported%20were%20mixed,%20lighter%20than%20the%20prior%20session%20on%20the%20NYSE%20and%20higher%20on%20the%20Nasdaq%20exchange.%20Decliners%20led%20advancers%20by%20a%204-1%20margin%20on%20the%20NYSE%20ad%20by%20a%203-1%20margin%20on%20the%20Nasdaq%20exchange.%20There%20were%2017%20high-ranked%20companies%20from%20the%20Leaders%20List%20that%20hit%20new%2052-week%20highs%20and%20were%20listed%20on%20the%20BreakOuts%20Page,%20down%20from%20the%20total%20of%2045%20on%20the%20prior%20session.%20New%2052-week%20highs%20outnumbered%20new%2052-week%20lows%20on%20the%20NYSE,%20but%20new%20lows%20outnumbered%20new%20highs%20on%20the%20Nasdaq%20exchange.%20The%20market%20is%20in%20a%20confirmed%20uptrend%20(M%20criteria).%20Any%20sustainable%20rally%20requires%20a%20healthy%20crop%20of%20leading%20stocks%20hitting%20new%20highs,%20so%20the%20recent%20improvement%20in%20leadership%20was%20a%20reassuring%20sign.) 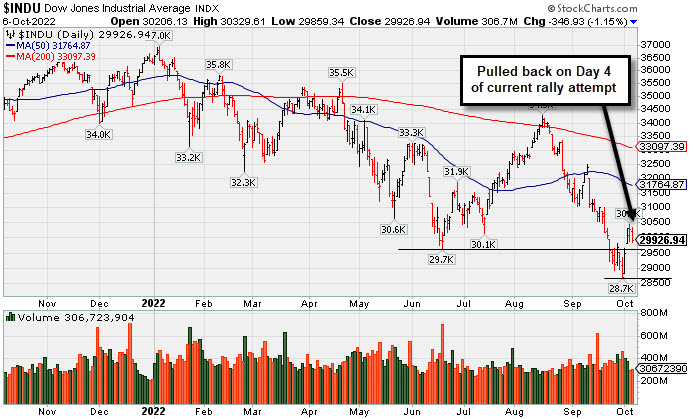 PICTURED: The Dow Jones Industrial Average pulled back on Day 4 of the new rally attempt. The rally effort remains valid unless the Day 1 low is violated. Meanwhile, a solid follow-through day of gains is needed as confirmation of a new market uptrend.
U.S. equities finished lower Thursday as investors digested today’s economic data and commentary from Federal Reserve (Fed) officials. Market participants are also looking towards the “First Friday” jobs report due tomorrow. Minneapolis Fed President Neel Kashkari and Cleveland Fed President Loretta Mester reaffirmed the central bank’s commitment to bringing down inflation at their speaking engagements this morning. Ten of 11 S&P 500 sectors ended in negative territory, with Energy bucking the downtrend.
On the data front, initial jobless claims for the week ended October 1 came in higher-than-expected at 219,000 claims, up from the prior week’s downwardly revised 190,000 print. The jump in claims highlights concerns over a darkening economic outlook and shows the labor market is beginning to pull back, but the number of claims is still hovering near historical lows.
Treasuries weakened amid a hawkish Fed and growing inflationary worries, with the yield on the benchmark 10-year note adding eight basis points (0.08%) to 3.82%, while the 30-year bond yield climbed three basis points (0.03%) to 3.78%. The yield on the more Fed sensitive two-year note advanced 10 basis points (0.10%) to 4.24%. In commodities, West Texas Intermediate (WTI) crude gained 1.4% to $89.02/barrel following yesterday’s production cut announcement from the Organization of Petroleum Exporting Countries and their allies (OPEC+). The U.S. dollar index increased 0.9% as investors await tomorrow’s jobs data for any indication of the future course of Fed monetary policy. |
 Kenneth J. Gruneisen started out as a licensed stockbroker in August 1987, a couple of months prior to the historic stock market crash that took the Dow Jones Industrial Average down -22.6% in a single day. He has published daily fact-based fundamental and technical analysis on high-ranked stocks online for two decades. Through FACTBASEDINVESTING.COM, Kenneth provides educational articles, news, market commentary, and other information regarding proven investment systems that work in good times and bad.
Comments contained in the body of this report are technical opinions only and are not necessarily those of Gruneisen Growth Corp. The material herein has been obtained from sources believed to be reliable and accurate, however, its accuracy and completeness cannot be guaranteed. Our firm, employees, and customers may effect transactions, including transactions contrary to any recommendation herein, or have positions in the securities mentioned herein or options with respect thereto. Any recommendation contained in this report may not be suitable for all investors and it is not to be deemed an offer or solicitation on our part with respect to the purchase or sale of any securities. |
|
 |
Commodity-Linked Groups Posted Gains
Kenneth J. Gruneisen - Passed the CAN SLIM® Master's Exam
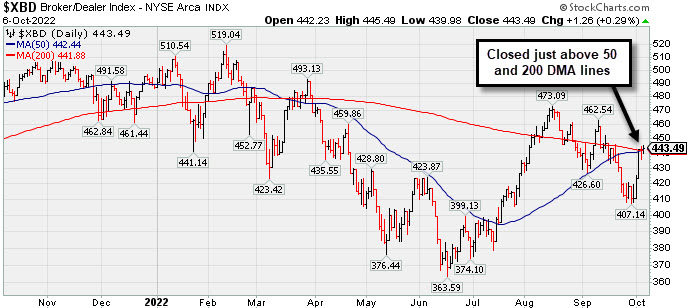
The Bank Index ($BKX -1.88%) suffered a loss and the Retail Index ($RLX -0.41%) edged lower while the Broker/Dealer Index ($XBD +0.29%) edged higher. Commodity-linked groups had a positive bias as the Gold & Silver Index ($XAU +1.02%), Oil Services Index ($OSX +1.35%), and Integrated Oil Index ($XOI +1.26%) posted unanimous gains. The Semiconductor Index ($SOX -0.59%) edged lower and the Networking Index ($NWX -0.18%) inched lower while the Biotech Index ($BTK -0.01%) finished flat.
PICTURED: The Broker/Dealer Index ($XBD +0.29%) posted a small gain and closed just above its converging 50-day and 200-day moving average (DMA) lines.
| Oil Services |
$OSX |
69.92 |
+0.93 |
+1.35% |
+32.62% |
| Integrated Oil |
$XOI |
1,707.17 |
+21.30 |
+1.26% |
+44.90% |
| Semiconductor |
$SOX |
2,508.84 |
-14.77 |
-0.59% |
-36.42% |
| Networking |
$NWX |
792.50 |
-1.43 |
-0.18% |
-18.39% |
| Broker/Dealer |
$XBD |
443.49 |
+1.26 |
+0.29% |
-8.91% |
| Retail |
$RLX |
3,137.54 |
-12.79 |
-0.41% |
-25.76% |
| Gold & Silver |
$XAU |
108.38 |
+1.09 |
+1.02% |
-18.17% |
| Bank |
$BKX |
99.82 |
-1.91 |
-1.88% |
-24.50% |
| Biotech |
$BTK |
4,737.04 |
-0.64 |
-0.01% |
-14.16% |
|
|
|
 |
Featured Stocks
Kenneth J. Gruneisen - Passed the CAN SLIM® Master's Exam
|
|
|
Color Codes Explained :
Y - Better candidates highlighted by our
staff of experts.
G - Previously featured
in past reports as yellow but may no longer be buyable under the
guidelines.
***Last / Change / Volume data in this table is the closing quote data***
|
|
|
THESE ARE NOT BUY RECOMMENDATIONS!
Comments contained in the body of this report are technical
opinions only. The material herein has been obtained
from sources believed to be reliable and accurate, however,
its accuracy and completeness cannot be guaranteed.
This site is not an investment advisor, hence it does
not endorse or recommend any securities or other investments.
Any recommendation contained in this report may not
be suitable for all investors and it is not to be deemed
an offer or solicitation on our part with respect to
the purchase or sale of any securities. All trademarks,
service marks and trade names appearing in this report
are the property of their respective owners, and are
likewise used for identification purposes only.
This report is a service available
only to active Paid Premium Members.
You may opt-out of receiving report notifications
at any time. Questions or comments may be submitted
by writing to Premium Membership Services 665 S.E. 10 Street, Suite 201 Deerfield Beach, FL 33441-5634 or by calling 1-800-965-8307
or 954-785-1121.
|
|
|