You are not logged in.
This means you
CAN ONLY VIEW reports that were published prior to Friday, April 25, 2025.
You
MUST UPGRADE YOUR MEMBERSHIP if you want to see any current reports.
AFTER MARKET UPDATE - THURSDAY, JUNE 13TH, 2024
Previous After Market Report Next After Market Report >>>
|
|
|
|
DOW |
-65.11 |
38,647.10 |
-0.17% |
|
Volume |
840,392,588 |
-9% |
|
Volume |
4,940,341,300 |
-12% |
|
NASDAQ |
+59.12 |
17,667.56 |
+0.34% |
|
Advancers |
1,006 |
37% |
|
Advancers |
1,479 |
35% |
|
S&P 500 |
+12.71 |
5,433.74 |
+0.23% |
|
Decliners |
1,733 |
63% |
|
Decliners |
2,781 |
65% |
|
Russell 2000 |
-18.19 |
2,038.91 |
-0.88% |
|
52 Wk Highs |
66 |
|
|
52 Wk Highs |
116 |
|
|
S&P 600 |
-13.29 |
1,292.90 |
-1.02% |
|
52 Wk Lows |
62 |
|
|
52 Wk Lows |
151 |
|
|
 |
Indices Were Mixed as Big Tech Gains Helped Nasdaq Lead Peers
Kenneth J. Gruneisen - Passed the CAN SLIM® Master's Exam
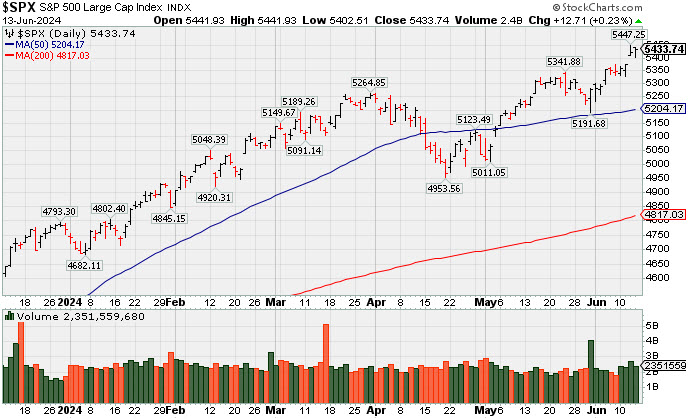
The S&P 500 Index (+0.2%) and Nasdaq Composite Index (+0.3%) both hit new record closing highs, meanwhile the Dow Jones Industrial Average fell -0.2% and the Russell 2000 Index was -0.9% lower. Volume totals reported were lighter than the prior session on the NYSE and on the Nasdaq exchange. Market breadth was negative as decliners led advancers by more than a 3-2 margin on the NYSE and by more than a 5-3 margin on the Nasdaq exchange. Leadership thinned as there were 24 high-ranked companies from the Leaders List that hit new 52-week highs and were listed on the BreakOuts Page, versus the total of 66 on the prior session. New 52-week highs totals contracted yet still outnumbered new 52-week lows on the NYSE, however, new lows outnumbered new highs on the Nasdaq exchange. The major indices are in a confirmed uptrend (M criteria) that recently endured some pressure. It was encouraging to see recent improvement in the new highs totals with the market showing some broad-based strength and resilience. Remember that any uptrend requires healthy leadership.
PICTURED: The S&P 500 Index is perched at its all-time high following 4 consecutive gains.
Thursday's economi news included a cooler-than-expected May Producer Price Index and a weaker-than-expected initial jobless claims report. A fresh $22 billion 30-yr bond sale was met with solid demand as the 10-yr note yield fell six basis points to 4.24% and the 2-yr note yield declined six basis points to 4.69%.
Broadcom (AVGO +12.3%) was a standout gainer following better-than-expected earnings, outlook, and as it also announced a 10-for-1 stock split. NVIDIA (NVDA +3.5%) also logged a solid gain. Super Micro Computer (SMCI +12.4%) posted a big gain. All of the above boosted the information technology sector (+1.4%), the top performer among the 11 S&P sectors. The rate-sensitive real estate sector (+0.5%) showed the next largest gain, benefitting from the drop in market rates.
|
 Kenneth J. Gruneisen started out as a licensed stockbroker in August 1987, a couple of months prior to the historic stock market crash that took the Dow Jones Industrial Average down -22.6% in a single day. He has published daily fact-based fundamental and technical analysis on high-ranked stocks online for two decades. Through FACTBASEDINVESTING.COM, Kenneth provides educational articles, news, market commentary, and other information regarding proven investment systems that work in good times and bad.
Comments contained in the body of this report are technical opinions only and are not necessarily those of Gruneisen Growth Corp. The material herein has been obtained from sources believed to be reliable and accurate, however, its accuracy and completeness cannot be guaranteed. Our firm, employees, and customers may effect transactions, including transactions contrary to any recommendation herein, or have positions in the securities mentioned herein or options with respect thereto. Any recommendation contained in this report may not be suitable for all investors and it is not to be deemed an offer or solicitation on our part with respect to the purchase or sale of any securities. |
|
 |
Financial, Retail, and Commodity-Linked Groups Fell
Kenneth J. Gruneisen - Passed the CAN SLIM® Master's Exam
The Broker/Dealer Index ($XBD -1.16%) and the Bank Index ($BKX -0.53%) both lost ground along with the Retail Index ($RLX -0.83%). The tech sector was led by the Semiconductor Index ($SOX +1.48%) while the Networking Index ($NWX +0.14%) inched higher but the Biotech Index ($BTK -0.61%) lost ground. Commodity-linked groups had a negative bias as the Gold & Silver Index ($XAU -2.58%) and the Oil Services Index ($OSX -2.13%) both outpaced the Integrated Oil Index ($XOI -0.86%) to the downside.
![]() PICTURED: The Broker/Dealer Index ($XBD -1.16%) is consolidating above its 50-day moving average (DMA) line.
| Oil Services |
$OSX |
81.63 |
-1.77 |
-2.13% |
-2.69% |
| Integrated Oil |
$XOI |
1,977.36 |
-17.09 |
-0.86% |
+6.17% |
| Semiconductor |
$SOX |
5,602.42 |
+81.55 |
+1.48% |
+34.17% |
| Networking |
$NWX |
816.98 |
+1.16 |
+0.14% |
-1.90% |
| Broker/Dealer |
$XBD |
620.22 |
-7.26 |
-1.16% |
+11.29% |
| Retail |
$RLX |
4,440.20 |
-37.31 |
-0.83% |
+14.18% |
| Gold & Silver |
$XAU |
134.11 |
-3.56 |
-2.58% |
+6.70% |
| Bank |
$BKX |
100.95 |
-0.54 |
-0.53% |
+5.13% |
| Biotech |
$BTK |
5,253.78 |
-32.00 |
-0.61% |
-3.05% |
|
|
|
 |
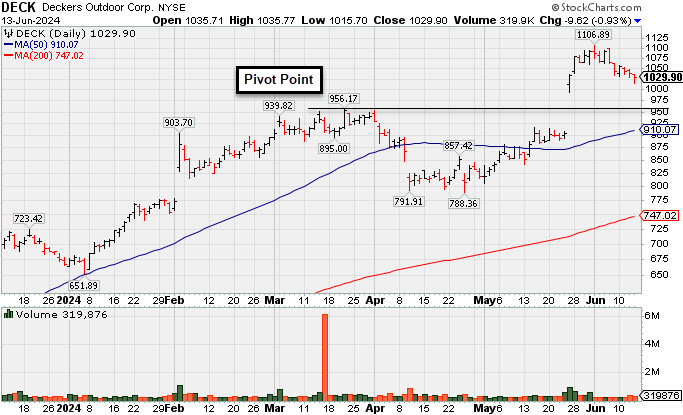
Deckers Consolidating Near High
Kenneth J. Gruneisen - Passed the CAN SLIM® Master's Exam
Deckers Outdoor Corp (DECK -$9.36 or -0.90% to $1,030.16) pulled back for a 3rd consecutive loss today with below-average volume. It is consolidating well above the prior high ($956) which defines initial support to watch on pullbacks.
DECK finished strong after was highlighted in yellow with pivot point cited based on its 3/21/24 high plus 10 cents in the 5/24/24 mid-day report (read here). Its "breakaway gap" was backed by +101% above average volume as it hit a new all-time high triggering a technical buy signal. It was shown in greater detail that evening with an annotated graph under the headline, "Big 'Breakaway Gap' for Deckers Outdoor".
DECK has a 99 Earnings Per Share Rating. Bullish action came after it reported very strong Mar '24 quarterly earnings +43% on +21% sales revenues versus the year ago period. Prior quarterly earnings comparisons were also well above the +25% minimum guideline (C criteria). Annual earnings growth has been strong and steady.
The number of top-rated funds owning its shares rose from 1,411 in Jun '23 to 1,880 in Mar '24, a reassuring sign concerning the investment system's I criteria. Its current Up/Down Volume Ratio of 1.2 is an unbiased indication its shares have been under distributional pressure over the past 50 days.
It has a small supply of only 25.4 million shares outstanding (S criteria), which makes it prone to be a volatile stock in the event of institutional accumulation or distribution. The small supply is favorable, provided proper discipline is used.
Symbol/Exchange
Company Name
Industry Group | PRICE | CHANGE
(%Change) | Day High | Volume
(% DAV)
(% 50 day avg vol) | 52 Wk Hi
% From Hi | Featured
Date | Price
Featured | Pivot Featured | | Max Buy |  TDG - NYSE TDG - NYSE
TransDigm Group
Aerospace/Defense | $1,323.65 | +1.52
0.11% | $1,325.46 | 165,725
78.92% of 50 DAV
50 DAV is 210,000 | $1,369.58
-3.35%
| 4/12/2024 | $1,224.21 | PP = $1,246.32 | | MB = $1,308.64 | Most Recent Note - 6/12/2024 5:29:08 PM
G - Color code is changed to green after rising back above its "max buy" level. Its 50 DMA line ($1,278) defines near-term support to watch. Fundamentals remain strong. See the latest FSU analysis for more details and a new annotated graph.
>>> FEATURED STOCK ARTICLE : Transdigm Consolidating Above 50-Day Moving Average - 6/12/2024 | View all notes | Set NEW NOTE alert | Company Profile | SEC News | Chart | Request a new note C A S I | USLM - NASDAQ
U.S. Lime & Minerals
Bldg-Cement/Concrt/Ag | $336.51 | -2.24
-0.66% | $340.48 | 9,435
37.74% of 50 DAV
50 DAV is 25,000 | $378.78
-11.16%
| 2/9/2024 | $254.68 | PP = $265.09 | | MB = $278.34 | Most Recent Note - 6/12/2024 5:31:04 PM
G - Gapped up today for a solid gain with average volume, finding prompt support near its 50 DMA line ($329). It has not formed a sound base. Fundamentals remain strong.
>>> FEATURED STOCK ARTICLE : Streak of Losses Testing 50-Day Moving Average Line - 6/6/2024 | View all notes | Set NEW NOTE alert | Company Profile | SEC News | Chart | Request a new note C A S I | CLS - NYSE
Celestica
Elec-Contract Mfg | $56.77 | +1.88
3.43% | $56.90 | 1,786,715
73.95% of 50 DAV
50 DAV is 2,416,000 | $61.06
-7.03%
| 5/15/2024 | $51.52 | PP = $51.22 | | MB = $53.78 |  Most Recent Note - 6/13/2024 4:01:23 PM Most Recent Note - 6/13/2024 4:01:23 PM
G - Posted a 2nd consecutive gain today with lighter than average volume. Prior highs in the $51 area define initial support to watch above its 50 DMA line ($49.46).
>>> FEATURED STOCK ARTICLE : Steady Pullback to Below "Max Buy" Level Following Rally - 6/4/2024 | View all notes | Set NEW NOTE alert | Company Profile | SEC News | Chart | Request a new note C A S I | DECK - NYSE
Deckers Outdoor
Apparel-Shoes and Rel Mfg | $1,030.16 | -9.36
-0.90% | $1,035.77 | 319,969
88.88% of 50 DAV
50 DAV is 360,000 | $1,106.89
-6.93%
| 5/24/2024 | $1,010.60 | PP = $956.27 | | MB = $1,004.08 | Most Recent Note - 6/13/2024 4:36:56 PM
G - Consolidating near its all-time high, extended from the prior base. Prior highs in the $956 area define initial support to watch on pullbacks.
>>> FEATURED STOCK ARTICLE : Deckers Consolidating Near High - 6/13/2024 | View all notes | Set NEW NOTE alert | Company Profile | SEC News | Chart | Request a new note C A S I | ELF - NYSE
e.l.f. Beauty
Cosmetics/Personal Care | $200.44 | +3.12
1.58% | $202.29 | 927,889
54.55% of 50 DAV
50 DAV is 1,701,000 | $221.83
-9.64%
| 5/24/2024 | $193.79 | PP = $182.73 | | MB = $191.87 | Most Recent Note - 6/12/2024 5:32:54 PM
G - Color code is changed to green after a 3rd consecutive solid gain today with average volume, rebounding above its "max buy" level near prior highs. Its 50 DMA line ($171) defines important near-term support to watch.
>>> FEATURED STOCK ARTICLE : Down on Lighter Volume After Breakout From "Double Bottom" Base - 5/29/2024 | View all notes | Set NEW NOTE alert | Company Profile | SEC News | Chart | Request a new note C A S I | Symbol/Exchange
Company Name
Industry Group | PRICE | CHANGE
(%Change) | Day High | Volume
(% DAV)
(% 50 day avg vol) | 52 Wk Hi
% From Hi | Featured
Date | Price
Featured | Pivot Featured | | Max Buy | PDD - NASDAQ
PDD Holdings ADR
Retail-Internet | $151.07 | +0.07
0.05% | $152.90 | 4,550,853
48.89% of 50 DAV
50 DAV is 9,309,000 | $164.69
-8.27%
| 5/24/2024 | $161.85 | PP = $153.09 | | MB = $160.74 | Most Recent Note - 6/11/2024 5:42:50 PM
Y - Pulled back today with near average volume following 3 gains with below average volume. Raised concerns recently as it negated the breakout after clearing a 20-week base. Disciplined investors avoid big losses by selling any stock that falls more than 7-8% below their purchase price.
>>> FEATURED STOCK ARTICLE : Pulled Back Below Prior Highs Raising Concerns - 5/28/2024 | View all notes | Set NEW NOTE alert | Company Profile | SEC News | Chart | Request a new note C A S I | CRWD - NASDAQ
CrowdStrike Holdings
Computer Sftwr-Security | $382.81 | -4.56
-1.18% | $389.89 | 3,956,836
114.59% of 50 DAV
50 DAV is 3,453,000 | $390.71
-2.02%
| 5/28/2024 | $351.47 | PP = $365.10 | | MB = $383.36 | Most Recent Note - 6/13/2024 4:35:53 PM
Y - Color code is changed to yellow after pulling back just below its "max buy" level today with near average volume following 4 consecutive volume-driven gains for new all-time highs. Its 50 DMA line ($323) defines near-term support to watch. Bullish action came after it reported Apr '24 quarterly earnings +63% on +33% sales revenues versus the year-ago period, continuing its strong earnings track record.
>>> FEATURED STOCK ARTICLE : Volume-Driven Loss Triggered Technical Sell Signal - 5/30/2024 | View all notes | Set NEW NOTE alert | Company Profile | SEC News | Chart | Request a new note C A S I | NVO - NYSE
Novo Nordisk ADR
Medical-Ethical Drugs | $142.49 | -0.77
-0.54% | $142.91 | 2,852,959
75.80% of 50 DAV
50 DAV is 3,764,000 | $144.50
-1.39%
| 6/7/2024 | $143.06 | PP = $138.38 | | MB = $145.30 | Most Recent Note - 6/11/2024 12:20:46 PM
Y - Pausing today after 8 consecutive gains while wedging to new all-time highs. Color code was changed to yellow with pivot point cited based on its 3/07/24 high. To clinch a proper technical buy signal gains above the pivot point must be backed by at least +40% above-average volume. Fundamentals remain strong.
>>> FEATURED STOCK ARTICLE : Wedging Into New High Ground - 6/7/2024 | View all notes | Set NEW NOTE alert | Company Profile | SEC News | Chart | Request a new note C A S I | GVA - NYSE
Granite Construction
Bldg-Heavy Construction | $62.60 | +0.16
0.26% | $62.71 | 380,512
88.90% of 50 DAV
50 DAV is 428,000 | $64.33
-2.69%
| 6/11/2024 | $59.76 | PP = $64.33 | | MB = $67.55 | Most Recent Note - 6/12/2024 5:34:03 PM
Y - Gapped up today for a 3rd consecutive volume-driven gain. Color code was changed to yellow when highlighted on the earlier mid-day report as it was noted that a valid secondary buy point exists up to +5% above the recent high after finding support at its 10 WMA line following a prior breakout. Reported improved earnings in the Jun, Sep, Dec '23, and Mar '24 quarters versus the year ago periods. Annual earnings growth has been strong and steady. See the latest FSU analysis for more details and an annotated graph.
>>> FEATURED STOCK ARTICLE : Granite Construction Found Support at 10-Week Moving Average - 6/11/2024 | View all notes | Set NEW NOTE alert | Company Profile | SEC News | Chart | Request a new note C A S I |
|
|
|
Color Codes Explained :
Y - Better candidates highlighted by our
staff of experts.
G - Previously featured
in past reports as yellow but may no longer be buyable under the
guidelines.
***Last / Change / Volume data in this table is the closing quote data***
|
|
|
THESE ARE NOT BUY RECOMMENDATIONS!
Comments contained in the body of this report are technical
opinions only. The material herein has been obtained
from sources believed to be reliable and accurate, however,
its accuracy and completeness cannot be guaranteed.
This site is not an investment advisor, hence it does
not endorse or recommend any securities or other investments.
Any recommendation contained in this report may not
be suitable for all investors and it is not to be deemed
an offer or solicitation on our part with respect to
the purchase or sale of any securities. All trademarks,
service marks and trade names appearing in this report
are the property of their respective owners, and are
likewise used for identification purposes only.
This report is a service available
only to active Paid Premium Members.
You may opt-out of receiving report notifications
at any time. Questions or comments may be submitted
by writing to Premium Membership Services 665 S.E. 10 Street, Suite 201 Deerfield Beach, FL 33441-5634 or by calling 1-800-965-8307
or 954-785-1121.
|
|
|