You are not logged in.
This means you
CAN ONLY VIEW reports that were published prior to Friday, April 4, 2025.
You
MUST UPGRADE YOUR MEMBERSHIP if you want to see any current reports.
AFTER MARKET UPDATE - TUESDAY, MAY 24TH, 2022
Previous After Market Report Next After Market Report >>>
|
|
|
|
DOW |
+48.38 |
31,928.62 |
+0.15% |
|
Volume |
1,014,402,330 |
+5% |
|
Volume |
4,686,109,400 |
+5% |
|
NASDAQ |
-270.83 |
11,264.45 |
-2.35% |
|
Advancers |
1,387 |
45% |
|
Advancers |
1,319 |
31% |
|
S&P 500 |
-32.27 |
3,941.48 |
-0.81% |
|
Decliners |
1,723 |
55% |
|
Decliners |
2,872 |
69% |
|
Russell 2000 |
-27.94 |
1,764.83 |
-1.56% |
|
52 Wk Highs |
23 |
|
|
52 Wk Highs |
24 |
|
|
S&P 600 |
-13.09 |
1,171.41 |
-1.11% |
|
52 Wk Lows |
282 |
|
|
52 Wk Lows |
526 |
|
|
The market remains in a correction (M criteria). New buying efforts should be avoided until a solid follow-through day shows more decisive strength returning.
|
 |
Major Indices Continue Sputtering With Less Leadership
Kenneth J. Gruneisen - Passed the CAN SLIM® Master's Exam
The Dow reversed early losses to edge 48 points higher, while the S&P 500 slid 0.8%. The Nasdaq Composite dropped 2.4%, having now retreated 29.8% from its November 19 peak. Volume totals reported were higher than the prior session on the NYSE and on the Nasdaq exchange. Breadth was negative as decliners led advancers by a 9-7 margin on the NYSE and by more than 2-1 on the Nasdaq exchange. There were 14 high-ranked companies from the Leaders List that hit new 52-week highs and were listed on the BreakOuts Page, versus 19 on the prior session. New 52-week lows totals expanded again and solidly outnumbered shrinking new 52-week highs totals on both the NYSE and the Nasdaq exchange. Damaging losses for the major indices recently signaled a continuation of the market correction (M criteria). Followers of the fact-based investment system know to watch for a follow-through day on Day 4-7 of a new rally attempt which could signal a new confirmed uptrend.
Chart courtesy of www.stockcharts.com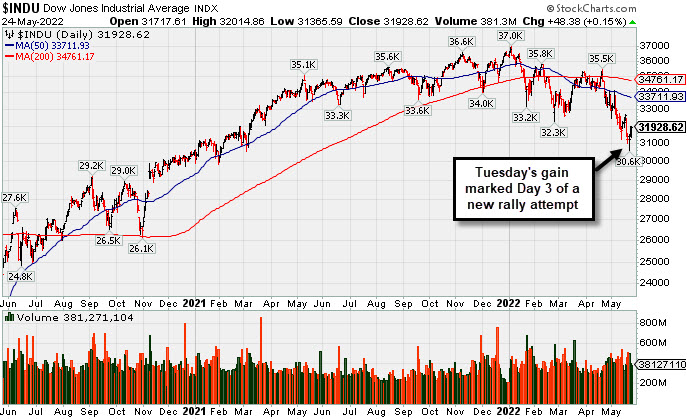 PICTURED: The Dow Jones Industrial Average posted a 3rd consecutive gain on Tuesday following a "positive reversal" after hitting a new 2022 low.
U.S. stocks weathered another volatile session on Tuesday as Wall Street assessed a negative earnings pre-announcement from Snap, Inc (SNAP -43.08%). Shares of the social media company tumbled after its chief executive officer (CEO) warned that a deteriorating macroeconomic backdrop is denting its forward outlook, likely slowing revenue growth. The news pressured other internet-based companies that rely on digital ad revenue, with Facebook parent Meta Platforms Inc. (FB -7.62%) and Google’s Alphabet Inc. (GOOGL -4.95%)
Six of 11 S&P 500 sectors finished in negative territory with growth and tech-related groups lagging the most. In other corporate news, Zoom Video Communications, Inc. (ZM +5.61%) rose after topping analyst profit and revenue estimates and providing upbeat forward guidance. Elsewhere, Dexcom Inc. (DXCM -11.05%) fell following news the company was in talks to acquire medical-device maker Insulet Corp. (PODD +7.38%).
Treasuries strengthened, with the yield on the 10-year note down 10 basis points (0.10%) to 2.76%. A slew of disappointing economic data also dented risk appetite. Flash readings from S&P Global showed growth slowing more than anticipated in both the U.S. manufacturing and services sectors in May, with the purchasing managers’ index (PMI) prints slipping to 57.5 and 53.5, respectively. Separately, an update from the Richmond Fed revealed manufacturing activity in the region eased more than expected in May to -9 from the previous 14 figure. Finally, new home sales slumped a worse-than-forecasted 16.6% in April to a two-year low.
|
 Kenneth J. Gruneisen started out as a licensed stockbroker in August 1987, a couple of months prior to the historic stock market crash that took the Dow Jones Industrial Average down -22.6% in a single day. He has published daily fact-based fundamental and technical analysis on high-ranked stocks online for two decades. Through FACTBASEDINVESTING.COM, Kenneth provides educational articles, news, market commentary, and other information regarding proven investment systems that work in good times and bad.
Comments contained in the body of this report are technical opinions only and are not necessarily those of Gruneisen Growth Corp. The material herein has been obtained from sources believed to be reliable and accurate, however, its accuracy and completeness cannot be guaranteed. Our firm, employees, and customers may effect transactions, including transactions contrary to any recommendation herein, or have positions in the securities mentioned herein or options with respect thereto. Any recommendation contained in this report may not be suitable for all investors and it is not to be deemed an offer or solicitation on our part with respect to the purchase or sale of any securities. |
|
 |
Retail, Financial, and Tech Indexes Fell
Kenneth J. Gruneisen - Passed the CAN SLIM® Master's Exam
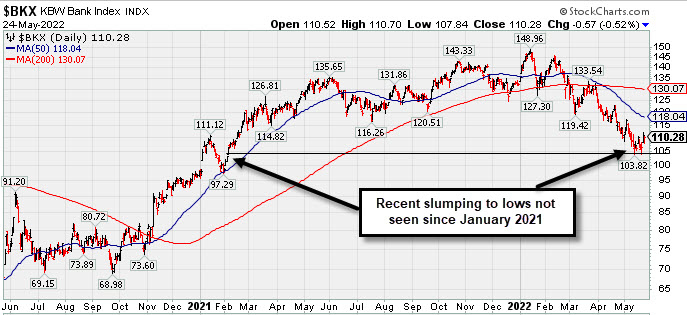
The Retail Index ($RLX -1.68%), Broker/Dealer Index ($XBD -1.45%), and Bank Index ($BKX -0.52%) each lost ground. The tech sector also had a negative bias as the Semiconductor Index ($SOX -2.46%), Biotech Index ($BTK -2.02%), and Networking Index ($NWX -1.13%) suffered unanimous losses. The Gold & Silver Index ($XAU +1.56%) posted a solid gain while the Oil Services Index ($OSX +0.13%) and Integrated Oil Index ($XOI +0.22%) each inched higher.
PICTURED: The Bank Index ($BKX -0.52%) has recently slumped to lows not seen since January 2021.
| Oil Services |
$OSX |
78.09 |
+0.10 |
+0.13% |
+48.12% |
| Integrated Oil |
$XOI |
1,714.07 |
+3.84 |
+0.22% |
+45.48% |
| Semiconductor |
$SOX |
2,827.05 |
-71.38 |
-2.46% |
-28.36% |
| Networking |
$NWX |
717.05 |
-8.22 |
-1.13% |
-26.16% |
| Broker/Dealer |
$XBD |
396.35 |
-5.84 |
-1.45% |
-18.59% |
| Retail |
$RLX |
2,830.36 |
-48.45 |
-1.68% |
-33.03% |
| Gold & Silver |
$XAU |
132.47 |
+2.04 |
+1.56% |
+0.02% |
| Bank |
$BKX |
110.28 |
-0.57 |
-0.52% |
-16.59% |
| Biotech |
$BTK |
4,486.16 |
-92.53 |
-2.02% |
-18.71% |
|
|
|
 |
Featured Stocks
Kenneth J. Gruneisen - Passed the CAN SLIM® Master's Exam
|
|
|
Color Codes Explained :
Y - Better candidates highlighted by our
staff of experts.
G - Previously featured
in past reports as yellow but may no longer be buyable under the
guidelines.
***Last / Change / Volume data in this table is the closing quote data***
Symbol/Exchange
Company Name
Industry Group |
PRICE |
CHANGE
(%Change) |
Day High |
Volume
(% DAV)
(% 50 day avg vol) |
52 Wk Hi
% From Hi |
Featured
Date |
Price
Featured |
Pivot Featured |
|
Max Buy |
 CI
-
NYSE
CI
-
NYSE
Cigna Corp
Medical-Managed Care
|
$264.96
|
+1.59
0.60% |
$266.65
|
1,333,244
88.24% of 50 DAV
50 DAV is 1,511,000
|
$271.71
-2.48%
|
5/6/2022
|
$263.52
|
PP = $269.97
|
|
MB = $283.47
|
 Most Recent Note - 5/24/2022 5:36:07 PM
Y - Posted a 3 consecutive small gain today with below average volume, consolidating above its 50 DMA line ($252.76) after challenging its all-time high last week. Subsequent gains above the pivot point backed by at least +40% above average volume may trigger a technical buy signal. Fundamentals remain strong.
>>> FEATURED STOCK ARTICLE : Cigna Rises Near All-Time High - 5/6/2022 |
View all notes |
Set NEW NOTE alert |
Company Profile |
SEC
News |
Chart |
Request a new note
C
A
S
I |
PAG
-
NYSE
Penske Automotive Grp
Retail/Whlsle-Automobile
|
$108.87
|
+0.55
0.51% |
$108.91
|
350,855
103.19% of 50 DAV
50 DAV is 340,000
|
$119.47
-8.87%
|
5/13/2022
|
$114.88
|
PP = $114.57
|
|
MB = $120.30
|
Most Recent Note - 5/24/2022 5:38:37 PM
Y - Holding its ground but sputtering after completely negating a recent technical breakout. Its 50 DMA line ($103) defines near term support to watch.
>>> FEATURED STOCK ARTICLE : Breakout With Volume-Driven Gain to New High - 5/13/2022 |
View all notes |
Set NEW NOTE alert |
Company Profile |
SEC
News |
Chart |
Request a new note
C
A
S
I |
LLY
-
NYSE
Eli Lilly & Co
Medical-Diversified
|
$305.96
|
+3.36
1.11% |
$307.67
|
2,800,058
94.31% of 50 DAV
50 DAV is 2,969,000
|
$314.00
-2.56%
|
5/16/2022
|
$302.46
|
PP = $314.10
|
|
MB = $329.81
|
Most Recent Note - 5/24/2022 5:37:14 PM
Y - Posted a 3rd consecutive small gain with near average volume, consolidating above its 50 DMA line ($292.74) which recently acted as support. Perched within close striking distance of its 52-week high. Pivot point cited was based on its 4/07/22 high plus 10 cents. Three of the past 4 quarterly comparisons were above the +25% minimum earnings guideline (C criteria).
>>> FEATURED STOCK ARTICLE : Eli Lilly & Co Challenges All-Time High - 5/16/2022 |
View all notes |
Set NEW NOTE alert |
Company Profile |
SEC
News |
Chart |
Request a new note
C
A
S
I |
|
|
|
THESE ARE NOT BUY RECOMMENDATIONS!
Comments contained in the body of this report are technical
opinions only. The material herein has been obtained
from sources believed to be reliable and accurate, however,
its accuracy and completeness cannot be guaranteed.
This site is not an investment advisor, hence it does
not endorse or recommend any securities or other investments.
Any recommendation contained in this report may not
be suitable for all investors and it is not to be deemed
an offer or solicitation on our part with respect to
the purchase or sale of any securities. All trademarks,
service marks and trade names appearing in this report
are the property of their respective owners, and are
likewise used for identification purposes only.
This report is a service available
only to active Paid Premium Members.
You may opt-out of receiving report notifications
at any time. Questions or comments may be submitted
by writing to Premium Membership Services 665 S.E. 10 Street, Suite 201 Deerfield Beach, FL 33441-5634 or by calling 1-800-965-8307
or 954-785-1121.
|
|
|