You are not logged in.
This means you
CAN ONLY VIEW reports that were published prior to Sunday, March 30, 2025.
You
MUST UPGRADE YOUR MEMBERSHIP if you want to see any current reports.
AFTER MARKET UPDATE - THURSDAY, MAY 12TH, 2016
Previous After Market Report Next After Market Report >>>
|
|
|
|
DOW |
+9.38 |
17,720.50 |
+0.05% |
|
Volume |
923,624,310 |
+0% |
|
Volume |
1,777,477,330 |
+4% |
|
NASDAQ |
-23.36 |
4,737.33 |
-0.49% |
|
Advancers |
1,448 |
49% |
|
Advancers |
932 |
31% |
|
S&P 500 |
-0.35 |
2,064.11 |
-0.02% |
|
Decliners |
1,530 |
51% |
|
Decliners |
2,111 |
69% |
|
Russell 2000 |
-6.14 |
1,108.60 |
-0.55% |
|
52 Wk Highs |
130 |
|
|
52 Wk Highs |
35 |
|
|
S&P 600 |
-2.66 |
682.19 |
-0.39% |
|
52 Wk Lows |
38 |
|
|
52 Wk Lows |
103 |
|
|
 |
Tech Weakness Still Pressuring Nasdaq Composite Index
Kenneth J. Gruneisen - Passed the CAN SLIM® Master's Exam
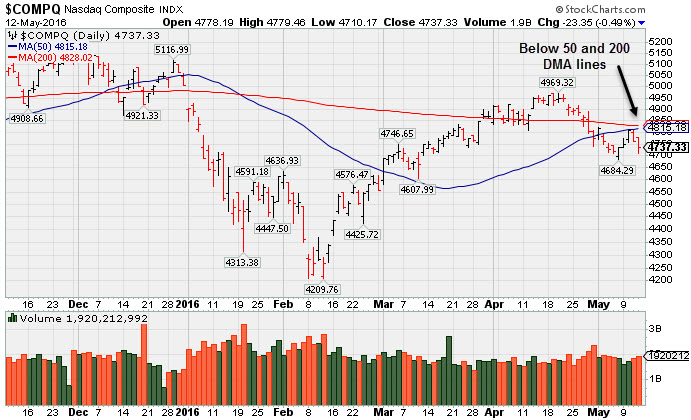
The Dow was up 9 points to 17720. The S&P 500 lost less than a point to 2064 and the Nasdaq 100 fell 23 points to 4737. The volume totals were reported slightly higher on the NYSE and on the Nasdaq exchange. Decliners narrowly led advancers on the NYSE but they led by more than 2-1 on the Nasdaq exchange. Leadership waned as there were 26 high-ranked companies from the Leaders List made new 52-week highs and were listed on the BreakOuts Page, down from the total of 36 on the prior session. New 52-week highs outnumbered new 52-week lows on the NYSE while new lows yet again outnumbered new highs on the Nasdaq exchange. PICTURED: The Nasdaq Composite Index is sputtering below its 50-day and 200-day moving average (DMA) lines.
The market's confirmed uptrend (M criteria) has come under pressure recently while the DOW and S&P 500 Index are now consolidating just above their respective 50-day moving average (DMA) lines. Sustained rallies require a healthy crop of leaders (stocks hitting new highs). Very few issues have appeared to meet the fact-based investment system's guidelines or make meaningful headway in recent weeks. The Featured Stocks Page includes current notes with headline links for access to more detailed letter-by-letter analysis including price/volume graphs annotated by our experts. The major averages gave back a morning advance as weakness in the Tech sector tempered gains in crude oil. On the data front, initial jobless claims came in at 294,000, above the predicted 270,000. In a separate release, import prices rose to 0.3% in April, after 0.2% gain in the previous month. Seven of 10 sectors in the S&P 500 traded positive on the session. Materials stocks outperformed as Monsanto (MON +8.39%) rose on speculation the company could receive a takeover offer from rival Bayer AG. Technology lagged with Apple (AAPL -2.35%) weighing down performance. Its shares fell amid a report of reduced chip shipments for iPhones. Kohl’s Corp (KSS -9.17%) tumbled as the department store saw a drop in quarterly sales. General Electric (GE -0.82%) fell after receiving negative analyst commentary. Treasuries declined with the benchmark 10-year note down 7/32 to 1.75%. In commodities, NYMEX WTI crude rebounded 0.6% to $46.51/barrel, after a report from the International Energy Agency predicted a lower-than-expected global supply gut this year. COMEX gold was off 0.5% to $1268.90/ounce. In FOREX, the Dollar Index was up 0.3% with particular strength against the euro and yen. |
 Kenneth J. Gruneisen started out as a licensed stockbroker in August 1987, a couple of months prior to the historic stock market crash that took the Dow Jones Industrial Average down -22.6% in a single day. He has published daily fact-based fundamental and technical analysis on high-ranked stocks online for two decades. Through FACTBASEDINVESTING.COM, Kenneth provides educational articles, news, market commentary, and other information regarding proven investment systems that work in good times and bad.
Comments contained in the body of this report are technical opinions only and are not necessarily those of Gruneisen Growth Corp. The material herein has been obtained from sources believed to be reliable and accurate, however, its accuracy and completeness cannot be guaranteed. Our firm, employees, and customers may effect transactions, including transactions contrary to any recommendation herein, or have positions in the securities mentioned herein or options with respect thereto. Any recommendation contained in this report may not be suitable for all investors and it is not to be deemed an offer or solicitation on our part with respect to the purchase or sale of any securities. |
|
 |
Retail Index Edged Higher Amid Widespread Weakness
Kenneth J. Gruneisen - Passed the CAN SLIM® Master's Exam
The Retail Index ($RLX +0.25%) edged higher on Thursday but the Bank Index ($BKX -0.47%) lost ground and the Broker/Dealer Index ($XBD -0.08%) finished flat. The tech sector was led lower by the Semiconductor Index ($SOX -1.79%) and the Biotechnology Index ($BTK -1.52%) while Networking Index ($NWX -1.05%) also slumped. The Gold & Silver Index ($XAU -1.99%) and Oil Services Index ($OSX -1.22%) lost ground while the Integrated Oil Index ($XOI -0.08%) finished flat. Charts courtesy www.stockcharts.com
 PICTURED: The Networking Index ($NWX -1.05% ) has been sputtering below its 50-day and 200-day moving average (DMA) lines.
| Oil Services |
$OSX |
162.20 |
-2.00 |
-1.22% |
+2.83% |
| Integrated Oil |
$XOI |
1,115.90 |
-0.87 |
-0.08% |
+4.03% |
| Semiconductor |
$SOX |
630.77 |
-11.52 |
-1.79% |
-4.93% |
| Networking |
$NWX |
345.35 |
-3.65 |
-1.05% |
-8.13% |
| Broker/Dealer |
$XBD |
157.73 |
-0.13 |
-0.08% |
-11.43% |
| Retail |
$RLX |
1,283.95 |
+3.14 |
+0.25% |
+0.04% |
| Gold & Silver |
$XAU |
86.49 |
-1.76 |
-1.99% |
+90.93% |
| Bank |
$BKX |
67.07 |
-0.31 |
-0.46% |
-8.22% |
| Biotech |
$BTK |
2,888.83 |
-44.58 |
-1.52% |
-24.26% |
|
|
|
 |
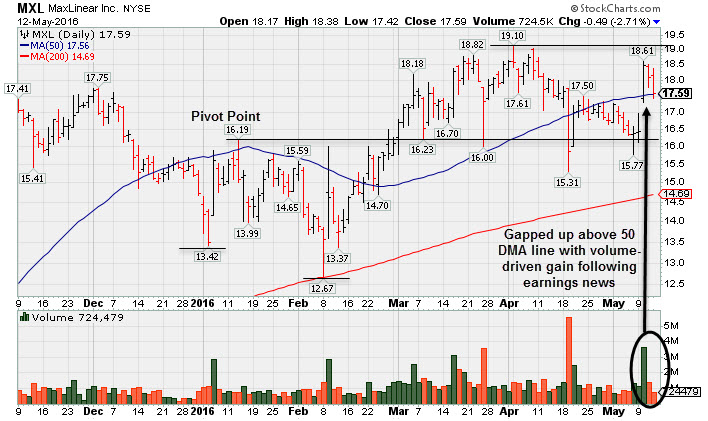
Rebounded Above 50-Day Average Following Strong Earnings News
Kenneth J. Gruneisen - Passed the CAN SLIM® Master's Exam
Maxlinear Inc (MXL -$0.49 or -2.71% to $17.59) fell on lighter volume today, retreating near its 50-day moving average (DMA) line. There was a powerful gap up on 5/10/16 for a considerable volume-driven gain after it reported strong earnings +422% on +190% sales revenues for the Mar '16 quarter versus the year ago period. The gain helped it rebound above its 50-day moving average (DMA) line. Members were reminded - "Remember that any stock that was previously sold can be bought again when strength returns." It was last shown in the FSU section on 4/01/16 with an annotated graph under the headline, "Found Support Above 50 DMA Line Consolidating Near 52-week High". Disciplined investors avoid chasing extended stocks and always limit losses by selling any stock that falls more than -7% from their purchase price. MXL was first highlighted in yellow with pivot point cited based on its 1/13/16 high in the 2/26/16 mid-day report (read here). It ended up breaking out convincingly with a subsequent streak of gains on above average volume, clearing the previously noted a "double bottom" base and triggering a technical buy signal. The high-ranked Semiconductor firm saw sales revenues increases of +99%, +193%, and +205% for the Jun, Sep, and Dec '15 quarters, respectively, versus the year ago periods as earnings rose +62%, +900%, and +820%. The 3 strong quarterly comparisons above the +25% minimum guideline (C criteria) were noted in the 2/09/16 mid-day report - "Helping it better match the fact-based investment system's guidelines." Its small supply of only 51.8 million shares in the public float (S criteria) may contribute to greater price volatility in the event of institutional buying or selling. The number of top-rated funds owning its shares rose from 175 in Mar '15 to 288 in Mar '16, a very reassuring sign (I criteria). It currently has a Timeliness rating of C, and a Sponsorship Rating of D. |
|
|
Color Codes Explained :
Y - Better candidates highlighted by our
staff of experts.
G - Previously featured
in past reports as yellow but may no longer be buyable under the
guidelines.
***Last / Change / Volume data in this table is the closing quote data***
|
|
|
THESE ARE NOT BUY RECOMMENDATIONS!
Comments contained in the body of this report are technical
opinions only. The material herein has been obtained
from sources believed to be reliable and accurate, however,
its accuracy and completeness cannot be guaranteed.
This site is not an investment advisor, hence it does
not endorse or recommend any securities or other investments.
Any recommendation contained in this report may not
be suitable for all investors and it is not to be deemed
an offer or solicitation on our part with respect to
the purchase or sale of any securities. All trademarks,
service marks and trade names appearing in this report
are the property of their respective owners, and are
likewise used for identification purposes only.
This report is a service available
only to active Paid Premium Members.
You may opt-out of receiving report notifications
at any time. Questions or comments may be submitted
by writing to Premium Membership Services 665 S.E. 10 Street, Suite 201 Deerfield Beach, FL 33441-5634 or by calling 1-800-965-8307
or 954-785-1121.
|
|
|