You are not logged in.
This means you
CAN ONLY VIEW reports that were published prior to Monday, March 31, 2025.
You
MUST UPGRADE YOUR MEMBERSHIP if you want to see any current reports.
AFTER MARKET UPDATE - TUESDAY, MAY 10TH, 2016
Previous After Market Report Next After Market Report >>>
|
|
|
|
DOW |
+222.44 |
17,928.35 |
+1.26% |
|
Volume |
831,063,070 |
-12% |
|
Volume |
1,604,178,740 |
+9% |
|
NASDAQ |
+59.67 |
4,809.88 |
+1.26% |
|
Advancers |
2,310 |
77% |
|
Advancers |
1,983 |
67% |
|
S&P 500 |
+25.70 |
2,084.39 |
+1.25% |
|
Decliners |
700 |
23% |
|
Decliners |
967 |
33% |
|
Russell 2000 |
+10.58 |
1,128.83 |
+0.95% |
|
52 Wk Highs |
251 |
|
|
52 Wk Highs |
58 |
|
|
S&P 600 |
+5.45 |
693.32 |
+0.79% |
|
52 Wk Lows |
21 |
|
|
52 Wk Lows |
63 |
|
|
 |
Indices Posted Solid Gains But With Mixed Volume and No Expansion in Leadership
Kenneth J. Gruneisen - Passed the CAN SLIM® Master's Exam
Stocks finished firmly higher on Tuesday. The Dow was up 222 points to 17928. The S&P 500 gained 24 points to 2084 and the Nasdaq Composite added 59 points to 4809. The volume totals were reported mixed, lighter on the NYSE and higher on the Nasdaq exchange. Advancers led decliners by more than a 3-1 margin on the NYSE and 2-1 on the Nasdaq exchange. There were 54 high-ranked companies from the Leaders List made new 52-week highs and were listed on the BreakOuts Page, matching the total of 54 on the prior session. New 52-week highs outnumbered new 52-week lows on the NYSE while new lows yet again outnumbered new highs on the Nasdaq exchange. PICTURED: The Dow Jones Industrial Average stayed above its 50-day moving average (DMA) line. It is -2.3% off its record high hit on May 19, 2015.
The market's confirmed uptrend (M criteria) has come under pressure recently while the DOW and S&P 500 Index are now consolidating just above their respective 50-day and 200-day moving average (DMA) lines. Sustained rallies require a healthy crop of leaders (stocks hitting new highs). Very few issues have appeared to meet the fact-based investment system's guidelines or make meaningful headway in recent weeks. The Featured Stocks Page includes current notes with headline links for access to more detailed letter-by-letter analysis including price/volume graphs annotated by our experts. The S&P 500 experienced its sharpest gain in more than a month amid a rebound in the commodities complex. On the data front, a gauge of small business sentiment rose above forecasted in April. In a separate release, wholesale inventories rose 0.1% in March, matching analyst estimates. Another report revealed job openings increased by more than expected in March. All 10 sectors in the S&P 500 finished the session in positive territory. Materials paced the gains along with Industrials and Energy shares. Disney (DIS +1.2%) rose ahead of its quarterly release after the bell. Allergan (AGN +5.3%) rallied as the drug maker bested earnings projections and announced a $10 billion stock repurchase plan. Amazon.com (AMZN +3.5%) rose as the online retail giant was the subject of an analyst upgrade. Retailer Gap (GPS -11.5%) after posting weak demand at its Banana Republic and Old Navy chains. Treasuries fluctuated with the benchmark 10-year note slipping 1/32 to 1.75%. In commodities, NYMEX WTI crude gained 2.9% to $44.72/barrel. COMEX gold was up 0.1% to $1267.50/ounce. In FOREX, the dollar was little-changed with strength against the yen offset by weakness against emerging currencies |
 Kenneth J. Gruneisen started out as a licensed stockbroker in August 1987, a couple of months prior to the historic stock market crash that took the Dow Jones Industrial Average down -22.6% in a single day. He has published daily fact-based fundamental and technical analysis on high-ranked stocks online for two decades. Through FACTBASEDINVESTING.COM, Kenneth provides educational articles, news, market commentary, and other information regarding proven investment systems that work in good times and bad.
Comments contained in the body of this report are technical opinions only and are not necessarily those of Gruneisen Growth Corp. The material herein has been obtained from sources believed to be reliable and accurate, however, its accuracy and completeness cannot be guaranteed. Our firm, employees, and customers may effect transactions, including transactions contrary to any recommendation herein, or have positions in the securities mentioned herein or options with respect thereto. Any recommendation contained in this report may not be suitable for all investors and it is not to be deemed an offer or solicitation on our part with respect to the purchase or sale of any securities. |
|
 |
Retail, Financial, Tech and Commodity-Linked Indices Rose
Kenneth J. Gruneisen - Passed the CAN SLIM® Master's Exam
The Retail Index ($RLX +1.30%) had a positive influence on the major averages on Tuesday and the Bank Index ($BKX +1.88%) and the Broker/Dealer Index ($XBD +2.66%) both finished with solid gains. The tech sector saw unanimous gains from the Biotechnology Index ($BTK +0.56%), Networking Index ($NWX +1.14%) and the Semiconductor Index ($SOX +1.22%). Commodity-linked groups were also higher as the Gold & Silver Index ($XAU +3.77%), Oil Services Index ($OSX +1.52%) and the Integrated Oil Index ($XOI +2.32%) each posted respectable gains. Charts courtesy www.stockcharts.com
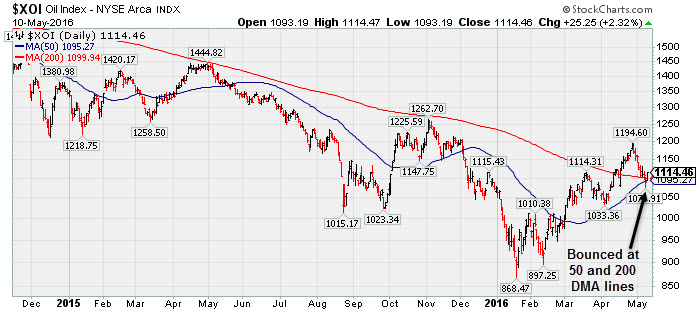
PICTURED: The Integrated Oil Index ($XOI +2.32%) bounced at its 50-day and 200-day moving average (DMA) lines while consolidating after making a rebound from January lows.
| Oil Services |
$OSX |
164.12 |
+2.45 |
+1.52% |
+4.05% |
| Integrated Oil |
$XOI |
1,114.46 |
+25.25 |
+2.32% |
+3.89% |
| Semiconductor |
$SOX |
644.30 |
+7.76 |
+1.22% |
-2.89% |
| Networking |
$NWX |
349.87 |
+3.96 |
+1.14% |
-6.93% |
| Broker/Dealer |
$XBD |
159.93 |
+4.14 |
+2.66% |
-10.20% |
| Retail |
$RLX |
1,305.65 |
+16.71 |
+1.30% |
+1.73% |
| Gold & Silver |
$XAU |
85.59 |
+3.11 |
+3.77% |
+88.94% |
| Bank |
$BKX |
67.79 |
+1.25 |
+1.88% |
-7.24% |
| Biotech |
$BTK |
3,027.49 |
+16.96 |
+0.56% |
-20.62% |
|
|
|
 |
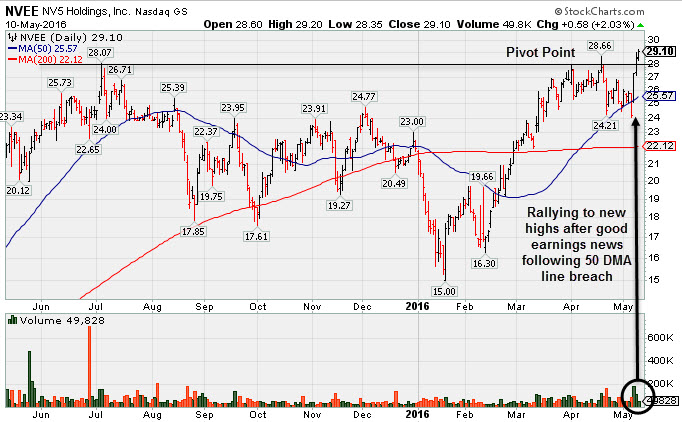
Less Volume Behind Gain For Another New High
Kenneth J. Gruneisen - Passed the CAN SLIM® Master's Exam
N V 5 Global Inc (NVEE +$0.58 or +2.03% to $29.10) had lighter volume today after 2 prior volume-driven gains helped it rallying for new 52-week highs. It found prompt support after violating its 50-day moving average (DMA) line triggering a sell signal and raising concerns last week. It encountered distributional pressure after barely reaching new 52-week and all-time highs, then the prompt rebound above the 50 DMA line came after reporting earnings +39% on +54% sales revenues for the Mar '16 quarter, continuing its strong earnings track record.
Remember that any stock that was previously sold can be bought again when strength returns. NVEE was last shown in this FSU section on 4/20/16 with an annotated graph under the headline, "Met Resistance When Poised to Breakout From Longer Base Pattern". Its color code was changed to yellow with a new pivot point cited based on its 4/01/16 high plus 10 cents. It was noted - "A convincing close above the pivot point in new all-time high territory may signal the beginning of a meaningful advance."
The high-ranked Commercial Services - Consulting firm was first highlighted with a pivot point based on its 12/02/15 high in the 3/14/16 mid-day report (read here) and then finished strong and triggered a technical buy signal while rising from an 8-month double bottom base with +142% above average volume.
It completed a new Public Offering on 5/22/15. They reported earnings +32% on +47% sales revenues for the Dec '15 quarter. Prior quarterly earnings comparisons have been mostly above the +25% minimum guideline (C criteria), and its strong annual earnings (A criteria) history helps it match the fundamental guidelines of the fact-based investment system. The number of top-rated funds owning its shares rose from 13 in Mar '15 to to 122 in Mar '16. Its current Up/Down Volume Ratio of 1.7 is an unbiased sign of institutional buying demand over the past 50 days, another reassuring sign concerning the I criteria.
|
|
|
Color Codes Explained :
Y - Better candidates highlighted by our
staff of experts.
G - Previously featured
in past reports as yellow but may no longer be buyable under the
guidelines.
***Last / Change / Volume data in this table is the closing quote data***
|
|
|
THESE ARE NOT BUY RECOMMENDATIONS!
Comments contained in the body of this report are technical
opinions only. The material herein has been obtained
from sources believed to be reliable and accurate, however,
its accuracy and completeness cannot be guaranteed.
This site is not an investment advisor, hence it does
not endorse or recommend any securities or other investments.
Any recommendation contained in this report may not
be suitable for all investors and it is not to be deemed
an offer or solicitation on our part with respect to
the purchase or sale of any securities. All trademarks,
service marks and trade names appearing in this report
are the property of their respective owners, and are
likewise used for identification purposes only.
This report is a service available
only to active Paid Premium Members.
You may opt-out of receiving report notifications
at any time. Questions or comments may be submitted
by writing to Premium Membership Services 665 S.E. 10 Street, Suite 201 Deerfield Beach, FL 33441-5634 or by calling 1-800-965-8307
or 954-785-1121.
|
|
|