Pulled Back to 200-Day Moving Average Line -
Consolidating After Rebounding Above 50-Day Moving Average - Wednesday, August 2, 2023
XPEL Returns to Featured Stocks List After Long Consolidation - Wednesday, June 28, 2023
New Base Formed May Be "Late Stage" - Wednesday, July 21, 2021
Powerful Breakout Backed by Heavy Volume - Thursday, March 11, 2021
Damaging Loss Indicative of Distributional Pressure - Tuesday, February 23, 2021
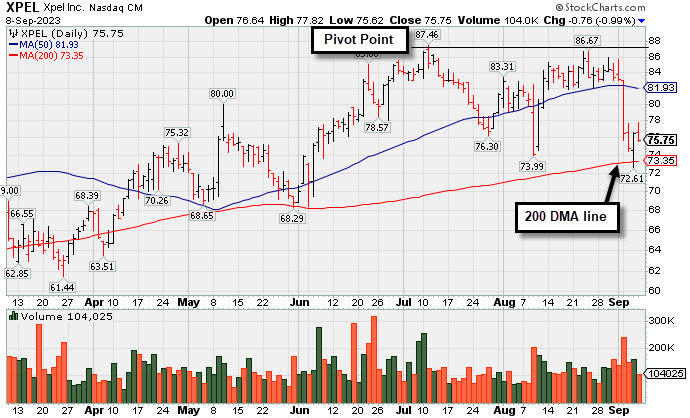
Pulled Back to 200-Day Moving Average Line -
Xpel Inc's (XPEL -$0.76 or -0.99% to $75.75) color code was changed to green after damaging losses violated its 50-day moving average (DMA) line ($81.93) triggering a technical sell signal. It is testing its 200 DMA line ($73.28) with recent losses undercutting the 8/29/23 low. A rebound above the 50 DMA line is needed for tis outlook to improve.
Fundamentals remain strong. It reported Jun '23 quarterly earnings +33% on +22% sales revenues versus the year ago period. XPEL was highlighted in yellow with pivot point cited based on its 8/15/23 high plus 10 cents in the 6/28/23 mid-day report (read here). The 4 latest quarterly comparisons were above the +25% minimum earnings guideline (C criteria), helping it match the winning models of the fact-based investment system.
This Auto/Truck - Replacement Parts firm has a 99 Earnings Per Share Rating. It was last shown in this FSU section on 8/02/23 under the headline, "Consolidating After Rebounding Above 50-Day Moving Average". Annual earnings growth remained strong while it went through a deep consolidation since dropped from the Featured Stocks list on 8/13/21.
The number of top-rated funds owning its shares rose from 45 in Mar '20 to 342 in Jun '23, a reassuring sign concerning the I criteria. Its current Up/Down Volume Ratio of 0.9 is an unbiased indication its shares have been under slight distributional pressure over the past 50 days. Its small supply of only 27.6 million shares outstanding (S criteria) can contribute to greater volatility in the event of institutional buying or selling.
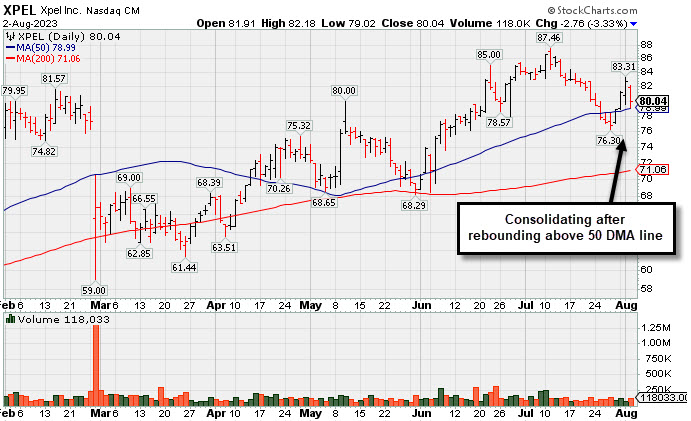
Consolidating After Rebounding Above 50-Day Moving Average - Wednesday, August 2, 2023
Xpel Inc (XPEL -$2.76 or -3.33% to $80.04) has been consolidating with mostly below averager volume after rebounding back above its 50-day moving average (DMA) line ($78.99). It stalled after recently hitting a new 52-week high and it is perched -9.9% off its 52-week high. Keep in mid it is due to report Jun '23 quarterly earnings on 8/09/23. Volume and volatility often increase near earnings news.
XPEL was highlighted in yellow with pivot point cited based on its 8/15/23 high plus 10 cents in the 6/28/23 mid-day report (read here). It reported Mar '23 quarterly earnings +46% on +19% sales revenues versus the year ago period, its 3rd quarterly comparison above the +25% minimum earnings guideline (C criteria), helping it better match the winning models of the fact-based investment system.
This Auto/Truck - Replacement Parts firm has a 99 Earnings Per Share Rating. It was last shown in this FSU section on 6/28/23 under the headline, "XPEL Returns to Featured Stocks List After Long Consolidation'". Annual earnings growth remained strong while it went through a deep consolidation since dropped from the Featured Stocks list on 8/13/21.
The number of top-rated funds owning its shares rose from 45 in Mar '20 to 342 in Jun '23, a reassuring sign concerning the I criteria. Its current Up/Down Volume Ratio of 0.9 is an unbiased indication its shares have been under slight distributional pressure over the past 50 days. Its small supply of only 27.6 million shares outstanding (S criteria) can contribute to greater volatility in the event of institutional buying or selling.
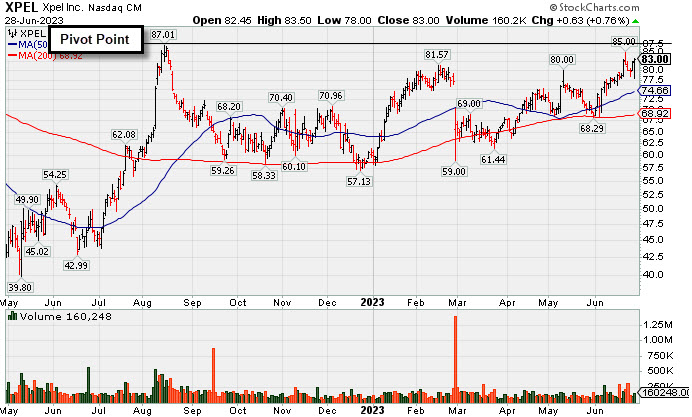
XPEL Returns to Featured Stocks List After Long Consolidation - Wednesday, June 28, 2023
Xpel Inc (XPEL +$0.63 or +0.76% to $83.00) was highlighted in yellow with pivot point cited based on its 8/15/23 high plus 10 cents in the earlier mid-day report (read here). It is perched within striking distance of its 52-week high after an orderly 10-month base. Reported Mar '23 quarterly earnings +46% on +19% sales revenues versus the year ago period, its 3rd quarterly comparison above the +25% minimum earnings guideline (C criteria), helping it better match the winning models of the fact-based investment system.
This Auto/Truck - Replacement Parts firm has a 99 Earnings Per Share Rating. It went through a long consolidation since shown in this FSU section on 7/21/21 under the headline, "New Base Formed May Be 'Late Stage'".
Annual earnings growth remained strong while it went through a deep consolidation since dropped from the Featured Stocks list on 8/13/21.
The number of top-rated funds owning its shares rose from 45 in Mar '20 to 335 in Mar '23, a reassuring sign concerning the I criteria. Its current Up/Down Volume Ratio of 1.1 is an unbiased indication its shares have been under slight accumulation over the past 50 days. Its small supply of only 27.6 million shares outstanding (S criteria) can contribute to greater volatility in the event of institutional buying or selling.
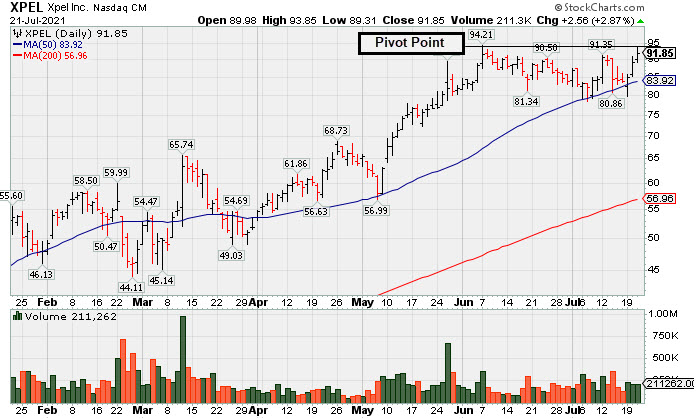
New Base Formed May Be "Late Stage" - Wednesday, July 21, 2021
Xpel Inc (XPEL +2.56 or +2.87% to $91.85) was highlighted in yellow with pivot point cited based on its 6/07/21 high plus 10 cents in the earlier mid-day report (read here). Its 6-week consolidation has the look of a riskier "late-stage" base while challenging its all-time high after finding prompt support again at its 50 DMA line ($83.91).
It has a 95 Earnings Per Share Rating. It reported Mar '21 quarterly earnings +317% on +83% sales revenues versus the year ago period, adding to its strong earnings track record. Showed resilience and impressive strength after dropped from the Featured Stocks list on 3/29/21. It was last shown in this FSU section on 3/11/21 under the headline, "Powerful Breakout Backed by Heavy Volume".
This Auto/Truck - Replacement Parts firm reported Dec '20 quarterly earnings +29% on +0% sales revenues versus the year ago period, marking the 3rd quarterly comparison above the +25% minimum earnings guideline (C criteria). Annual earnings history has been strong after a downturn in FY '17.
The number of top-rated funds owning its shares rose from 45 in Mar '20 to 219 in Jun '21, a reassuring sign concerning the I criteria. Its current Up/Down Volume Ratio of 1.6 is an unbiased indication its shares have been under accumulation over the past 50 days. Its small supply of only 27.6 million shares outstanding (S criteria) can contribute to greater volatility in the event of institutional buying or selling.
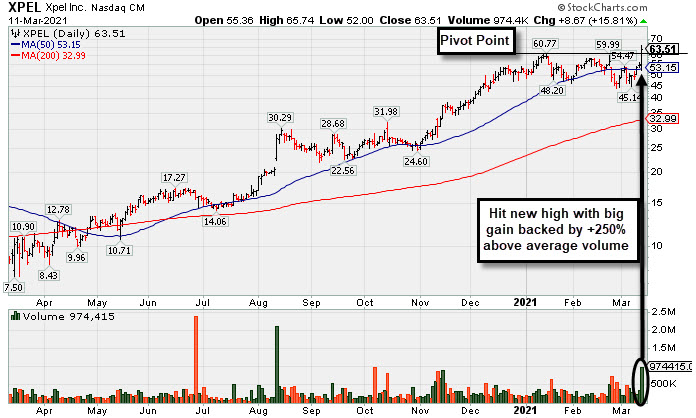
Powerful Breakout Backed by Heavy Volume - Thursday, March 11, 2021
Xpel Inc (XPEL +$8.67 or +15.81% to $63.51) finished strong after highlighted in yellow with pivot point cited based on its 1/14/21 high plus 10 cents in the earlier mid-day report (read here). The gain and strong close above its pivot point backed by +250% above average volume triggered a new technical buy signal.
XPEL hit a new 52-week high (N criteria) with today's big volume-driven gain. It repaired a recently noted 50 DMA line violation and showed great resilience after dropped from the Featured Stocks list on 2/25/21. XPEL was highlighted in yellow with pivot point cited based on its 1/14/21 high plus 10 cents in the prior mid-day report (read here) while noted - "A gain and strong close above its pivot point backed by at least +40% above average volume may trigger a technical buy signal. Keep in mind it is a riskier late-stage base, however, no resistance remains due to overhead supply as its challenging its all-time high after finding prompt support at its 50 DMA line ($52.86) during prior consolidations."
This Auto/Truck - Replacement Parts firm reported Dec '20 quarterly earnings +29% on +0% sales revenues versus the year ago period, marking the 3rd quarterly comparison above the +25% minimum earnings guideline (C criteria). Annual earnings history has been strong after a downturn in FY '17.
The number of top-rated funds owning its shares rose from 45 in Mar '20 to 171 in Dec '20, a reassuring sign concerning the I criteria. Its current Up/Down Volume Ratio of 1.3 is an unbiased indication its shares have been under accumulation over the past 50 days. Its small supply of only 27.6 million shares outstanding (S criteria) can contribute to greater volatility in the event of institutional buying or selling.
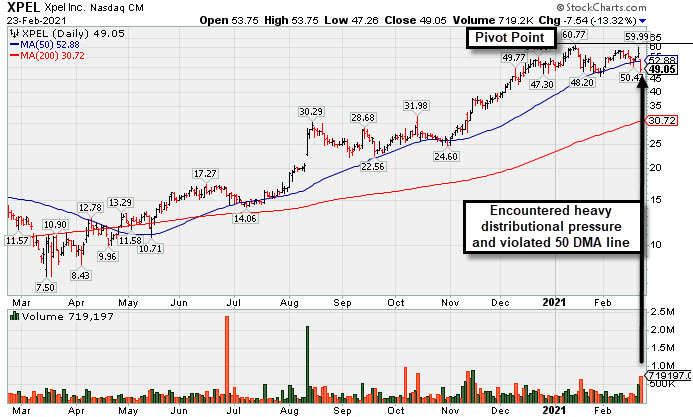
Damaging Loss Indicative of Distributional Pressure - Tuesday, February 23, 2021
Xpel Inc (XPEL -$7.54 or -13.32% to $49.05) suffered a big loss today with volume +172% above average, action clearly indicative of distributional pressure. It violated its 50-day moving average (DMA) line triggering a technical sell signal. XPEL was highlighted in yellow with pivot point cited based on its 1/14/21 high plus 10 cents in the prior mid-day report (read here) while noted - "A gain and strong close above its pivot point backed by at least +40% above average volume may trigger a technical buy signal. Keep in mind it is a riskier late-stage base, however, no resistance remains due to overhead supply as its challenging its all-time high after finding prompt support at its 50 DMA line ($52.86) during prior consolidations."
This Auto/Truck - Replacement Parts firm reported Sep '20 quarterly earnings +50% on +29% sales revenues versus the year ago period. Three of the past 4 quarterly comparisons were above the +25% minimum earnings guideline (C criteria). Annual earnings history has been strong after a downturn in FY '17.
The number of top-rated funds owning its shares rose from 45 in Mar '20 to 168 in Dec '20, a reassuring sign concerning the I criteria. Its current Up/Down Volume Ratio of 1.4 is an unbiased indication its shares have been under accumulation over the past 50 days. Its small supply of only 27.6 million shares outstanding (S criteria) can contribute to greater volatility in the event of institutional buying or selling.