Following Sell Signals Even Uglier Damage Came - Tuesday, October 20, 2015
There are few stocks included on the Featured Stocks list now and none of the companies need additional review. At times like these we have an opportunity to look back. Not long ago we reviewed Ambarella (AMBA) on 9/03/15 and Skyworks (SWKS) on 9/17/15 because previously featured stocks which were dropped can serve as educational examples of the investment system's tactics. It is also a reminder that high-ranked leaders eventually fall out of favor.
If you wish to request for a specific stock to receive more detailed coverage in this section please use the inquiry form to submit your request. Thank you!
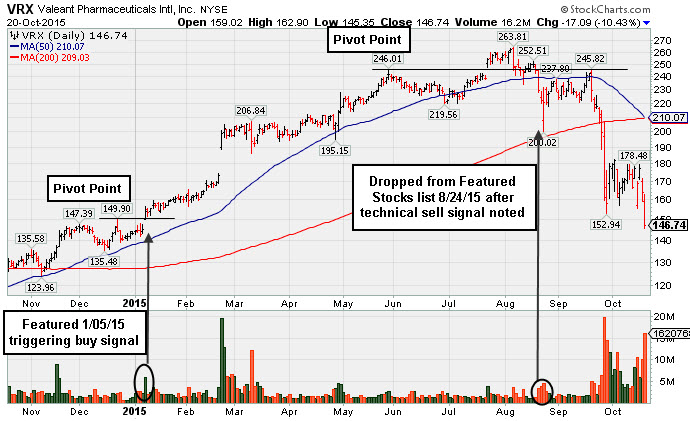
Valeant Pharmaceuticals International, Inc. (VRX) has seen its share price slashed badly in recent months. Technical sell signals were noted back on 8/20 and 8/21, and when it was dropped from the Featured Stocks list on 8/24/15. The subsequent rebound effort met resistance at its 50-day moving average, then it turned uglier. The action demonstrates the importance of recognizing sell signals and limiting losses if any stock falls more than -7% from your purchase price.It reported earnings +34% on +34% sales revenues for the Jun '15 quarter. VRX reported earnings +34% on +16% sales revenues for the Mar '15 quarter, an improvement after Dec '14 earnings below the +25% minimum guideline (C criteria). Prior quarterly comparisons were routinely above that minimum threshold.
It completed an new Public Offerings 3/17/15 and on 6/18/13. The upshot of such offerings is that the end result is typically an increase in the total number of institutional owners. The number of top-rated funds owning its shares rose from 1,056 in Mar '14 to 1,320 in Jun '15, a reassuring trend concerning the I criteria. A downturn in FY '07 and '08 earnings (A criteria) was followed by a strong earnings rebound in recent years.
Holding Ground Following Latest Technical Breakout - Monday, August 3, 2015
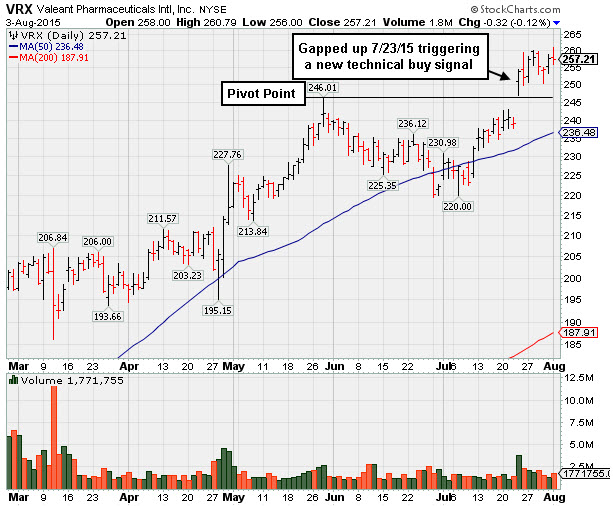
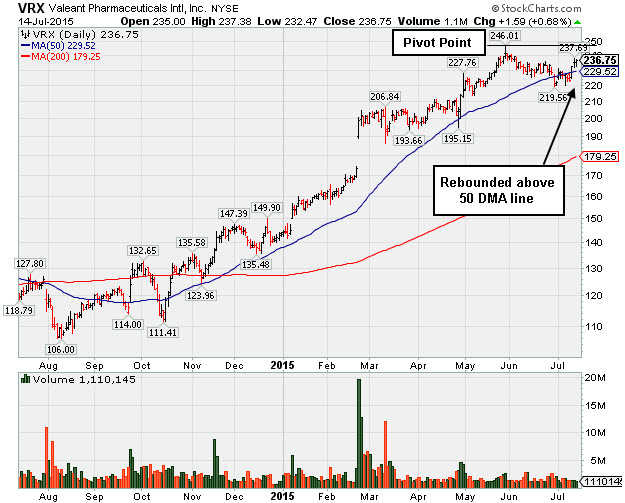
Valeant Pharmaceuticals International, Inc. (VRX -$0.32 or -0.12% to $257.21) has held its ground and volume totals have been cooling since its 7/23/15 gap up above the pivot point triggered a new (or add-on) technical buy signal. It was last shown in this FSU section on 7/14/15 with an annotated graph under the headline, "New Base Has Formed and Earnings News is Due Soon" and a new pivot point had been cited based on its 5/28/15 high plus 10 cents.Prior highs in the $246 area define initial support above the 50-day moving average (DMA) line ($236.48). There is still good leadership (L criteria) in the Medical - Ethical Drugs group.
It reported earnings +34% on +34% sales revenues for the Jun '15 quarter. VRX reported earnings +34% on +16% sales revenues for the Mar '15 quarter, an improvement after Dec '14 earnings below the +25% minimum guideline (C criteria). Prior quarterly comparisons were routinely above that minimum threshold.
It completed an new Public Offerings 3/17/15 and on 6/18/13. The upshot of such offerings is that the end result is typically an increase in the total number of institutional owners. The number of top-rated funds owning its shares rose from 1,056 in Mar '14 to 1,320 in Jun '15, a reassuring trend concerning the I criteria. Its current Up/Down Volume Ratio of 1.2 is an unbiased indication its shares have been under slight accumulation over the past 50 days. A downturn in FY '07 and '08 earnings (A criteria) was followed by a strong earnings rebound in recent years.
New Base Has Formed and Earnings News is Due Soon - Tuesday, July 14, 2015
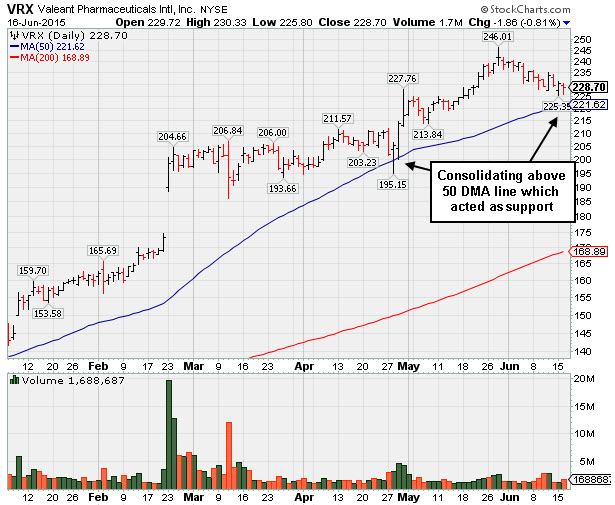
Latest Consolidation is Not a Sufficient Length Bade - Tuesday, June 16, 2015
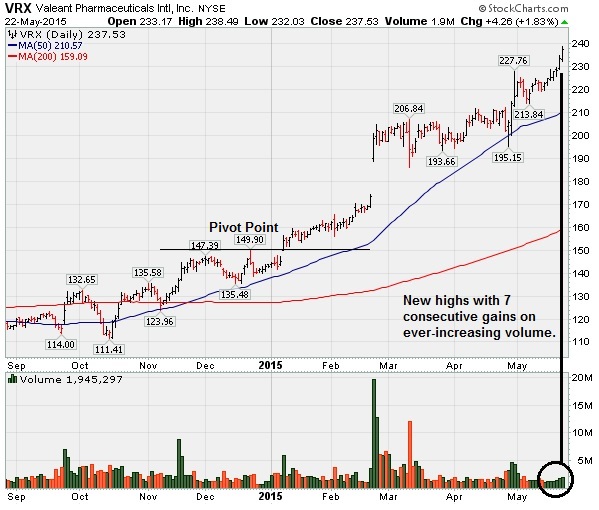
Very Extended Following 7 Consecutive Gains - Friday, May 22, 2015
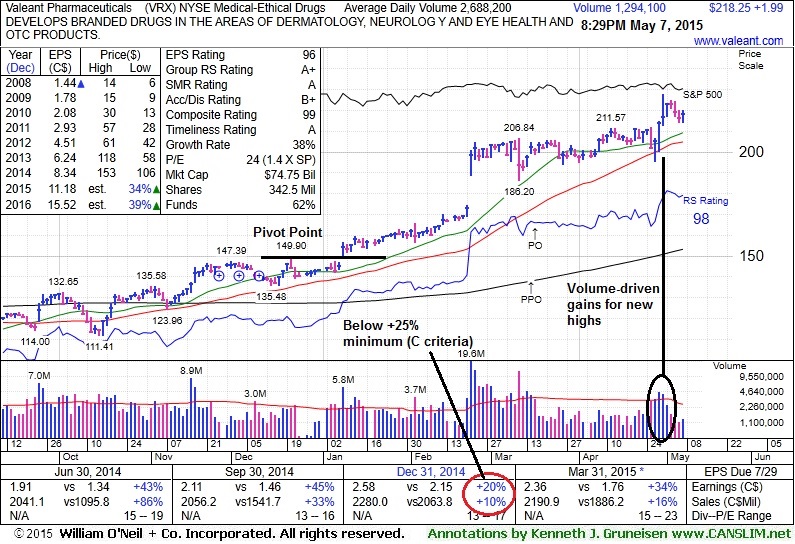
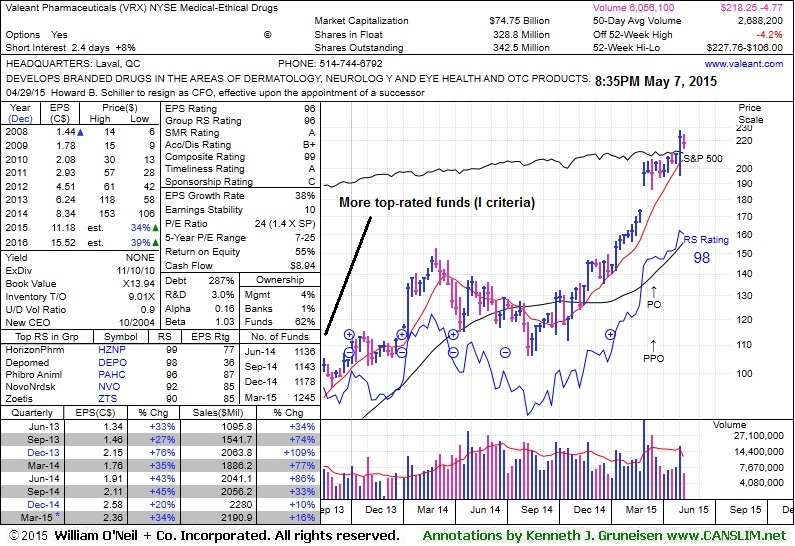
Perched at All-Time High Following Volume-Driven Gains - Thursday, May 07, 2015
Valeant Pharmaceuticals International, Inc. (VRX +$1.99 or +0.92% to $218.25) is perched near its at all-time highs, consolidating after 4 consecutive volume-driven gains into new hihgh territory. It found prompt support its 50-day moving average (DMA) line recently but it did not form a sound base.
The high-ranked Medical - Ethical Drugs firm reported earnings +34% on +16% sales revenues for the Mar '15 quarter, an improvement after Dec '14 earnings below the +25% minimum guideline (C criteria). It was last shown in this FSU section on 4/14/15 with annotated daily and weekly graphs under the headline, "Perched at All-Time High But Concerns Remain After Sub Par Quarter".
It completed a new Public Offering on 3/17/15 and completed an earlier Public Offering on 6/18/13. The upshot of such offerings is that the end result is typically an increase in the total number of institutional owners. The number of top-rated funds owning its shares rose from 1,056 in Mar '14 to 1,245 in Mar '15, a reassuring trend concerning the I criteria. A downturn in FY '07 and '08 earnings (A criteria) was followed by a strong earnings rebound in recent years.
VRX gapped up on 2/23/15 for a considerable volume-driven gain on news it will acquire Salix Pharmaceuticals (SLXP). It was highlighted at $144.84 in yellow in the 1/05/15 mid-day report (read here) with an annotated weekly graph showing a new pivot point cited based on the 12/22/14 high while building a cup-with-handle base. Subsequent gains above the pivot point on 1/08/15 were backed by +71% above average volume triggering a new technical buy signal.
Perched at All-Time High But Concerns Remain After Sub Par Quarter - Tuesday, April 14, 2015
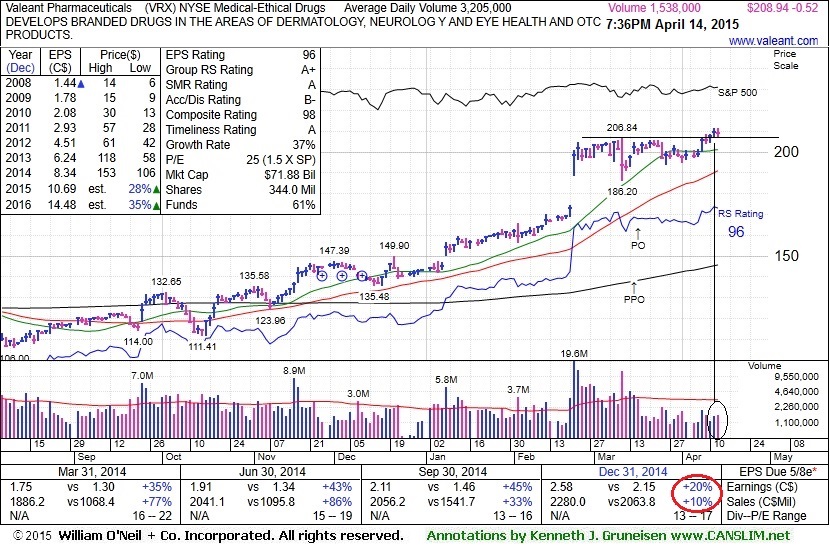
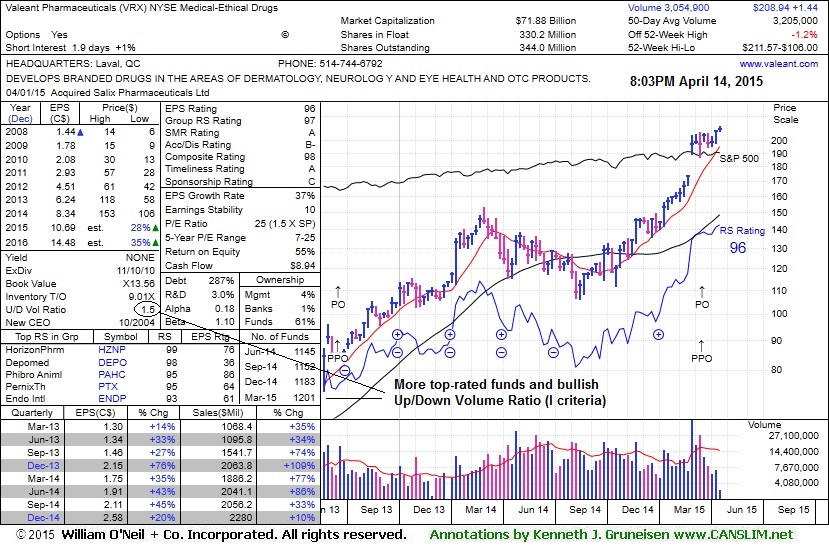
Valeant Pharmaceuticals International, Inc. (VRX -$0.52 to $208.94) is perched near its all-time high. It stubbornly held its ground after completing a new Public Offering on 3/17/15. Earnings for Dec '14 quarter raised concerns, below the +25% minimum guideline (C criteria). Recent low ($186.20 on 3/11/15) and its 50 DMA line define near-term support to watch.
The high-ranked Medical - Ethical Drugs firm was last shown in this FSU section on 3/24/15 with annotated daily and weekly graphs under the headline, "Fundamental Concerns Raised by Weaker Earnings and Sales Increases". It completed a new Public Offering on 3/17/15 while consolidating near its all-time high, very extended from any sound base. It completed an earlier Public Offering on 6/18/13. The upshot of such offerings is that the end result is typically an increase in the total number of institutional owners. Unfortunately, VRX's latest earnings for Dec '14 quarter raised fundamental concerns for fans of the fact-based investment system.
It gapped up on 2/23/15 for a considerable volume-driven gain on news it will acquire Salix Pharmaceuticals (SLXP). It was highlighted at $144.84 in yellow in the 1/05/15 mid-day report (read here) with an annotated weekly graph showing a new pivot point cited based on the 12/22/14 high while building a cup-with-handle base. Subsequent gains above the pivot point on 1/08/15 were backed by +71% above average volume triggering a new technical buy signal.
A downturn in FY '07 and '08 earnings (A criteria) was followed by a strong earnings rebound in recent years. Its current Up/Down Volume Ratio of 1.5 is an unbiased indication its shares have been under accumulation over the past 50 days. The number of top-rated funds owning its shares rose from 1,056 in Mar '14 to 1,201 in Mar '15, a reassuring trend concerning the I criteria.
Fundamental Concerns Raised by Weaker Earnings and Sales Increases - Tuesday, March 24, 2015
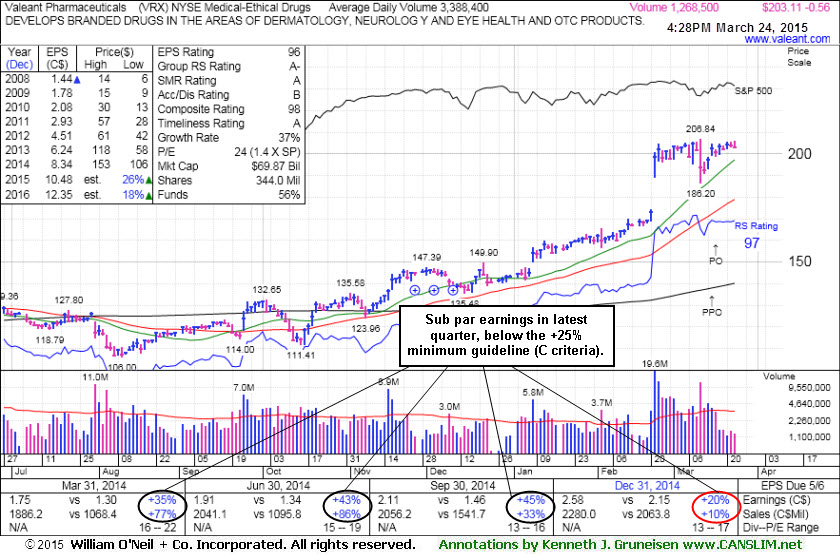
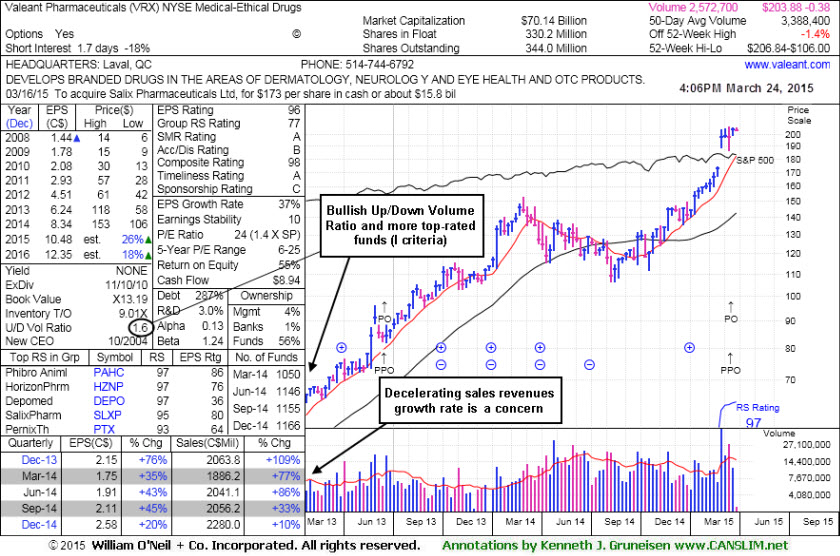
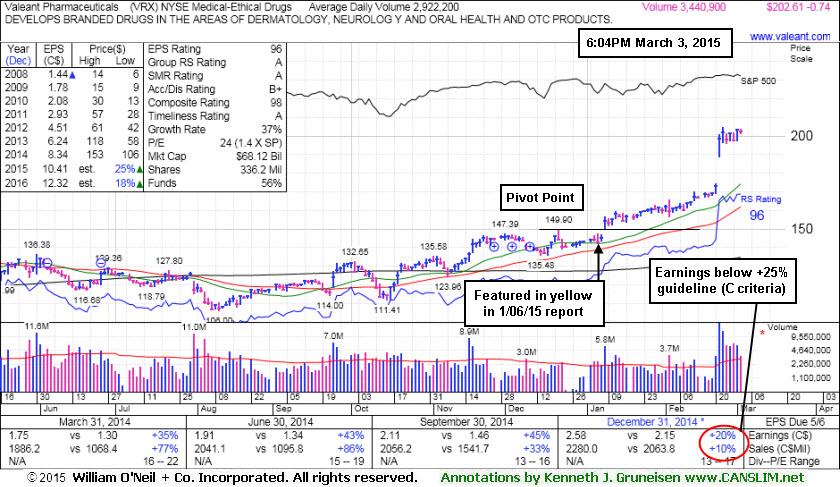
Valeant Pharmaceuticals International, Inc. (VRX -$0.74% or -0.36% to $202.61) completed a new Public Offering on 3/17/15 while consolidating near its all-time high, very extended from any sound base. It completed an earlier Public Offering on 6/18/13. The upshot of such offerings is that the end result is typically an increase in the total number of institutional owners. Unfortunately, VRX's latest earnings for Dec '14 quarter raised fundamental concerns for fans of the fact-based investment system.Its 50-day moving average (DMA) line ($178.90) defines the closest support to watch. The high-ranked Medical - Ethical Drugs firm was last shown in this FSU section on 3/03/15 with annotated daily and weekly graphs under the headline, "Extended From Sound Base; Earnings Below +25% Raised Concerns". It gapped up on 2/23/15 for a considerable volume-driven gain on news it will acquire Salix Pharmaceuticals (SLXP). Following that big gap up gain, however, on 2/24/15 VRX reported earnings for the Dec '14 quarter +20%. That was below the +25% minimum guideline of the fact-based system (C criteria), raising fundamental concerns.
It traded up as much as +42.8% since highlighted at $144.84 in yellow in the 1/05/15 mid-day report (read here) with an annotated weekly graph showing a new pivot point cited based on the 12/22/14 high while building a cup-with-handle base. Subsequent gains above the pivot point on 1/08/15 were backed by +71% above average volume triggering a new technical buy signal.
A downturn in FY '07 and '08 earnings (A criteria) was followed by a strong earnings rebound in recent years. Its current Up/Down Volume Ratio of 1.6 is an unbiased indication its shares have been under accumulation over the past 50 days. The number of top-rated funds owning its shares rose from 1,056 in Mar '14 to 1,166 in Dec '14, a reassuring trend concerning the I criteria.
Extended From Sound Base; Earnings Below +25% Raised Concerns - Tuesday, March 03, 2015
Valeant Pharmaceuticals International, Inc. (VRX -$0.74% or -0.36% to $202.61) is still stubbornly holding its ground since gapping up on 2/23/15 for a considerable volume-driven gain and new all-time highs on news it will acquire Salix Pharmaceuticals (SLXP). It is very extended from any sound base. Its 50-day moving average (DMA) line defines the closest support to watch.
Following its latest big gap up gain, on 2/24/15 VRX reported earnings for the Dec '14 quarter +20%, below the +25% minimum guideline of the fact-based system (C criteria), raising fundamental concerns. VRX was last shown in this FSU section on 2/12/15 with annotated daily and weekly graphs under the headline, "Extended From Prior Highs and Previously Noted Base". Members were reminded - "It is extended from any sound base. It faces no resistance due to overhead supply, however disciplined investors avoid chasing extended stocks more than +5% above prior highs."
It was highlighted in yellow in the 1/05/15 mid-day report (read here) with an annotated weekly graph showing a new pivot point cited based on the 12/22/14 high while building a cup-with-handle base. Subsequent gains above the pivot point on 1/08/15 were backed by +71% above average volume triggering a new technical buy signal.
A downturn in FY '07 and '08 earnings (A criteria) was followed by a strong earnings rebound in recent years. Its current Up/Down Volume Ratio of 2.3 is an unbiased indication its shares have been under accumulation over the past 50 days. The number of top-rated funds owning its shares rose from 1,056 in Mar '14 to 1,167 in Dec '14, a reassuring trend concerning the I criteria. The high-ranked Medical - Ethical Drugs firm completed Public Offering on 6/18/13. The upshot of Public Offerings is that when completed the end result is typically an increase in the total number of institutional owners.

Extended From Prior Highs and Previously Noted Base - Thursday, February 12, 2015
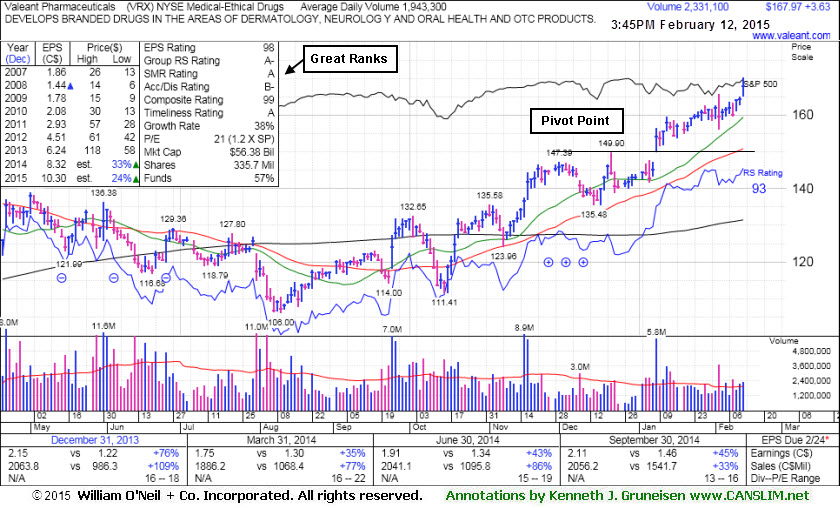
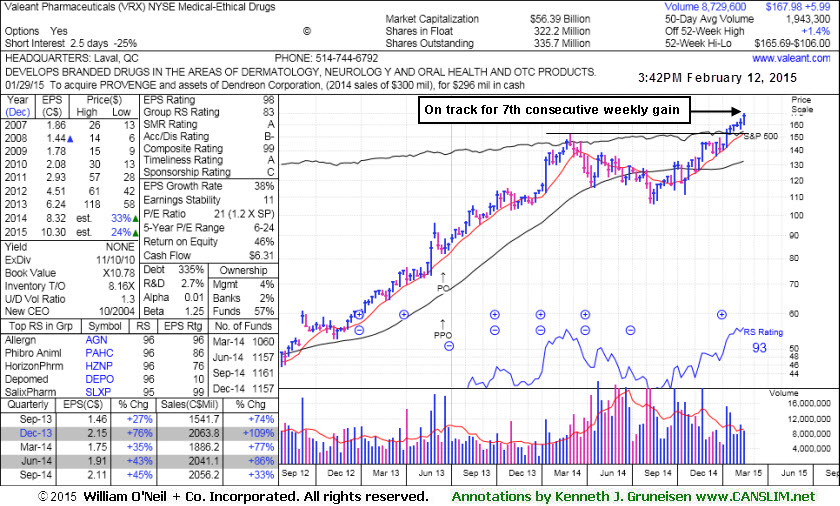
Valeant Pharmaceuticals International, Inc. (VRX +$3.16% or +1.92% to $167.50) hit a new all-time high with above average volume behind today's 3rd consecutive gain. It is extended from any sound base. It faces no resistance due to overhead supply, however disciplined investors avoid chasing extended stocks more than +5% above prior highs. Prior highs and its 50-day moving average (DMA) line define important near-term support to watch on pullbacks.
VRX was last shown in this FSU section on 1/23/15 with annotated daily and weekly graphs under the headline, "Perched at All-Time High Following 3 Quiet Gains". It was highlighted in yellow in the 1/06/15 mid-day report (read here) with an annotated weekly graph showing a new pivot point cited based on the 12/22/14 high while building a cup-with-handle base. Subsequent gains above the pivot point on 1/08/15 were backed by +71% above average volume triggering a new technical buy signal.
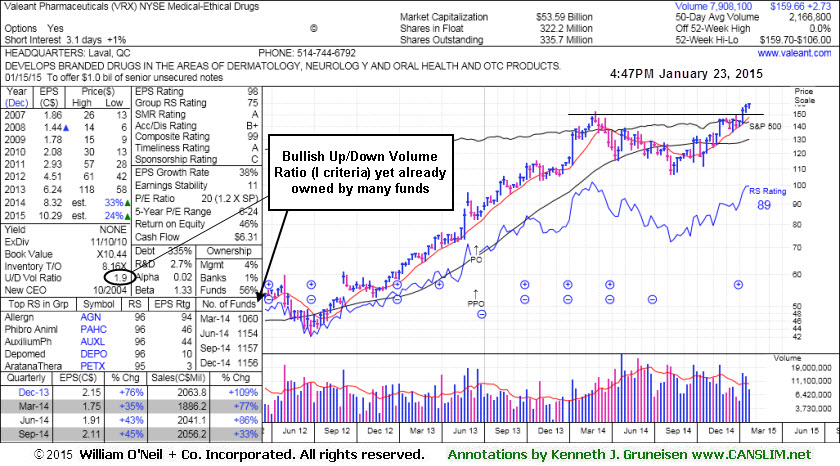
VRX is due to report earnings for the Dec '14 quarter on February 24th. It reported better than expected Sep '14 quarterly results with earnings +45% on +33 sales revenues, above the +25% minimum guideline (C criteria). A downturn in FY '07 and '08 earnings (A criteria) has been followed by a strong earnings rebound in recent years. Its current Up/Down Volume Ratio of 1.3 is an unbiased indication its shares have been under accumulation over the past 50 days. The number of top-rated funds owning its shares rose from 1,056 in Mar '14 to 1,157 in Dec '14, a reassuring trend concerning the I criteria. The high-ranked Medical - Ethical Drugs firm completed Public Offering on 6/18/13. The upshot of Public Offerings is that when completed the end result is typically an increase in the total number of institutional owners.
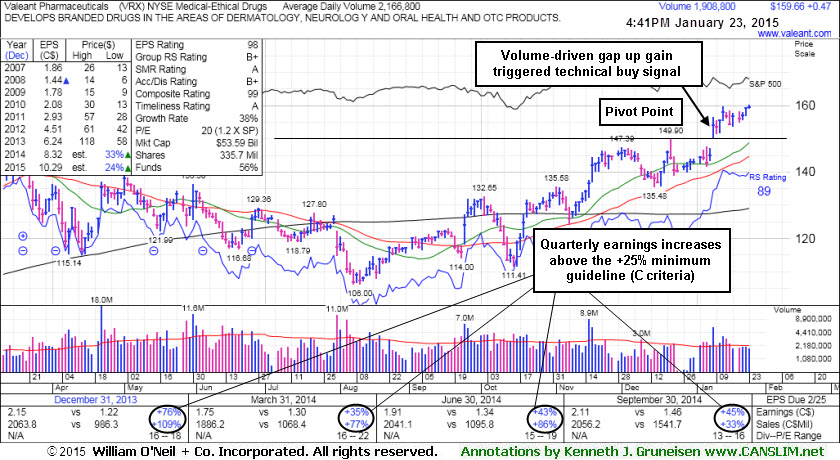
Perched at All-Time High Following 3 Quiet Gains - Friday, January 23, 2015
Valeant Pharmaceuticals International, Inc. (VRX +$0.47 or +0.30% to $159.66) quietly inched further above its "max buy" level and its color code was changed to green. Prior highs in the $149 area define initial support to watch on pullbacks. VRX was last shown in this FSU section on 1/06/15 with annotated daily and weekly graphs under the headline, "Formed a Big Cup-With-Handle Base Setup". It was highlighted in yellow in the 1/06/15 mid-day report (read here) with an annotated weekly graph showing a new pivot point cited based on the 12/22/14 high while building a cup-with-handle base. Subsequent gains above the pivot point on 1/08/15 were backed by +71% above average volume triggering a new technical buy signal. It faces no resistance due to overhead supply, however disciplined investors avoid chasing extended stocks more than +5% above prior highs.VRX went through a deep consolidation below its 200 DMA line then rebounded since dropped from the Featured Stocks list on 4/04/14. It reported better than expected Sep '14 quarterly results with earnings +45% on +33 sales revenues, above the +25% minimum guideline (C criteria). A downturn in FY '07 and '08 earnings (A criteria) has been followed by a strong earnings rebound in recent years. Its current Up/Down Volume Ratio of 1.9 is an unbiased indication its shares have been under accumulation over the past 50 days. The number of top-rated funds owning its shares rose from 1,056 in Mar '14 to 1,156 in Dec '14, a reassuring trend concerning the I criteria. The high-ranked Medical - Ethical Drugs firm completed Public Offering on 6/18/13. The upshot of Public Offerings is that when completed the end result is typically an increase in the total number of institutional owners.
Formed a Big Cup-With-Handle Base Setup - Tuesday, January 06, 2015
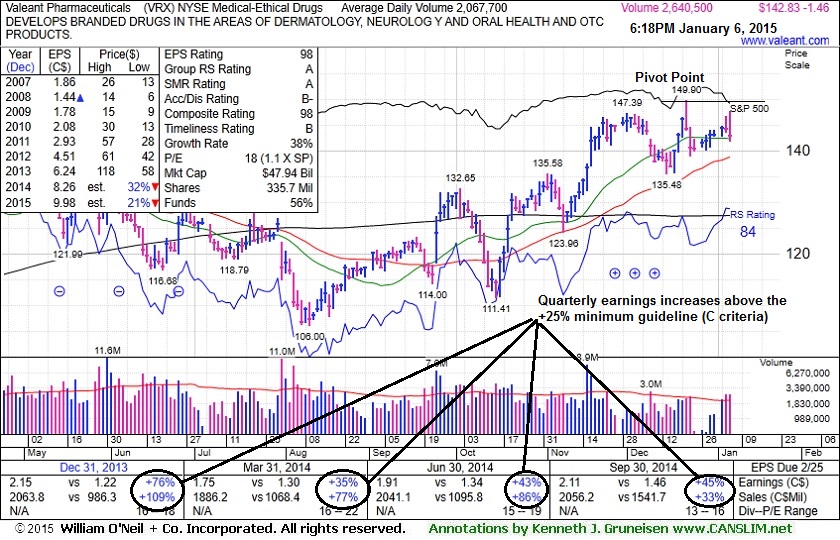
Valeant Pharmaceuticals International, Inc. (VRX -$1.46 or -1.01% to $142.83) was highlighted in yellow in the 1/05/15 mid-day report (read here) with an annotated weekly graph showing a new pivot point cited based on the 12/22/14 high while building a cup-with-handle base. Subsequent volume-driven gains above the pivot point may trigger a new technical buy signal. It faces little resistance due to overhead supply up through the $153 level. Disciplined investors will watch for improvement in the broader market (M criteria) and wait for the specific stock to show fresh proof of institutional buying demand in the future.VRX went through a deep consolidation below its 200 DMA line then rebounded since dropped from the Featured Stocks list on 4/04/14. VRX was last shown in this FSU section on 4/02/14 with annotated daily and weekly graphs under the headline, "After Damaging Losses a Rebound Above 50 DMA Line is Needed ", consolidating below its 50-day moving average (DMA) line after damaging losses triggered a technical sell signal.
It reported better than expected Sep '14 quarterly results with earnings +45% on +33 sales revenues, above the +25% minimum guideline (C criteria). A downturn in FY '07 and '08 earnings (A criteria) was been followed by a strong earnings rebound in recent years. Its current Up/Down Volume Ratio of 1.6 is an unbiased indication its shares have been under accumulation over the past 50 days. The number of top-rated funds owning its shares rose from 1,056 in Mar '14 to 1,127 in Dec '14, a reassuring trend concerning the I criteria. The high-ranked Medical - Ethical Drugs firm completed Public Offering on 6/18/13. The upshot of Public Offerings is that when completed the end result is typically an increase in the total number of institutional owners. Institutional owners are often supportive of their existing positions and will even accumulate more shares when they consolidate near classic support levels like the 50-day and 200-day moving average (DMA) lines, if they are still believers in the company. If too many become pessimistic and decide to unload, this is what ends up sending the stocks slicing through support.
After Damaging Losses a Rebound Above 50 DMA Line is Needed - Wednesday, April 02, 2014
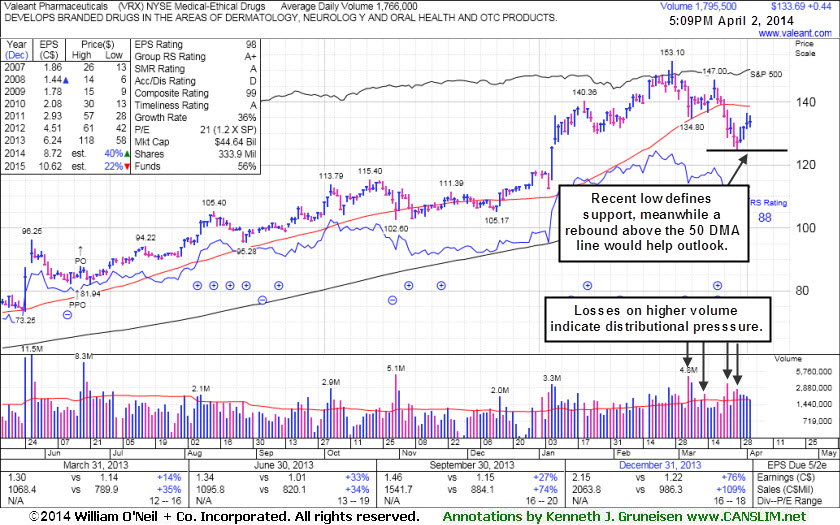
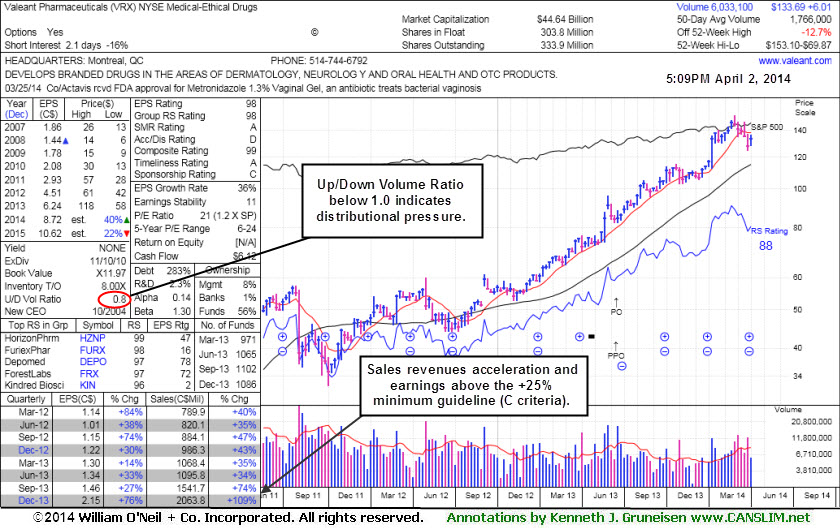
Valeant Pharmaceuticals International, Inc (VRX +$0.44 or +0.33% to $133.69) is still consolidating below its 50-day moving average (DMA) line after recent damaging losses triggered a technical sell signal. Its current Up/Down Volume Ratio of 0.8 is an unbiased indication its shares have faced distributional pressure over the past 50 days. VRX was last shown in this FSU section on 3/17/14 with annotated daily and weekly graphs under the headline, "Finding Support Above 50-Day Moving Average Line". A prompt rebound above the 50 DMA line is needed to help its outlook improve. Subsequent deterioration below the recent low ($124.67 on 3/27/14) would raise more serious concerns and trigger additional sell signals. Meanwhile, patient investors may watch for improvement and wait for a new sound base to possibly develop and be noted in the future.It reported better than expected Dec '13 quarterly results with earnings +76% on +109% sales revenues, above the +25% minimum guideline (C criteria). A downturn in FY '07 and '08 earnings (A criteria) was been followed by a strong earnings rebound in recent years.
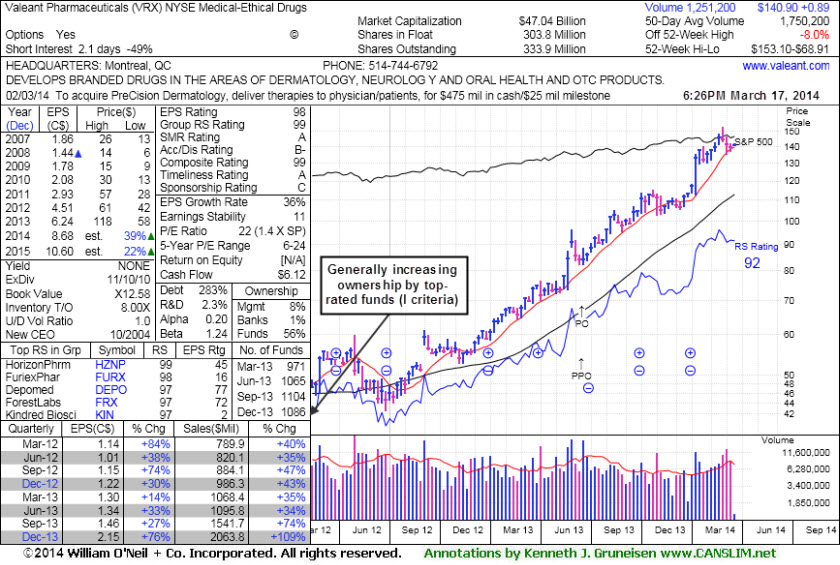
The number of top-rated funds owning its shares rose from 818 in Mar '12 in to 1,086 in Dec '13, a reassuring trend concerning the I criteria. The high-ranked Medical - Ethical Drugs firm completed Public Offering on 6/18/13. The upshot of Public Offerings is that when completed the end result is typically an increase in the total number of institutional owners. Institutional owners are often supportive of their existing positions and will even accumulate more shares when they consolidate near classic support levels like the 50-day and 200-day moving average (DMA) lines, if they are still believers in the company. If too many become pessimistic and decide to unload, this is what ends up sending the stocks slicing through support.
Finding Support Above 50-Day Moving Average Line - Monday, March 17, 2014
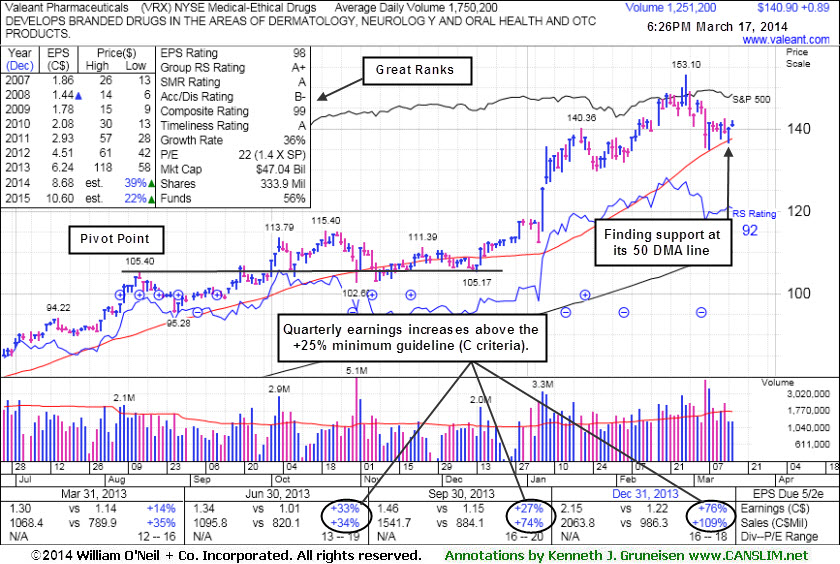
Valeant Pharmaceuticals International, Inc (VRX +$0.89 or +0.64% to $140.90) is consolidating just above its 50-day moving average (DMA) line ($136) which defines important near-term support. A more damaging violation of that important short-term average may raise serious concerns and trigger a more worrisome technical sell signal. It is extended from any sound base. Patient investors may watch for a new sound base to possibly develop and be noted in the future.
VRX was last shown in this FSU section on 2/27/14 with annotated daily and weekly graphs under the headline, "Strong Earnings Report; On Track for 9th Weekly Gain in 10 Weeks". It reported better than expected Dec '13 quarterly results with earnings +76% on +109% sales revenues, an improvement from the Sep '13 quarter which was a notch below the +25% minimum guideline (C criteria). A downturn in FY '07 and '08 earnings (A criteria) was been followed by a strong earnings rebound in recent years.
The number of top-rated funds owning its shares rose from 818 in Mar '12 in to 1,086 in Dec '13, a reassuring trend concerning the I criteria. The high-ranked Medical - Ethical Drugs firm completed Public Offering on 6/18/13. The upshot of Public Offerings is that when completed the end result is typically an increase in the total number of institutional owners. Institutional owners are often supportive of their existing positions and will even accumulate more shares when they consolidate near classic support levels like the 50-day and 200-day moving average (DMA) lines, if they are still believers in the company. If too many become pessimistic and decide to unload, this is what ends up sending the stocks slicing through support.
Strong Earnings Report; On Track for 9th Weekly Gain in 10 Weeks - Thursday, February 27, 2014
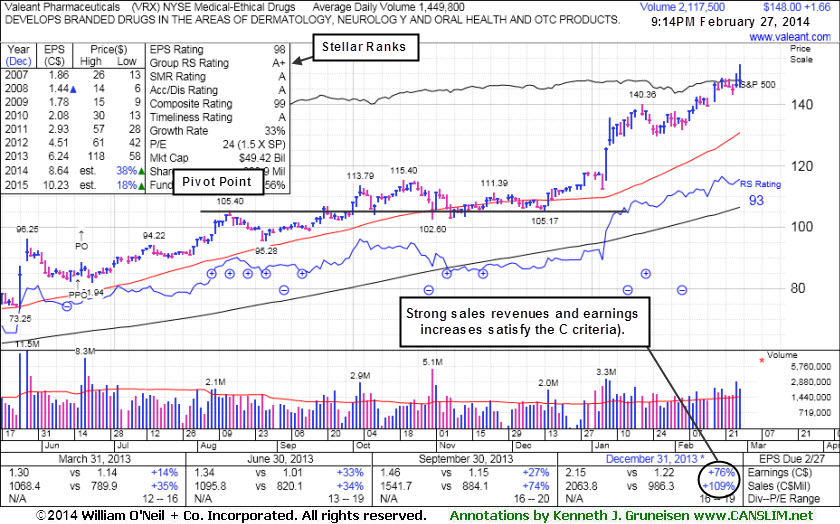
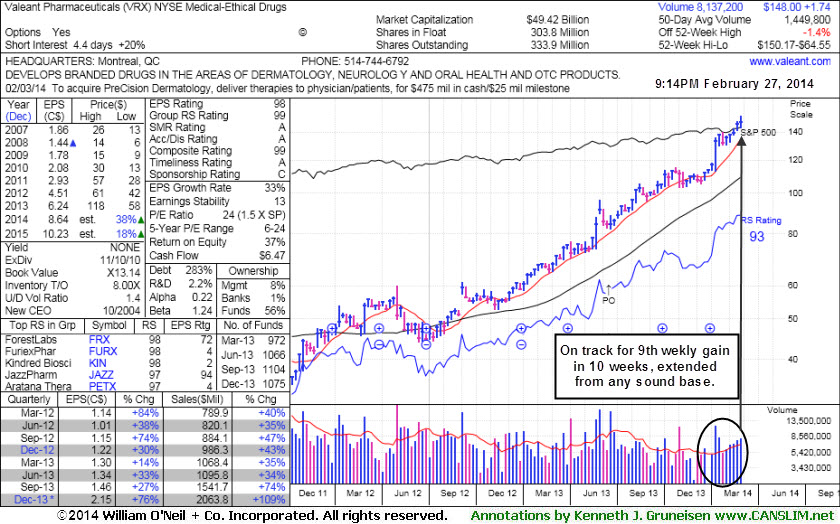
Valeant Pharmaceuticals International, Inc (VRX +$0.20 or +0.15% to $148 .13) reported better than expected Dec '13 quarterly results with earnings +76% on +109% sales revenues. It hit new all-time highs again today and it is very extended from any sound base while on track for its 9th weekly gain in the span of 10 weeks. Its 50-day moving average (DMA) line and recent lows coincide near $130 defining important near-term support to watch. VRX was last shown in this FSU section on 2/10/14 with annotated daily and weekly graphs under the headline, "Hovering Near All-Time Highs Extended From Sound Base". Patient investors may watch for a new sound base to possibly develop and be noted in the future.
The strong quarterly result were a very reassuring follow-up to its earnings increae of +24% on +74% sales revenues for the Sep '13 quarter, a notch below the +25% minimum guideline (C criteria). A downturn in FY '07 and '08 earnings (A criteria) was been followed by a strong earnings rebound in recent years. Return On Equity is currently reported at 37%, well above the 17% minimum guideline of the fact-based system.
The number of top-rated funds owning its shares rose from 818 in Mar '12 in to 1,075 in Dec '13, a reassuring trend concerning the I criteria. The high-ranked Medical - Ethical Drugs firm's shares spiked higher in late May at around the time of M&A news that it would buy Bausch & Lomb for $8.7 billion. It completed Public Offering on 6/18/13. The upshot of Public Offerings is that when completed the end result is typically an increase in the total number of institutional owners. Institutional owners are often supportive of their existing positions and will even accumulate more shares when they consolidate near classic support levels like the 50-day and 200-day moving average (DMA) lines, if they are still believers in the company. If too many become pessimistic and decide to unload, this is what ends up sending the stocks slicing through support.
Prior reports noted - "Investors are taught in the Certification to only buy stocks with a combination of both strong fundamentals and strong technical action, however stocks should be sold based on their technical action only. In this example, more bullish action rewarded patient investors still giving it the benefit of the doubt until any technical sell signals start adding up."
Hovering Near All-Time Highs Extended From Sound Base - Monday, February 10, 2014
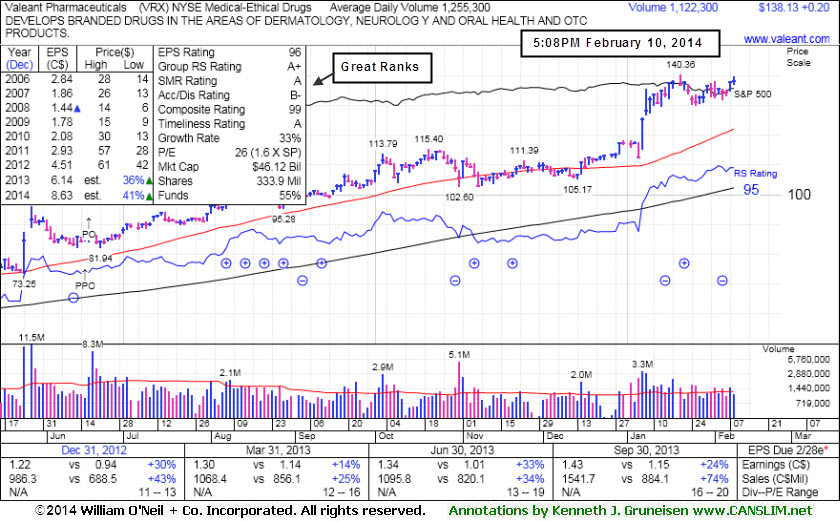
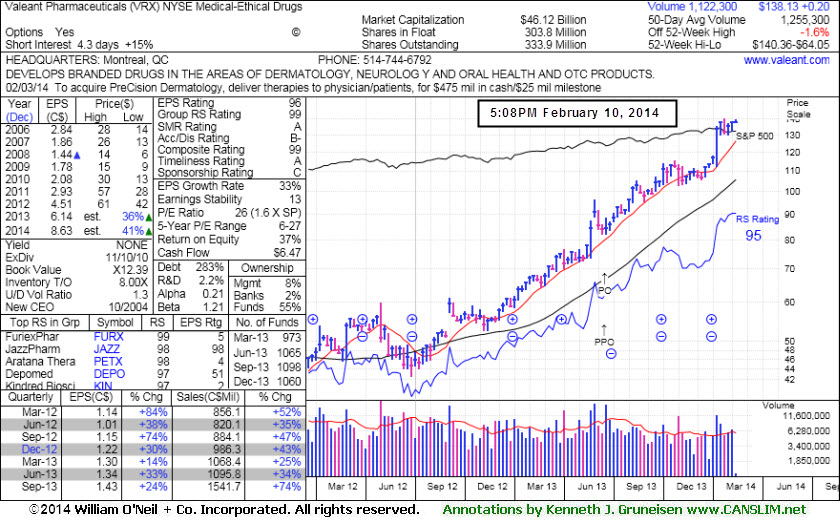
Valeant Pharmaceuticals International, Inc (VRX +$0.20 or +0.15% to $138.13) is hovering quietly near all-time highs, extended from any sound base. Its 50-day moving average (DMA) line ($122) defines near-term support to watch. VRX was last shown in this FSU section on 1/21/14 with annotated daily and weekly graphs under the headline, "Bullish Action Has Continued Despite Fundamental Concerns", as it touched a new all-time high ($140.36) then reversed into the red.
Bullish action continued since it reported earnings +24% on +74% sales revenues for the Sep '13 quarter, a notch below the +25% minimum guideline (C criteria), so prior reports cautioned members -"While it may be forming a sound new base, fundamentals may be an overriding concern." Earnings rose +33% on +34% sales revenues for the Jun '13 quarter, above the +25% minimum earnings guideline (C criteria) a strong follow-up after concerns had been raised by its Mar '13 earnings report with only a +14% earnings increase (see red circles). A downturn in FY '07 and '08 earnings (A criteria) has been followed by a strong earnings rebound in recent years. Return On Equity is currently reported at 37%, well above the 17% minimum guideline of the fact-based system.
The number of top-rated funds owning its shares rose from 818 in Mar '12 in to 1,060 in Dec '13, a reassuring trend concerning the I criteria. The high-ranked Medical - Ethical Drugs firm's shares spiked higher in late May at around the time of M&A news that it would buy Bausch & Lomb for $8.7 billion. It completed Public Offering on 6/18/13. The upshot of Public Offerings is that when completed the end result is typically an increase in the total number of institutional owners. Institutional owners are often supportive of their existing positions and will even accumulate more shares when they consolidate near classic support levels like the 50-day and 200-day moving average (DMA) lines, if they are still believers in the company. If too many become pessimistic and decide to unload, this is what ends up sending the stocks slicing through support.
Prior reports noted - "Investors are taught in the Certification to only buy stocks with a combination of both strong fundamentals and strong technical action, however stocks should be sold based on their technical action only. In this example, more bullish action rewarded patient investors still giving it the benefit of the doubt until any technical sell signals start adding up."
Bullish Action Has Continued Despite Fundamental Concerns - Tuesday, January 21, 2014
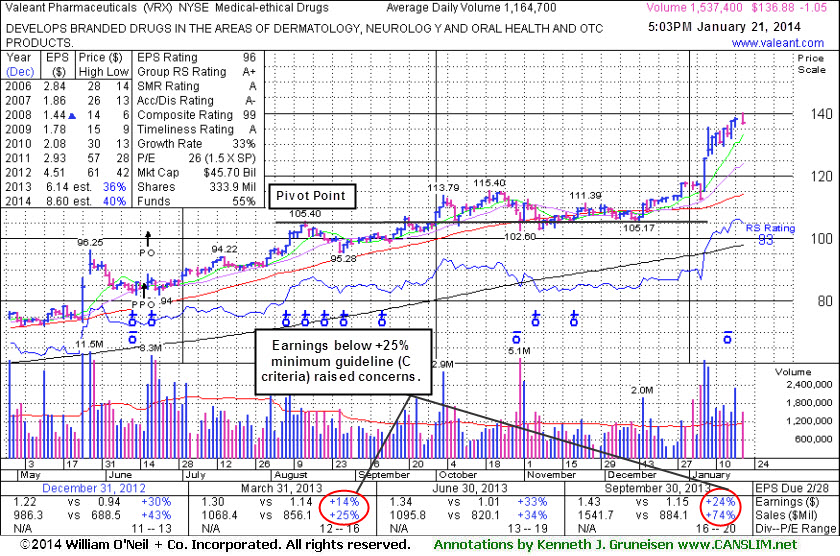
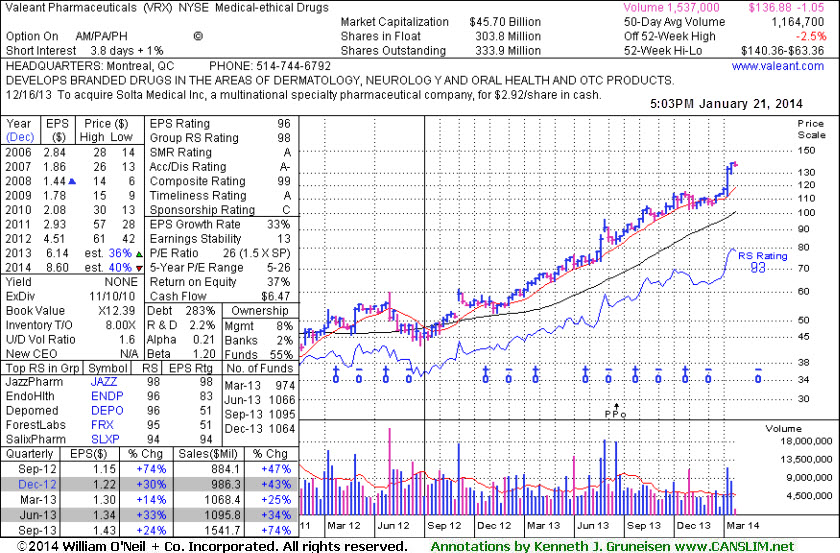
Valeant Pharmaceuticals International, Inc (VRX -$1.05 or -0.76% to $136.88) touched a new all-time high then reversed into the red today. It is extended from any sound base after a recent spurt of volume-driven gains. Its 50-day moving average (DMA) line and prior highs near $115 define near-term support to watch. Bullish action continued since VRX was last shown in this FSU section on 12/18/13 with annotated daily and weekly graphs under the headline, "Rebounding With Volume Backed Gains But Fundamental Concerns Remain". It reported earnings +24% on +74% sales revenues for the Sep '13 quarter, a notch below the +25% minimum guideline (C criteria), so prior reports cautioned members -"While it may be forming a sound new base, fundamentals may be an overriding concern."
Earnings rose +33% on +34% sales revenues for the Jun '13 quarter, above the +25% minimum earnings guideline (C criteria) a strong follow-up after concerns had been raised by its Mar '13 earnings report with only a +14% earnings increase (see red circles). A downturn in FY '07 and '08 earnings (A criteria) has been followed by a strong earnings rebound in recent years. Return On Equity is currently reported at 37%, well above the 17% minimum guideline of the fact-based system.
The number of top-rated funds owning its shares rose from 818 in Mar '12 in to 1,064 in Dec '13, a reassuring trend concerning the I criteria. The high-ranked Medical - Ethical Drugs firm's shares spiked higher in late May at around the time of M&A news that it would buy Bausch & Lomb for $8.7 billion. It completed Public Offering on 6/18/13. The upshot of Public Offerings is that when completed the end result is typically an increase in the total number of institutional owners. Institutional owners are often supportive of their existing positions and will even accumulate more shares when they consolidate near classic support levels like the 50-day and 200-day moving average (DMA) lines, if they are still believers in the company. If too many become pessimistic and decide to unload, this is what ends up sending the stocks slicing through support.
Prior reports noted - "Investors are taught in the Certification to only buy stocks with a combination of both strong fundamentals and strong technical action, however stocks should be sold based on their technical action only. In this example, more bullish action rewarded patient investors still giving it the benefit of the doubt until any technical sell signals start adding up."
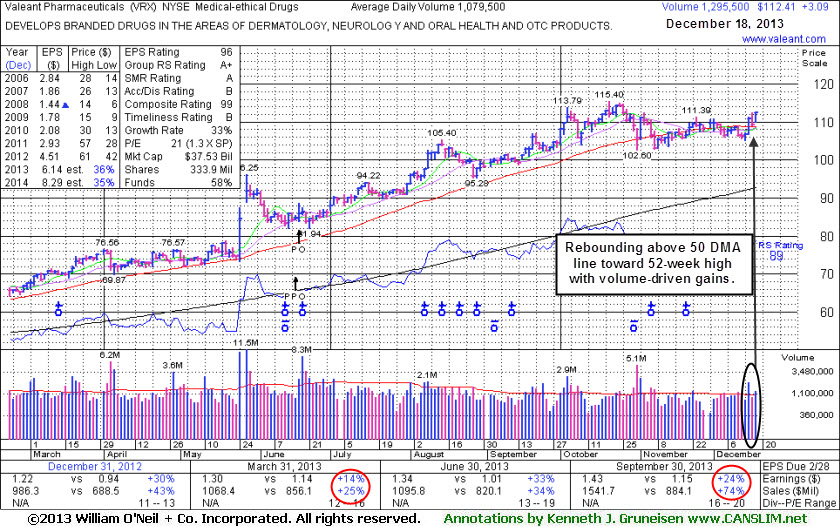
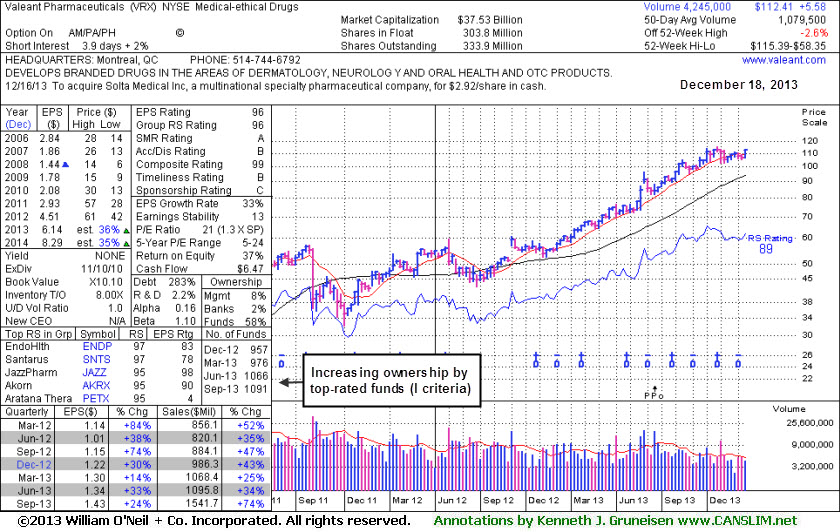
Rebounding With Volume Backed Gains But Fundamental Concerns Remain - Wednesday, December 18, 2013
Valeant Pharmaceuticals International, Inc (VRX +$1.26 or +1.19% to $107.12) rose with above average volume again on Wednesday. It rallied above its 50-day moving average (DMA) line with above average volume behind a considerable gain on 12/16/13 helping its technical stance improve. VRX has been resilient after it reported earnings +24% on +74% sales revenues for the Sep '13 quarter, a notch below the +25% minimum guideline (C criteria). While it may be forming a sound new base, fundamentals may be an overriding concern.
Recent lows in the $102 area define near-term support where a violation may trigger a technical sell signal. VRX was last shown in this FSU section on 11/15/13 with annotated daily and weekly graphs under the headline, "Recent Lows Define Support to Watch Below 50 Day Average". Earnings rose +33% on +34% sales revenues for the Jun '13 quarter, above the +25% minimum earnings guideline (C criteria) a strong follow-up after concerns had been raised by its Mar '13 earnings report with only a +14% earnings increase (see red circles). A downturn in FY '07 and '08 earnings (A criteria) has been followed by a strong earnings rebound in recent years. Return On Equity is currently reported at 37%, well above the 17% minimum guideline of the fact-based system.
The number of top-rated funds owning its shares rose from 818 in Mar '12 in to 1,091 in Sep '13, a reassuring trend concerning the I criteria. The high-ranked Medical - Ethical Drugs firm's shares spiked higher in late May at around the time of M&A news that it would buy Bausch & Lomb for $8.7 billion. It completed Public Offering on 6/18/13. The upshot of Public Offerings is that when completed the end result is typically an increase in the total number of institutional owners. Institutional owners are often supportive of their existing positions and will even accumulate more shares when they consolidate near classic support levels like the 50-day and 200-day moving average (DMA) lines, if they are still believers in the company. If too many become pessimistic and decide to unload, this is what ends up sending the stocks slicing through support.
Prior reports noted - "Investors are taught in the Certification to only buy stocks with a combination of both strong fundamentals and strong technical action, however stocks should be sold based on their technical action only. In this example, more bullish action rewarded patient investors still giving it the benefit of the doubt until any technical sell signals start adding up."
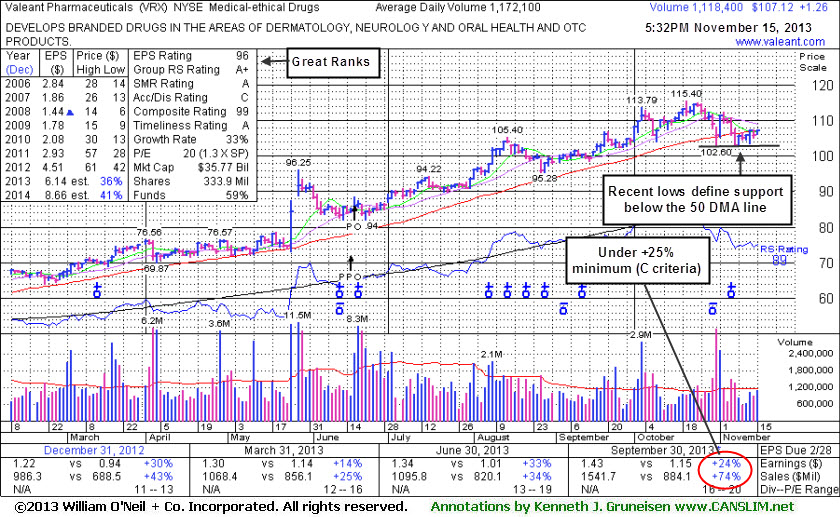
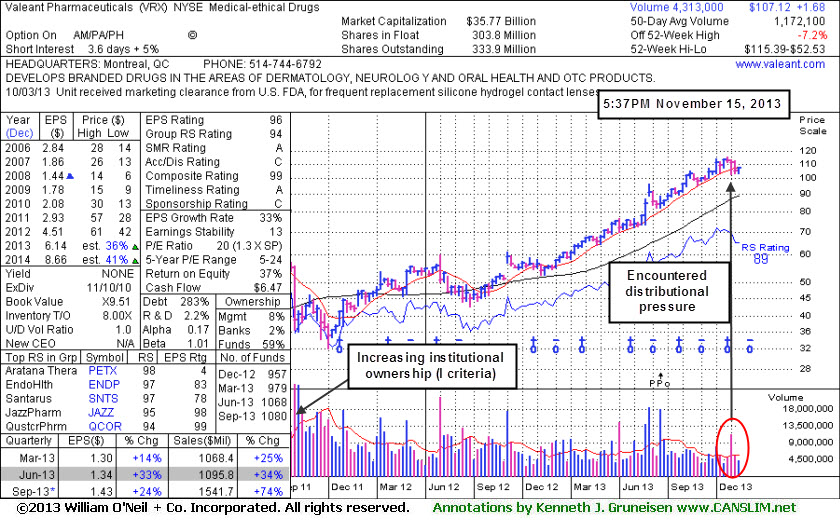
Recent Lows Define Support to Watch Below 50 Day Average - Friday, November 15, 2013
Valeant Pharmaceuticals International, Inc (VRX +$1.26 or +1.19% to $107.12) has been consolidating near its 50-day moving average (DMA) line. Recent lows define important near-term support to watch where more damaging volume-driven losses may trigger worrisome technical sell signals. Recently it reported earnings +24% on +74% sales revenues for the Sep '13 quarter, a notch below the +25% minimum guideline (C criteria). It was last shown in this FSU section on 10/10/13 with an annotated graph under the headline, "Found Support Above Prior Highs on Pullback".It reported earnings +33% on +34% sales revenues for the Jun '13 quarter, above the +25% minimum earnings guideline (C criteria). Concerns had been raised by its Mar '13 earnings report with only a +14% earnings increase, below the +25% minimum guideline (C criteria) for buy candidates. A downturn in FY '07 and '08 earnings (A criteria) has been followed by a strong earnings rebound in recent years. Return On Equity is currently reported at 37%, well above the 17% minimum guideline of the fact-based system.
The number of top-rated funds owning its shares rose from 818 in Mar '12 in to 1,080 in Sep '13, a reassuring trend concerning the I criteria. The high-ranked Medical - Ethical Drugs firm's shares spiked higher in late May at around the time of M&A news that it would buy Bausch & Lomb for $8.7 billion. It completed Public Offering on 6/18/13. The upshot of Public Offerings is that when completed the end result is typically an increase in the total number of institutional owners. Institutional owners are often supportive of their existing positions and will even accumulate more shares when they consolidate near classic support levels like the 50-day and 200-day moving average (DMA) lines, if they are still believers in the company. If too many become pessimistic and decide to unload, this is what ends up sending the stocks slicing through support.
Prior reports noted - "Investors are taught in the Certification to only buy stocks with a combination of both strong fundamentals and strong technical action, however stocks should be sold based on their technical action only. In this example, more bullish action rewarded patient investors still giving it the benefit of the doubt until any technical sell signals start adding up."
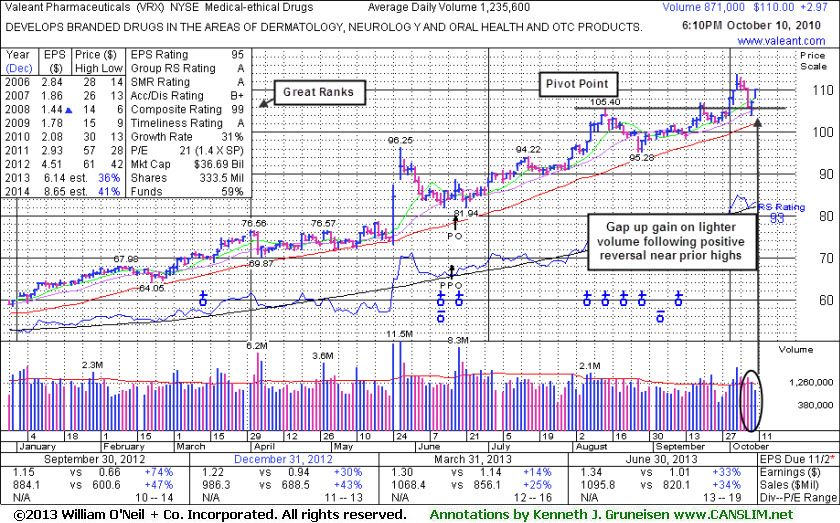
Found Support Above Prior Highs on Pullback - Thursday, October 10, 2013
Valeant Pharmaceuticals International, Inc (VRX +$2.97 or +2.77% to $110.00) posted a gain on lighter volume today. On the prior session it managed a "positive reversal" after testing prior highs defining important support in the $105 area. It was last shown in this FSU section on 9/11/13 with an annotated graph under the headline, "Insider Buying While Forming New 'Late Stage' Base". A new pivot point was cited based on its 8/14/13 high plus 10 cents. Subsequent gains above the pivot point lacked great volume until it was already getting extended from the risker "late-stage" base, then it endured mild distributional pressure. Deterioration into the prior base would raise more serious concerns, and disciplined investors always should follow strict selling rules.
Recent insider buying (indicated by circles with plus signs above) while trading near its highs has been noted as an encouraging sign. It reported earnings +33% on +34% sales revenues for the Jun '13 quarter, above the +25% minimum earnings guideline (C criteria). Concerns had been raised by its Mar '13 earnings report with only a +14% earnings increase, below the +25% minimum guideline (C criteria) for buy candidates. A downturn in FY '07 and '08 earnings (A criteria) has been followed by a strong earnings rebound in recent years. Return On Equity is currently reported at 37%, well above the 17% minimum guideline of the fact-based system.
The number of top-rated funds owning its shares rose from 818 in Mar '12 in to 1,063 in Jun '13, a reassuring trend concerning the I criteria. Its current Up/Down Volume Ratio of 1.7 is an unbiased indication that its shares have been under accumulation over the past 50 days.
The high-ranked Medical - Ethical Drugs firm's shares spiked higher in late May at around the time of M&A news that it would buy Bausch & Lomb for $8.7 billion. That move and other recent acquisitions resulted in stronger earnings in the latest quarterly comparison.
It completed Public Offering on 6/18/13. The upshot of Public Offerings is that when completed the end result is typically an increase in the total number of institutional owners. Institutional owners are often supportive of their existing positions and will even accumulate more shares when they consolidate near classic support levels like the 50-day and 200-day moving average (DMA) lines, if they are still believers in the company. If too many become pessimistic and decide to unload, this is what ends up sending the stocks slicing through support.
Prior reports noted - "Investors are taught in the Certification to only buy stocks with a combination of both strong fundamentals and strong technical action, however stocks should be sold based on their technical action only. In this example, more bullish action rewarded patient investors still giving it the benefit of the doubt until any technical sell signals start adding up."
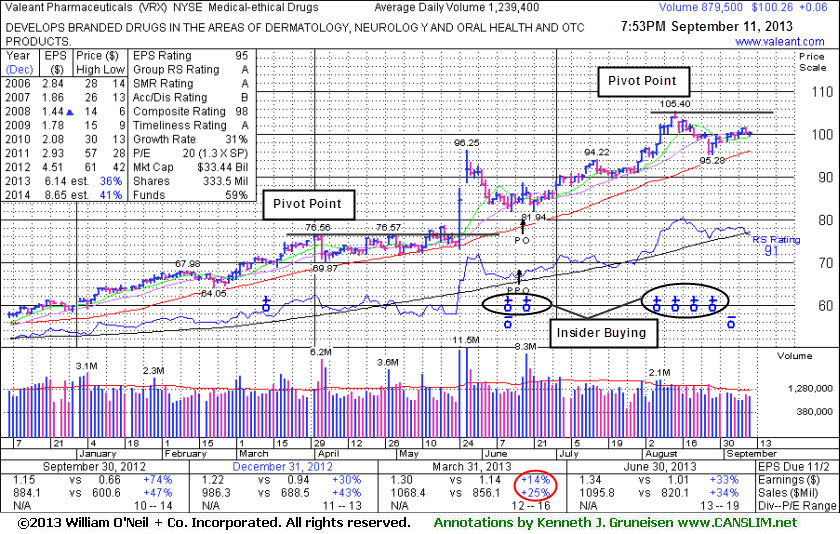
Insider Buying While Forming New "Late Stage" Base - Wednesday, September 11, 2013
Valeant Pharmaceuticals International, Inc (VRX +$0.06 or +0.06% to $100.26) is holding its ground -4.9% off its 52-week high. Recent insider buying (indicated on the annotated graph) while trading near its highs has been noted as an encouraging sign. A new pivot point is cited based on its 8/14/13 high plus 10 cents. Subsequent volume-driven gains above the pivot point may trigger a new (or add-on) technical buy signal, albeit from a risker "late-stage" base. Prior highs near $96 and its 50-day moving average (DMA) line define support to watch on pullbacks.
It reported earnings +33% on +34% sales revenues for the Jun '13 quarter, above the +25% minimum earnings guideline (C criteria). It was last shown in this FSU section on 8/15/13 with an annotated graph under the headline, "Latest Results Showed Better Earnings Growth", after rallying into new 52-week high territory with 9 gains in the span of 10 sessions.
Concerns had been raised by its Mar '13 earnings report with only a +14% earnings increase, below the +25% minimum guideline (C criteria) for buy candidates. A downturn in FY '07 and '08 earnings (A criteria) has been followed by a strong earnings rebound in recent years. Return On Equity is currently reported at 37%, well above the 17% minimum guideline of the fact-based system.
The number of top-rated funds owning its shares rose from 818 in Mar '12 in to 1,060 in Jun '13, a reassuring trend concerning the I criteria. Its current Up/Down Volume Ratio of 1.6 is an unbiased indication that its shares have been under accumulation over the past 50 days.
The high-ranked Medical - Ethical Drugs firm's shares spiked higher in late May at around the time of M&A news that it would buy Bausch & Lomb for $8.7 billion. That move and other recent acquisitions resulted in stronger earnings in the latest quarterly comparison.
It completed Public Offering on 6/18/13. The upshot of Public Offerings is that when completed the end result is typically an increase in the total number of institutional owners. Institutional owners are often supportive of their existing positions and will even accumulate more shares when they consolidate near classic support levels like the 50-day and 200-day moving average (DMA) lines, if they are still believers in the company. If too many become pessimistic and decide to unload, this is what ends up sending the stocks slicing through support.
Prior reports noted - "Investors are taught in the Certification to only buy stocks with a combination of both strong fundamentals and strong technical action, however stocks should be sold based on their technical action only. In this example, more bullish action rewarded patient investors still giving it the benefit of the doubt until any technical sell signals start adding up."
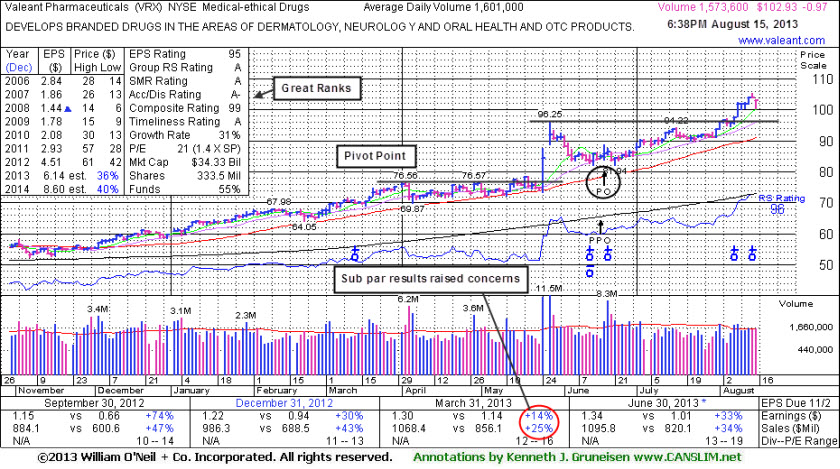
Latest Results Showed Better Earnings Growth - Thursday, August 15, 2013
Valeant Pharmaceuticals International, Inc (VRX -$0.97 or -0.93% to $102.93) is consolidating after rallying into new 52-week high territory with 9 gains in the span of 10 sessions. No resistance remains due to overhead supply. It got extended after "wedging" higher with recent gains lacking great volume conviction while rising from a previously noted cup-with-handle base pattern. Prior highs near $96 define initial support to watch. It reported earnings +33% on +34% sales revenues for the Jun '13 quarter, above the +25% minimum earnings guideline (C criteria), a strong follow-up to sub par Mar '13 results.
Due to fundamental concerns no new pivot point was cited during the recent base. It was last shown in this FSU section on 7/23/13 with an annotated graph under the headline, "Formed New Base But Fundamental Concerns Remain". Concerns were raised by its Mar '13 earnings report with only a +14% earnings increase, below the +25% minimum guideline (C criteria) for buy candidates. A downturn in FY '07 and '08 earnings (A criteria) has been followed by a strong earnings rebound in recent years. Return On Equity is currently reported at 37%, well above the 17% minimum guideline of the fact-based system.
The number of top-rated funds owning its shares rose from 818 in Mar '12 in to 1,038 in Jun '13, a reassuring trend concerning the I criteria. Its current Up/Down Volume Ratio of 1.8 is an unbiased indication that its shares have been under accumulation over the past 50 days.
The high-ranked Medical - Ethical Drugs firm's shares spiked higher in late May at around the time of M&A news that it would buy Bausch & Lomb for $8.7 billion. That move and other recent acquisitions resulted in stronger earnings in the latest quarterly comparison.
It completed Public Offering on 6/18/13. The upshot of Public Offerings is that when completed the end result is typically an increase in the total number of institutional owners. Institutional owners are often supportive of their existing positions and will even accumulate more shares when they consolidate near classic support levels like the 50-day and 200-day moving average (DMA) lines, if they are still believers in the company. If too many become pessimistic and decide to unload, this is what ends up sending the stocks slicing through support.
Prior reports noted - "Investors are taught in the Certification to only buy stocks with a combination of both strong fundamentals and strong technical action, however stocks should be sold based on their technical action only. In this example, more bullish action rewarded patient investors still giving it the benefit of the doubt until any technical sell signals start adding up."
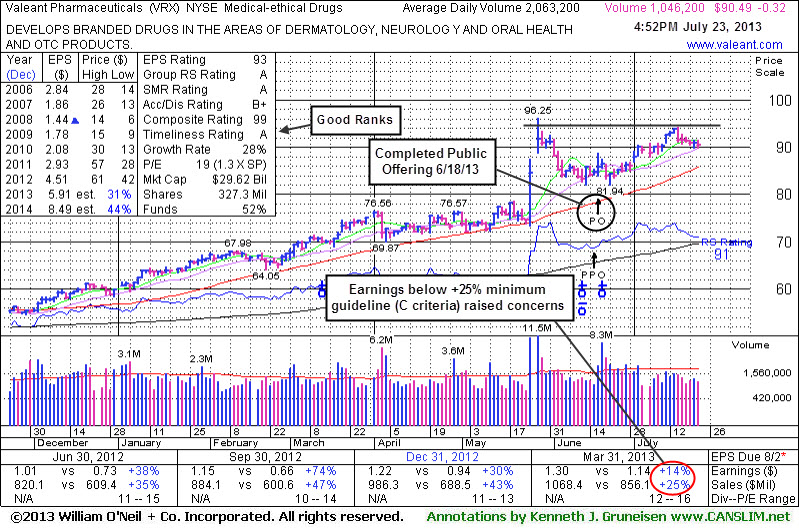
Formed New Base But Fundamental Concerns Remain - Tuesday, July 23, 2013
Valeant Pharmaceuticals International, Inc (VRX -$0.32 or -0.35% to $90.49) is hovering within close striking distance of its 52-week high with volume totals cooling in recent weeks. It formed a cup-with-handle base over the past 8 weeks or more, however no new pivot point has been cited. Technically, it looks like a decent set-up with no resistance remaining due to overhead supply. However, fundamentally, concerns were raised by its Mar '13 earnings report with only a +14% earnings increase, below the +25% minimum guideline (C criteria) for buy candidates. It has wedged higher with gains lacking great volume conviction since last shown in this FSU section on 7/05/13 with an annotated graph under the headline, "Holding Ground Following Offering and M&A News".The high-ranked Medical - Ethical Drugs firm's shares spiked higher in late May at around the time of M&A news that it would buy Bausch & Lomb for $8.7 billion. It completed Public Offering on 6/18/13. The upshot of Public Offerings is that when completed the end result is typically an increase in the total number of institutional owners. Institutional owners are often supportive of their existing positions and will even accumulate more shares when they consolidate near classic support levels like the 50-day and 200-day moving average (DMA) lines, if they are still believers in the company. If too many become pessimistic and decide to unload, this is what ends up sending the stocks slicing through support.
Prior reports noted - "Investors are taught in the Certification to only buy stocks with a combination of both strong fundamentals and strong technical action, however stocks should be sold based on their technical action only. In this example, more bullish action rewarded patient investors still giving it the benefit of the doubt until any technical sell signals start adding up."
Time alone will tell if Valeant's recent acquisitions will result in stronger earnings in the upcoming quarterly comparisons. It will report its Second Quarter results on August 7, 2013. Quarterly earnings increases (C criteria) had been strong and well above the +25% guideline until the Mar '13 period. A downturn in FY '07 and '08 earnings (A criteria) has been followed by a strong earnings rebound in recent years. Return On Equity is currently reported at 37%, well above the 17% minimum guideline of the fact-based system.
The number of top-rated funds owning its shares rose from 818 in Mar '12 in to 998 in Jun '13, a reassuring trend concerning the I criteria. Its current Up/Down Volume Ratio of 2.0 is an unbiased indication that its shares have been under accumulation over the past 50 days.
Holding Ground Following Offering and M&A News - Friday, July 05, 2013
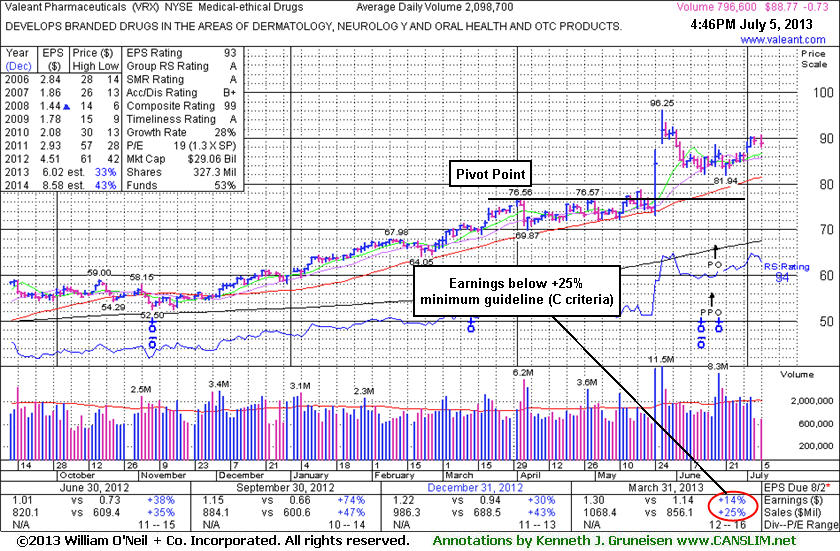
Valeant Pharmaceuticals International, Inc (VRX -$0.73 or -0.82% to $88.77) held its ground above its 50-day moving average (DMA) line ($81.54) and well above prior highs in the $76 area since last shown in this FSU section on 6/24/13 with an annotated graph under the headline, "Completed Public Offering Following M&A News." The high-ranked Medical - Ethical Drugs firm's shares spiked higher in late May at around the time of M&A news that it would buy Bausch & Lomb for $8.7 billion. Time alone will tell if Valeant's recent acquisitions will result in stronger earnings in the upcoming quarterly comparisons. Quarterly earnings increases (C criteria) had been strong and well above the +25% guideline until the Mar '13 period, which only showed a +14% earnings increase (see red circle) over the year-ago period. A downturn in FY '07 and '08 earnings (A criteria) has been followed by a strong earnings rebound in recent years. Return On Equity is currently reported at 37%, well above the 17% minimum guideline of the fact-based system.Prior reports noted - "Investors are taught in the Certification to only buy stocks with a combination of both strong fundamentals and strong technical action, however stocks should be sold based on their technical action only. In this example, more bullish action rewarded patient investors still giving it the benefit of the doubt until any technical sell signals start adding up."
The number of top-rated funds owning its shares rose from 818 in Mar '12 in to 977 in Jun '13, a reassuring trend concerning the I criteria. It completed a Public Offering on 6/18/13, shortly after the M&A news. The upshot on Public Offerings is that when they are completed the end result is typically an increase in the total number of institutional owners. Institutional owners are often supportive of their existing positions and will even accumulate more shares when they consolidate near classic support levels like the 50 and 200 DMA lines, if they are still believers in the company. If too many become pessimistic and decide to unload, this is what ends up sending the stocks slicing through support.
Completed Public Offering Following M&A News - Monday, June 24, 2013
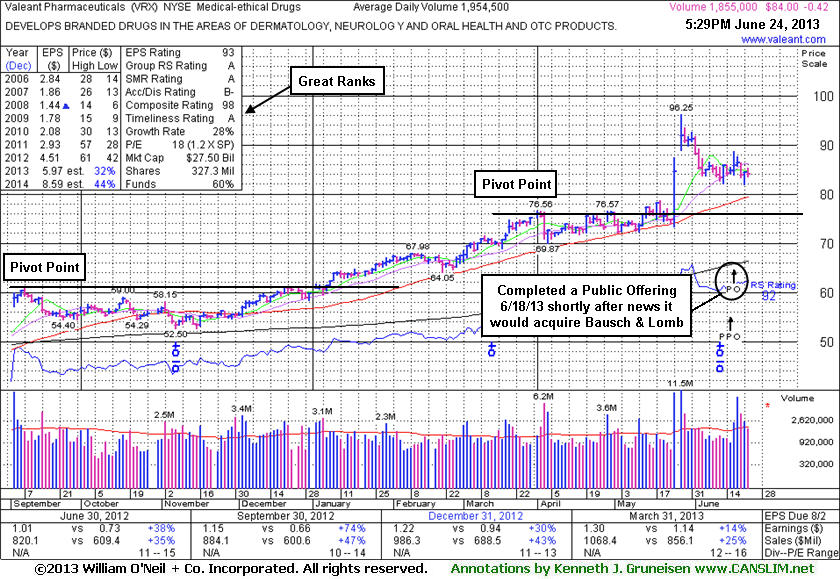
Valeant Pharmaceuticals International, Inc (VRX -$0.42 or -0.50% to $84.00) completed a new Public Offering on 6/18/13. Concerns were raised by its sub par Mar '13 earnings report. Its 50 DMA line ($78.95) defines near-term support above prior highs in the $76 area. VRX was last shown in this FSU section on 6/07/13 with an annotated graph under the headline, "Rallied on Recently Announced Acquisition News", after the high-ranked Medical - Ethical Drugs firm announced plans to buy Bausch & Lomb for $8.7 billion. Time alone will tell if its recent acquisitions will result in stronger earnings in the upcoming quarterly comparisons.Prior reports noted - "Investors are taught in the Certification to only buy stocks with a combination of both strong fundamentals and strong technical action, however stocks should be sold based on their technical action only. In this example, more bullish action rewarded patient investors still giving it the benefit of the doubt until any technical sell signals start adding up."
The number of top-rated funds owning its shares rose from 818 in Mar '12 in to 968 in Mar '13, a reassuring trend concerning the I criteria. Quarterly earnings increases (C criteria) had been strong and well above the +25% guideline until the Mar '13 period, which only showed a +14% earnings increase (see red circle) over the year-ago period. A downturn in FY '07 and '08 earnings (A criteria) has been followed by a strong earnings rebound in recent years. Return On Equity is currently reported at 37%, well above the 17% minimum guideline of the fact-based system.
Rallied on Recently Announced Acquisition News - Friday, June 07, 2013
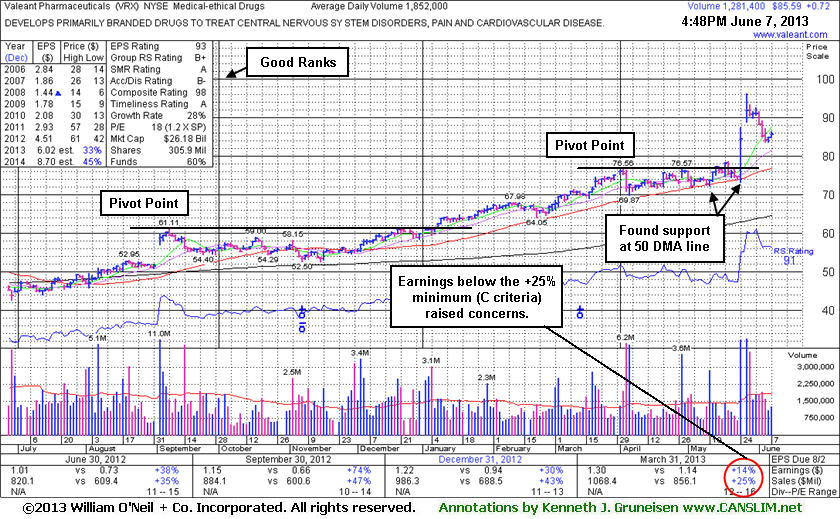
Valeant Pharmaceuticals International, Inc (VRX +$0.72 or +0.85% to $85.59) is extended from prior highs and prior reports cautioned investors. However, the high-ranked Medical - Ethical Drugs firm recently rallied as it announced plans to buy Bausch & Lomb for $8.7 billion. Time alone will tell if its recent acquisitions will result in stronger earnings in the upcoming quarterly comparisons.
VRX was last shown in this FSU section on 5/17/13 with an annotated graph under the headline, "Bullish Action Continues Following Sub Par Earnings for Mar '13 Period". Light volume at the time was noted as a sign that very few investors were headed for the exit. Prior reports recently cautioned - "Sub par earnings for the Mar '13 quarter below the +25% minimum guideline (C criteria) raised fundamental concerns." Investors are taught in the Certification to only buy stocks with a combination of both strong fundamentals and strong technical action, however stocks should be sold based on their technical action only. In this example, more bullish action rewarded patient investors still giving it the benefit of the doubt until any technical sell signals start adding up.
The number of top-rated funds owning its shares rose from 818 in Mar '12 in to 966 in Mar '13, a reassuring trend concerning the I criteria. Quarterly earnings increases (C criteria) had been strong and well above the +25% guideline until the Mar '13 period, which only showed a +14% earnings increase (see red circle) over the year-ago period. A downturn in FY '07 and '08 earnings (A criteria) has been followed by a strong earnings rebound in recent years. Return On Equity is currently reported at 37%, well above the 17% minimum guideline of the fact-based system.
Bullish Action Continues Following Sub Par Earnings for Mar '13 Period - Friday, May 17, 2013
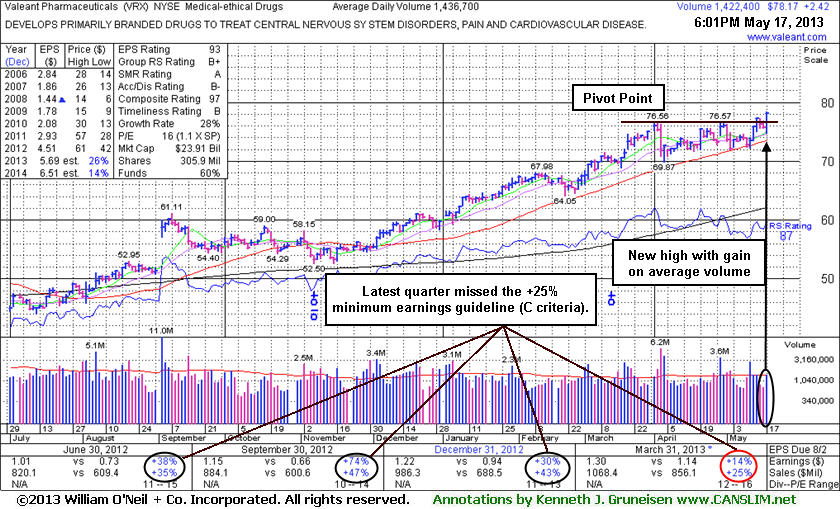
Valeant Pharmaceuticals (VRX +$2.42 or +3.19% to $78.17) finished at a new high with a solid gain today on average volume following recent losses on light volume noted as a sign that very few investors have been headed for the exit. Prior reports recently cautioned - "Sub par earnings for the Mar '13 quarter below the +25% minimum guideline (C criteria) raised fundamental concerns." Investors are taught in the Certification to only buy stocks with a combination of both strong fundamentals and strong technical action, however stocks should be sold based on their technical action only. In this example, bullish action has continued to reward patient investors still giving it the benefit of the doubt until any technical sell signals start adding up. Its recent low ($69.87 on 4/04/13) defines important near-term support below its 50 DMA line (now $73.46) where violations may trigger technical sell signals.The high-ranked Medical - Ethical Drugs firm was last shown in this FSU section on 4/30/13 with an annotated graph under the headline, "Earnings News Due Soon; New Base Has Formed ". It did not produce a powerful volume-driven gain above its latest pivot point cited based on its 4/02/13 high plus 10 cents, however some recent gains were backed by above average volume while its recent losses were mostly on lighter than average volume. On 4/03/13 it pulled back on heavy volume after agreeing to an increased offer price of $24.00 cash for it to acquire Obagi Medical Products, yet it stayed above its 50 DMA line.
The number of top-rated funds owning its shares rose from 818 in Mar '12 in to 960 in Mar '13, a reassuring trend concerning the I criteria. Quarterly earnings increases (C criteria) had been strong and well above the +25% guideline until the Mar '13 period, which only showed a +14% earnings increase (see red circle) over the year-ago period. A downturn in FY '07 and '08 earnings (A criteria) has been followed by a strong earnings rebound in recent years. Return On Equity is currently reported at 37%, well above the 17% minimum guideline of the fact-based system.
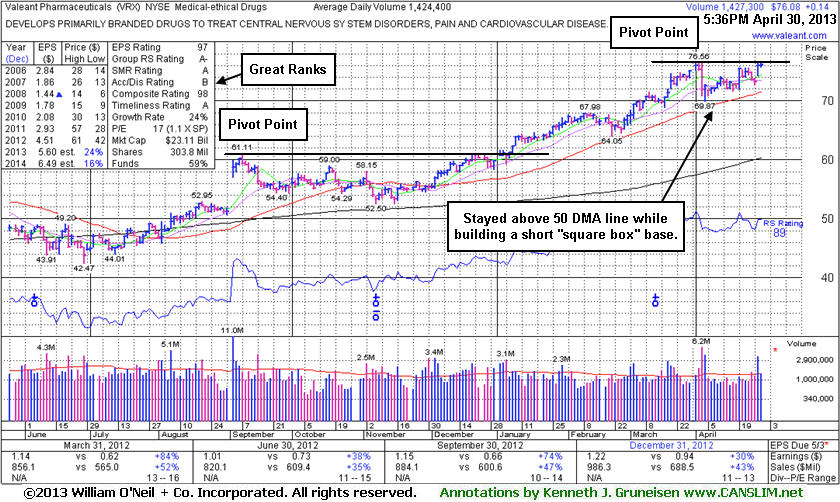
Earnings News Due Soon; New Base Has Formed - Tuesday, April 30, 2013
Valeant Pharmaceuticals (VRX +$0.14 or +0.18% to $76.08) held its ground today following a gap up and volume-driven gain on the prior session. It has formed a short square box base and the color code was changed to yellow with new pivot point cited based on its 4/02/13 high plus 10 cents. Subsequent volume-driven gains above its pivot point may trigger a new (or add-on) technical buy signal. Its recent the recent low ($69.87 on 4/04/13) defines important near-term support below its 50-day moving average (DMA) line where violations may trigger technical sell signals.Keep in mind that VRX is due to report earnings before the open on Thursday, May 2nd, and volume and volatility often increase near earnings news. The high-ranked Medical - Ethical Drugs firm was last shown in this FSU section on 4/08/13 with an annotated graph under the headline, "Pullback Near 50-day Moving Average on M&A News ", while consolidating above its 50-day moving average (DMA) line. A short new base of sufficient length has formed while it stayed above its 50-day moving average (DMA) line during the latest consolidation. On 4/03/13 it pulled back on heavy volume after agreeing to an increased offer price of $24.00 cash for it to acquire Obagi Medical Products, yet it stayed above its 50 DMA line.
The number of top-rated funds owning its shares rose from 818 in Mar '12 in to 942 in Mar '13, a reassuring trend concerning the I criteria. Its current Up/Down Volume Ratio of 1.3 is also an unbiased indication that its shares have been under accumulation over the past 50 days. Quarterly earnings increases (C criteria) have been strong and well above the +25% guideline. A downturn in FY '07 and '08 earnings (A criteria) has been followed by a strong earnings rebound in recent years. Return On Equity is currently reported at 37%, well above the 17% minimum guideline of the fact-based system.
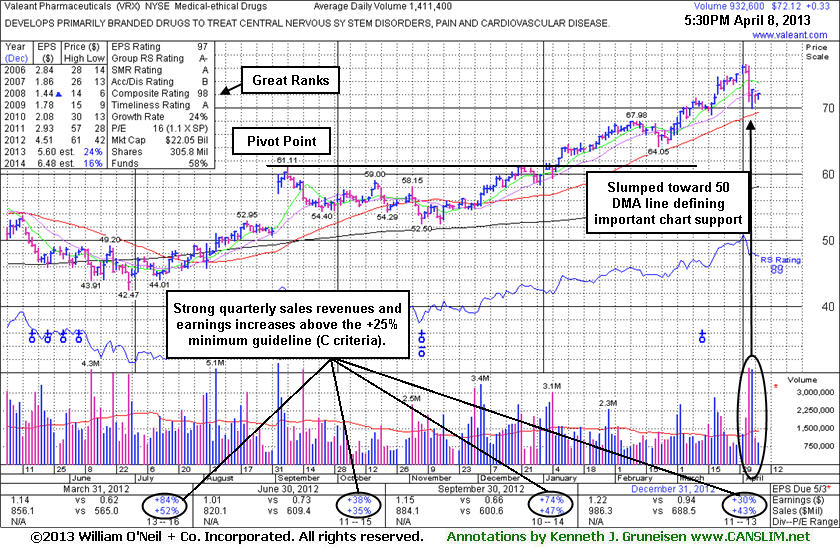
Pullback Near 50-day Moving Average on M&A News - Monday, April 08, 2013
Valeant Pharmaceuticals (VRX +$0.33 or +0.46% to $72.12) is consolidating above its 50-day moving average (DMA) line. It is extended from its prior base and no new base of sufficient length has formed, yet it has stayed above its 50-day moving average (DMA) line during prior consolidations. That important short-term average defines near-term support to watch where a violation may raise concerns and trigger a technical sell signal. On 4/03/13 it pulled back on heavy volume after agreeing to an increased offer price of $24.00 cash for it to acquire Obagi Medical Products.
After the high-ranked Medical - Ethical Drugs firm was last shown in this FSU section on 3/12/13 with an annotated graph under the headline, "Following Test Of Support a Valid Chance to Accumulate", it rallied further into new high territory. The number of top-rated funds owning its shares rose from 818 in Mar '12 in to 938 in Mar '13, a reassuring trend concerning the I criteria. Its current Up/Down Volume Ratio of 1.5 is also an unbiased indication that its shares have been under accumulation over the past 50 days. Quarterly earnings increases (C criteria) have been strong and well above the +25% guideline. A downturn in FY '07 and '08 earnings (A criteria) has been followed by a strong earnings rebound in recent years.
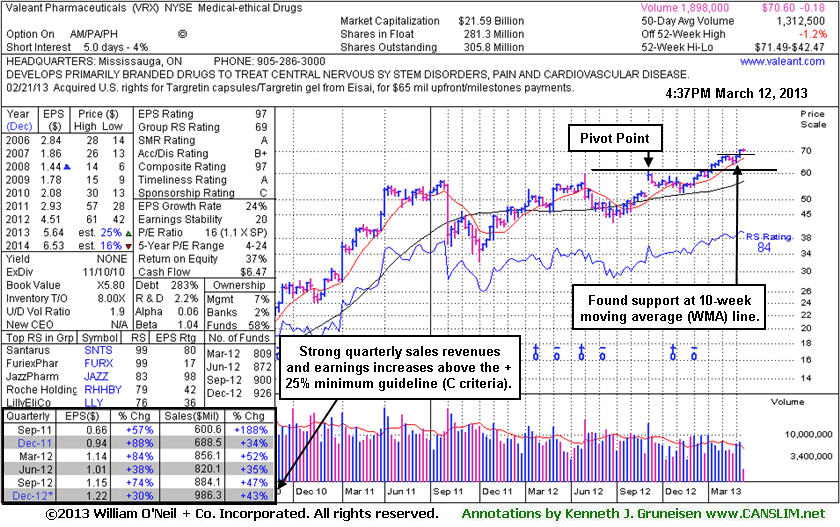
Following Test Of Support a Valid Chance to Accumulate - Tuesday, March 12, 2013
Valeant Pharmaceuticals (VRX +$0.02 or +0.03% to $70.55) wedged higher with recent daily gains lacking great volume conviction and it has been holding its ground stubbornly. Its weekly graph below shows no signs of distributional pressure. In fact, the recent down weeks have clearly been plotted with lighter than average volume. That is a sign that few investors have been headed for the exit door.
In the Certification they teach that if an investor misses a stock's initial breakout, a valid secondary buy point exists following the first successful test of support at the stock's 10-week moving average up to as high as +5% above its recent high. In this case the prior high was $67.98, so one might consider that price plus 5%, or $71.38, as the highest that a disciplined investor would be willing to pay to accumulate shares under the fact-based investment system. Its color code was changed to yellow however no new pivot point was cited since a new base of sufficient length was not formed. Meanwhile, the recent low ($64.05 on 2/21/13) defines important near-term support to watch where a violation would trigger a worrisome technical sell signal.
The Medical - Ethical Drugs firm was last shown in this FSU section on 2/15/13 with an annotated graph under the headline "Upward Trendline Defines Initial Support Above 50 Day Moving Average". Since then it violated the upward trendline yet it has stayed above the 50-day moving average (DMA) line. The number of top-rated funds owning its shares rose from 818 in Mar '12 in to 926 in Dec '12, a reassuring trend concerning the I criteria. Its current Up/Down Volume Ratio of 1.9 is also an unbiased indication that its shares have been under accumulation over the past 50 days. Quarterly earnings increases (C criteria) have been strong and well above the +25% guideline. A downturn in FY '07 and '08 earnings (A criteria) has been followed by a strong earnings rebound in recent years.
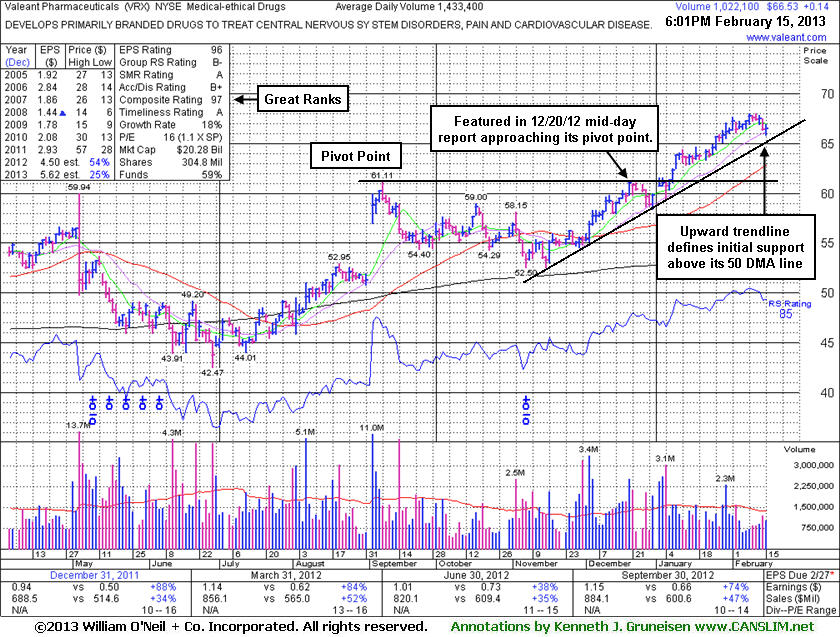
Upward Trendline Defines Initial Support Above 50 Day Moving Average - Friday, February 15, 2013
Valeant Pharmaceuticals (VRX +$0.14 or +0.21% to $66.53) is consolidating -2.1% off its 52-week high, extended from any sound base pattern. An upward trendline connecting its November - December lows defines an initial chart support to watch above its 50-day moving average (DMA) line (now $62.85). It may pause and form another base, or it might pull back and test its 10-week moving average line (similar to the 50 DMA) before any valid secondary buy point might be noted. Meanwhile, and fresh breakouts might be a better choice for disciplined investors looking to accumulate worthy buy candidates.The Medical - Ethical Drugs group's Relative Strength rating has been improving since it was last shown in this FSU section on 1/28/13 with an annotated graph under the headline "Featured Stock Recently Wedging Higher Without Great Volume Behind Gains", and there have been a couple of strong performers in the group offering reassuring signs concerning the L criteria. Gains with heavier volume also followed its last detailed review, which was a reassuring sign. Then it wedged even further into new high territory without great volume conviction behind gains in recent weeks. It has shown mostly bullish action since first featured in yellow at $60.24 in the 12/20/12 mid-day report.
The number of top-rated funds owning its shares rose from 818 in Mar '12 in to 922 in Dec '12, a reassuring trend concerning the I criteria. Its current Up/Down Volume Ratio of 2.1 is also an unbiased indication that its shares have been under accumulation over the past 50 days. Quarterly earnings increases (C criteria) have been strong and well above the +25% guideline. A downturn in FY '07 and '08 earnings (A criteria) has been followed by a strong earnings rebound in recent years.
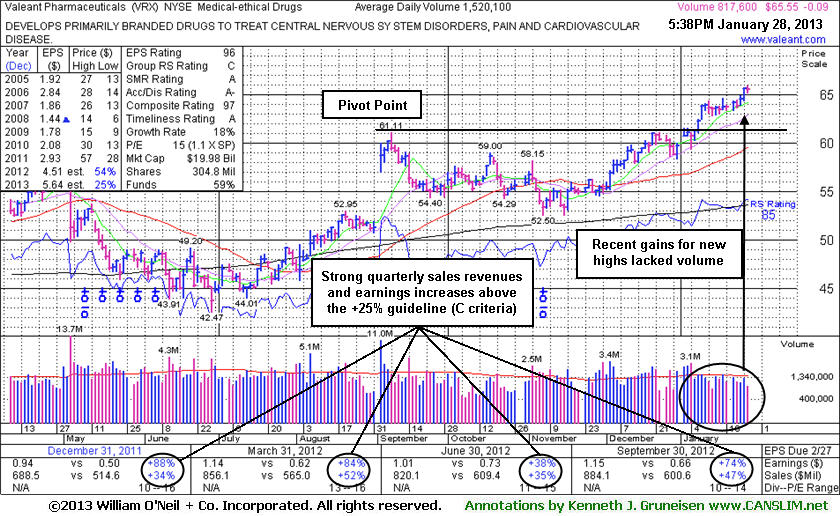
Featured Stock Recently Wedging Higher Without Great Volume Behind Gains - Monday, January 28, 2013
Valeant Pharmaceuticals (VRX -$0.09 or -0.14% to $65.55) is extended from a sound base, thus not buyable under the fact-based system's guidelines now. It finished with a small loss today. It recently rallied further above its "max buy" level without great volume conviction. It was last shown in this FSU section on 1/10/13 with an annotated graph under then headline "Light Volume Behind Gains Into New High Ground". We cautioned as it rallied above its pivot point for another new 52-week high that volume was below the +40% above average guideline which is the bare minimum threshold needed to trigger a proper technical buy signal. It had rallied near its pivot with great volume, however the recent action may be considered "wedging" which does not have the look of aggressive and sustainable buying demand form the institutional crowd. That is not to say it cannot rally further, but historic studies have suggested that volume is normally heavy behind the best winning stocks as they began their most substantial rallies in price.Prior articles reminded members that in the Certification they teach a tactic called "pyramiding" that allows investors to let the market action dictate how heavily they position themselves in fresh buy candidates. The wedging action of late is not as bullish as a solid burst of volume behind gains into new high territory would be, meanwhile, investors employing the pyramiding technique may have accumulated positions.
Quarterly earnings increases (C criteria) have been strong and well above the +25% guideline. A downturn in FY '07 and '08 earnings (A criteria) has been followed by a strong earnings rebound in recent years. The number of top-rated funds owning its shares rose from 818 in Mar '12 in to 899 in Dec '12, a reassuring trend concerning the I criteria. Its current Up/Down Volume Ratio of 1.9 is also an unbiased indication that its shares have been under accumulation over the past 50 days. Although it is of some concern that the Medical - Ethical Drugs group's Relative Strength rating is weak, there have been a couple of strong performers in the group which offer reassuring signs concerning the L criteria.
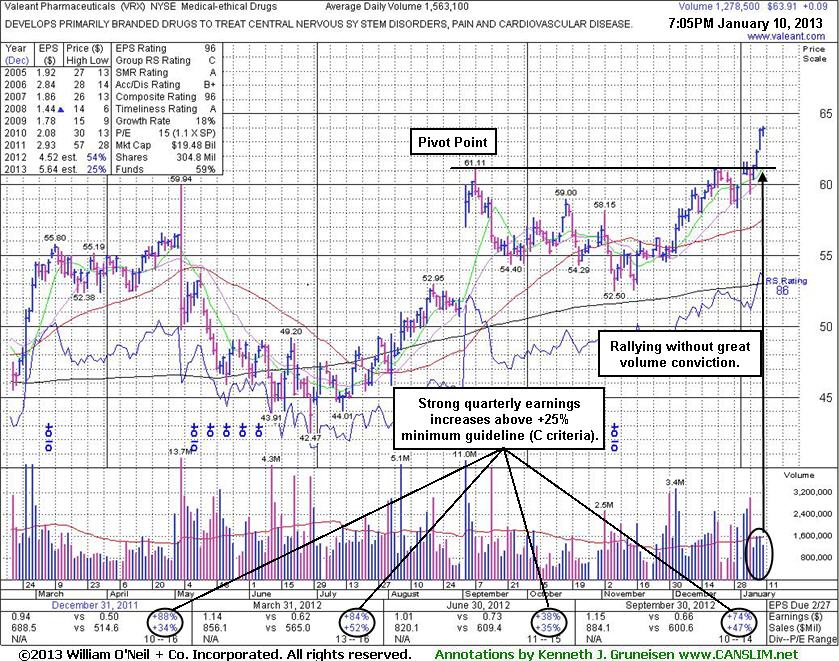
Light Volume Behind Gains Into New High Ground - Thursday, January 10, 2013
Valeant Pharmaceuticals (VRX +$0.09 or +0.14% to $63.91) rallied further above its pivot point today for another new 52-week high, however, behind its latest spurt of gains volume was below the +40% above average guideline which is the bare minimum threshold needed to trigger a proper technical buy signal. It was last shown in this FSU section on 12/28/12 with an annotated graph under then headline "Finished Near Pivot Point With Volume Behind Solid Gain". Subsequent gains helped it approach the pivot point cited based on its 9/07/12 high plus 10 cents when highlighted in yellow in the 12/20/12 mid-day report (read here).Prior articles reminded members that in the Certification they teach a tactic called "pyramiding" that allows investors to let the market action dictate how heavily they position themselves in fresh buy candidates. VRX encountered distributional pressure near the $60-61 area, and it remains below its "max buy" level. The wedging action of late is not as bullish as a solid burst of volume behind gains into new high territory would be, meanwhile, investors employing the pyramiding technique may have accumulated partial positions.
Quarterly earnings increases (C criteria) have been strong and well above the +25% guideline. A downturn in FY '07 and '08 earnings (A criteria) has been followed by a strong earnings rebound in recent years. The number of top-rated funds owning its shares rose from 818 in Mar '12 in to 887 in Dec '12, a reassuring trend concerning the I criteria. Its current Up/Down Volume Ratio of 1.6 is also an unbiased indication that its shares have been under accumulation over the past 50 days. Although it is of some concern that the Medical - Ethical Drugs group's Relative Strength rating is weak, there have been a couple of strong performers in the group which offer reassuring signs concerning the L criteria.
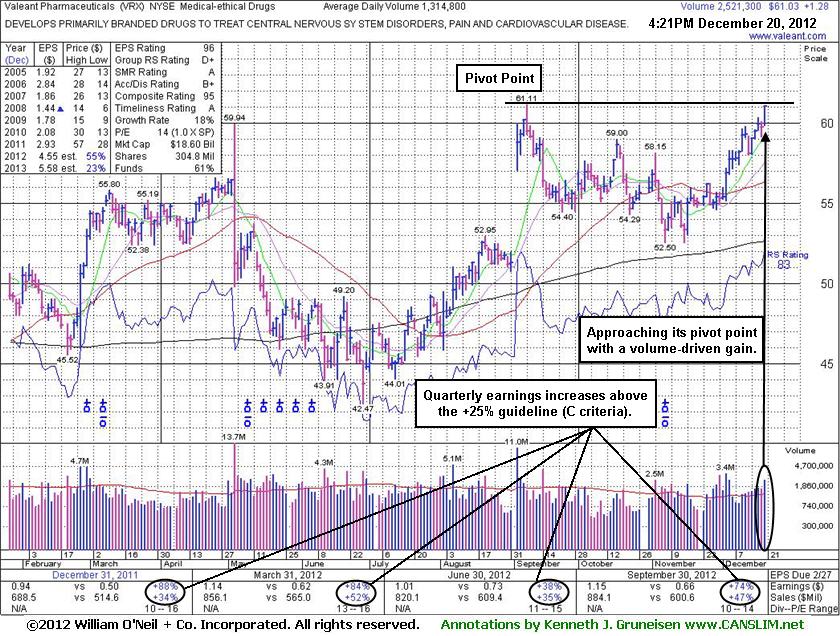
Finished Near Pivot Point With Volume Behind Solid Gain - Thursday, December 20, 2012
Often, when a leading stock is setting up to breakout of a solid base it is highlighted in CANSLIM.net's Mid-Day Breakouts Report. Sometimes stocks are highlighted shortly after a technical breakout, yet while the potential buy candidate may still be considered action-worthy. The most relevant factors are noted in the report which alerts prudent CANSLIM oriented investors to place the issue in their watch list. After doing any necessary backup research, the investor is prepared to act after the stock triggers a technical buy signal (breaks above its pivot point on more than +50% average turnover) but before it gets too extended from a sound base. In the event the stock fails to trigger a technical buy signal and its price declines then it will simply be removed from the watch list. Disciplined investors know to buy as near as possible to the pivot point and avoid chasing stocks after they have rallied more than +5% above their pivot point. It is crucial to always limit losses whenever any stock heads the wrong direction, and disciplined investors sell if a struggling stock ever falls more than -7% from their purchase price.
Valeant Pharmaceuticals (VRX +$1.28 or +2.14% to $61.03) finished strong after it was highlighted in yellow with pivot point cited based on its 9/07/12 high plus 10 cents in the earlier mid-day report (read here). It rallied with +92% above average volume and challenged its pivot point, however, disciplined investors know that a volume-driven gain above a stock's pivot point is necessary to trigger a proper technical buy signal before taking action. Keep in mind that it encountered stubborn resistance in prior months near the $60-61 area. In the Certifuication they teach a tactic called "pyramiding" that allows investors to let the market action dictate how heavily they position themselves in fresh buy candidates.
Quarterly earnings increases (C criteria) have been strong and well above the +25% guideline. A downturn in FY '07 and '08 earnings (A criteria) has been followed by a strong earnings rebound in recent years. The number of top-rated funds owning its shares rose from 818 in Mar '12 in to 889 in Sep '12, a reassuring trend concerning the I criteria. Its current Up/Down Volume Ratio of 1.4 is also an unbiased indication that its shares have been under accumulation over the past 50 days. Although it is of some concern that the Medical - Ethical Drugs group's Relative Strength rating is weak, there have been a couple of strong performers in the group which offer reassuring signs concerning the L criteria.