Rebounding Toward 50-Day Moving Average -
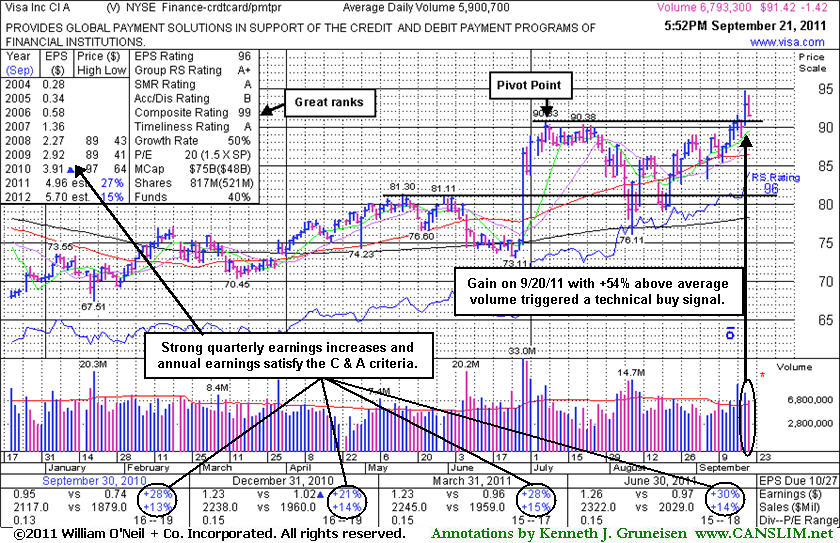
Visa Inc (V +$0.71 or +0.50% to $142.45) has been rebounding after slumping near its 200-day moving average (DMA) line ($131) following noted technical sell signals. A rebound above the 50 DMA line ($144) is needed for its outlook to improve, however, that short-term average may now act as resistance.
Fundamentals remain strong. It reported earnings +40% on +15% sales revenues for the Jun '18 quarter. The past 3 quarterly comparisons were above the +25% minimum earnings guideline (C criteria). Its strong and steady annual earnings history satisfies the A criteria.
Visa was last shown in this FSU section on 9/13/18 with an annotated graph under the headline, "Visa Near Record but Endured Distributional Pressure". It traded up as much as +19.6% after it was highlighted in yellow at $126.68 with pivot point cited based on its 1/29/18 high plus 10 cents in the 4/26/18 mid-day report (read here).
The number of top-rated funds owning its shares rose from 3,624 in Jun '17 to 4,195 in Sep '18, a reassuring sign concerning the I criteria, however it is already well known by the institutional crowd.There are also 2.03 billion shares outstanding (S criteria), which can make it a less likely sprinter. Leadership shown by other firms in the Finance - Credit Card Payment Processing group (L criteria) has been a reassuring sign.
Charts courtesy wwwstockcharts.com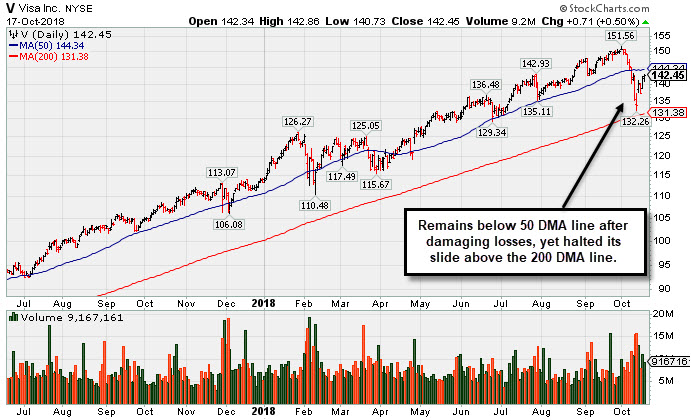
Visa Near Record but Endured Distributional Pressure - Thursday, September 13, 2018
Visa Inc (V +$1.06 or +0.72 to $147.63) is extended from any sound base and recently endured distributional pressure. Its 50-day moving average (DMA) line ($141) and prior low ($135.31 on 7/30/18) define important near-term support to watch on pullbacks.
Fundamentals remain strong. It reported earnings +40% on +15% sales revenues for the Jun '18 quarter. The past 3 quarterly comparisons were above the +25% minimum earnings guideline (C criteria). Its strong and steady annual earnings history satisfies the A criteria.
It was last shown in this FSU section on 7/27/18 with an annotated graph under the headline, "Perched Near All-Time High After Rally From 50-Day Average". Visa was highlighted in yellow at $126.68 with pivot point cited based on its 1/29/18 high plus 10 cents in the 4/26/18 mid-day report (read here). It gapped up hitting a new all-time high closed above its pivot point with a big gain backed by +81% above average volume triggering a convincing technical buy signal.
The number of top-rated funds owning its shares rose from 3,624 in Jun '17 to 4,073 in Jun '18, a reassuring sign concerning the I criteria, however it is already well known by the institutional crowd.There are also 2.03 billion shares outstanding (S criteria), which can make it a less likely sprinter. Leadership shown by other firms in the Finance - Credit Card Payment Processing group (L criteria) has been a reassuring sign.
Charts courtesy wwwstockcharts.com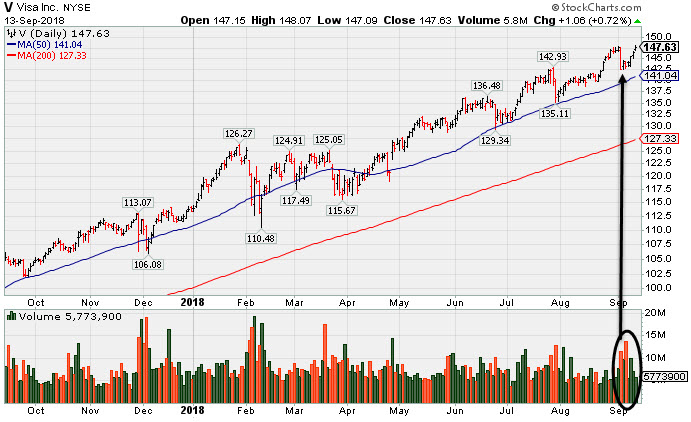
Perched Near All-Time High After Rally From 50-Day Average - Friday, July 27, 2018
Visa Inc (V -$1.79 or -1.26% to $140.71) reported earnings +40% on +15% sales revenues for the Jun '18 quarter, and the past 3 quarterly comparisons were above the +25% minimum earnings guideline (C criteria). Its strong and steady annual earnings history satisfies the A criteria.
Visa found support at its 50 DMA then rallied to new highs with volume-driven gains since last shown in this FSU section on 6//11/18 with an annotated graph under the headline, "Encountered Distributional Pressure at All-Time High". Technically, it is extended from any sound base, stubbornly holding its ground perched at its all-time high. The 50-day moving average (DMA) line ($134) defines support above the prior low ($129.53 on 6/25/18).
V was highlighted in yellow at $126.68 with pivot point cited based on its 1/29/18 high plus 10 cents in the 4/26/18 mid-day report (read here). It gapped up hitting a new all-time high closed above its pivot point with a big gain backed by +81% above average volume triggering a convincing technical buy signal.
The number of top-rated funds owning its shares rose from 3,624 in Jun '17 to 3,816 in Jun '18, a reassuring sign concerning the I criteria, however it is already well known by the institutional crowd.There are also 2.03 billion shares outstanding (S criteria), which can make it a less likely sprinter. Leadership shown by other firms in the Finance - Credit Card Payment Processing group (L criteria) has been a reassuring sign.
Charts courtesy wwwstockcharts.com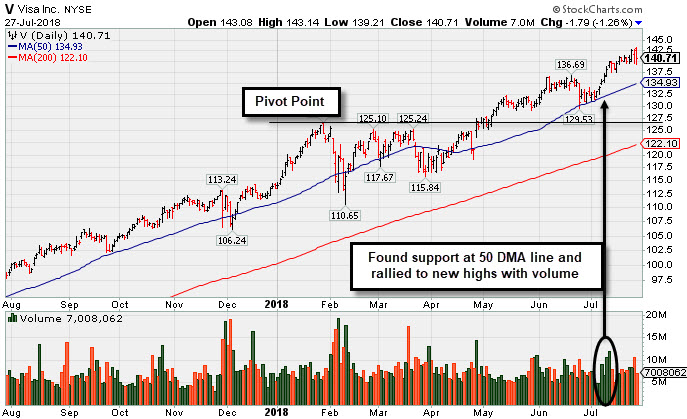
Encountered Distributional Pressure at All-Time High - Monday, June 11, 2018
Visa Inc (V -$0.83 or -0.62% to 133.91) is perched near its "max buy" level after encountering some distributional pressure at its all-time high. Prior highs in the $126 area and its 50-day moving average (DMA) line ($127.23) define near-term support to watch on pullbacks.
It was last shown in this FSU section on 4/26/18 with an annotated graph under the headline, "Volume-Driven Gain For New High Triggered Technical Buy Signal". It was highlighted in yellow with pivot point cited based on its 1/29/18 high plus 10 cents in the earlier mid-day report (read here). It gapped up hitting a new all-time high closed above its pivot point with a big gain backed by +81% above average volume triggering a convincing technical buy signal.
It reported earnings +29% on +13% sales revenues for the Mar '18 quarter, and 3 of the past 4 quarterly comparisons were above the +25% minimum earnings guideline (C criteria). Its strong and steady annual earnings history satisfies the A criteria.
The number of top-rated funds owning its shares rose from 3,624 in Jun '17 to 3,860 in Mar '18, a reassuring sign concerning the I criteria, however it is already well known by the institutional crowd.There are also 2.03 billion shares outstanding (S criteria), which can make it a less likely sprinter. Leadership shown by other firms in the Finance - Credit Card Payment Processing group (L criteria) has been a reassuring sign.
Charts courtesy wwwstockcharts.com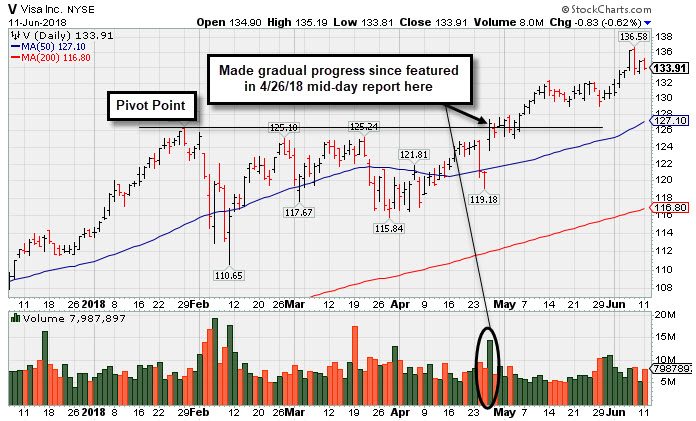
Volume-Driven Gain For New High Triggered Technical Buy Signal - Thursday, April 26, 2018
Visa Inc (V +$5.87 or +4.84% to $127.08) finished strong after highlighted in yellow with pivot point cited based on its 1/29/18 high plus 10 cents in the earlier mid-day report (read here). It gapped up today hitting a new all-time high closed above its pivot point with a big gain backed by +81% above average volume triggering a convincing technical buy signal.
Reported earnings +29% on +13% sales revenues for the Mar '18 quarter, and 3 of the past 4 quarterly comparisons were above the +25% minimum earnings guideline (C criteria). Its strong and steady annual earnings history satisfies the A criteria.
Over the past year it hadn't spent much time base building. Its fundamental and technical characteristics were not always a great match with the fact-based investment system's guidelines since its last appearance in this FSU section on 5/16/12 with an annotated graph under the headline, "Market Weakness Argues Against Tolerating Further Deterioration". Weak market conditions (the M criteria) at the time argued in favor of investors raising cash until a new rally was confirmed with a solid follow-through day from at least one of the major averages.
The number of top-rated funds owning its shares rose from 3,624 in Jun '17 to 3,808 in Mar '18, a reassuring sign concerning the I criteria, however it is already well known by the institutional crowd.There are also 2.06 billion shares outstanding (S criteria), which can make it a less likely sprinter. Leadership shown by other firms in the Finance - Credit Card Payment Processing group (L criteria) has been a reassuring sign.
Charts courtesy wwwstockcharts.com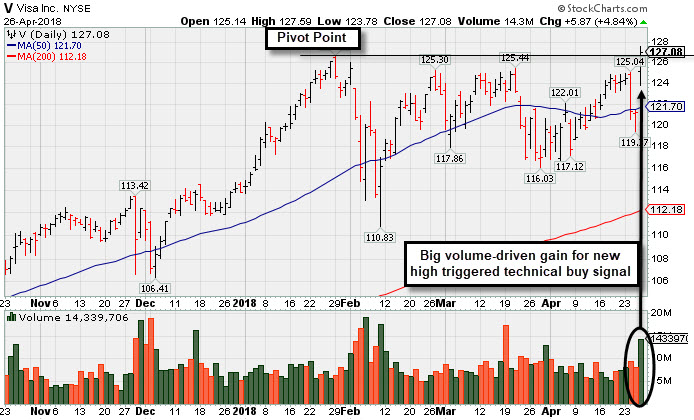
Market Weakness Argues Against Tolerating Further Deterioration - Wednesday, May 16, 2012
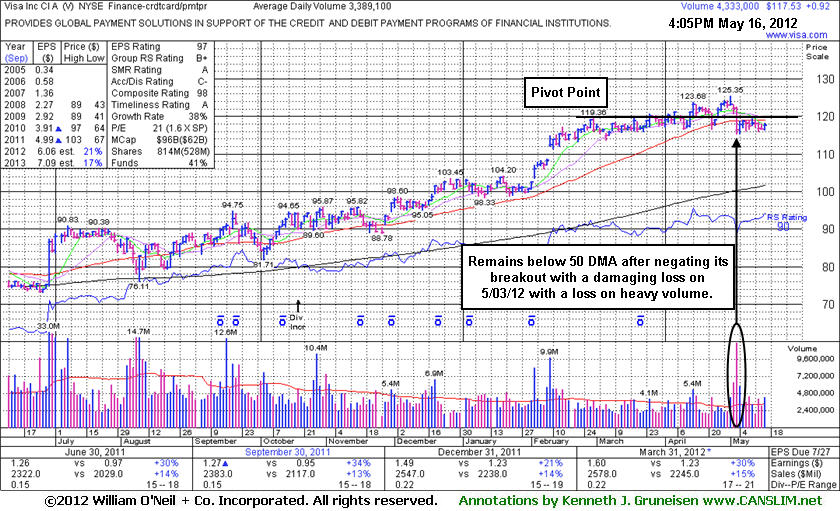
Visa Inc (V +$0.80 or +0.70% to $115.64) is consolidating below its 50-day moving average (DMA) line which has acted as a resistance level after the technical violation on 5/03/12 triggered a sell signal. The longer it lingers below its 50 DMA line the worse its outlook becomes. Its prior highs in the $103-104 area define chart support above its 200 DMA line, the next important area to watch.
Its last appearance in this FSU section was on 3/07/12 with an annotated graph under the headline, "Technically Strong Even After Latest Sub Par Quarter", and the analysis provided a cautionary reminder - "Watch out for any technical sell signals which might definitively prompt locking in hard fought gains." It subsequently held its ground and rallied higher after reporting earnings +30% on +15% sales revenues for the quarter ended March 31, 2012 versus the year ago period, above the minimum earnings increase needed to meet the C criteria. Fundamental concerns had been raised by its sub par results for the latest quarter ended December 31, 2011 versus the year ago period, its first comparison below the +25% minimum earnings guideline since Dec '10. Its annual earnings history satisfies the A criteria.
The number of top-rated funds owning its shares rose from 1,635 in Dec '10 to 2,054 in Mar '12, a reassuring sign concerning the I criteria, however it is already well known by the institutional crowd. Leadership shown by at least one other well-known firm in the Finance - Credit Card Payment Processing firm (L criteria) has been a reassuring sign.
Disciplined investors might not be wise to give it the benefit of the doubt much longer, especially if more damaging losses lead to deterioration below the recent lows in the $115 area. Weak market conditions (the M criteria) further argue in favor of investors raising cash until a new rally is confirmed with a solid follow-through day from at least one of the major averages.
Technically Strong Even After Latest Sub Par Quarter - Wednesday, March 07, 2012
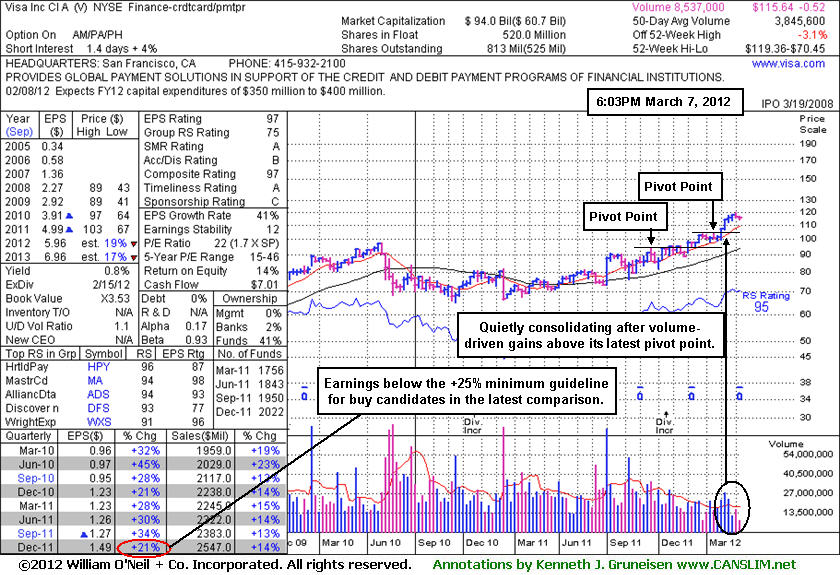
Visa Inc (V +$0.80 or +0.70% to $115.64) is consolidating after wedging further into new high territory with below average volume conviction behind its most recent gains. Its prior highs in the $103-104 area define chart support to watch on pullbacks.
Its last appearance in this FSU section was on 1/23/12 with an annotated graph under the headline, "Leader's Relative Strength Line Not Confirming Latest High." Little more than a week later, while blasting higher on 2/02/12 its color code was changed to yellow with a new pivot point based on its 1/19/12 high plus 10 cents. It followed that up with additional volume-driven gains as there was above average volume behind 3 consecutive weekly gains during a 5-week winning streak into all-time high territory.
Technically it has remained strong, however fundamental concerns were raised by its sub par results for the latest quarter ended December 31, 2011 versus the year ago period, its first comparison below the +25% minimum earnings guideline since Dec '10. Its annual earnings history satisfies the A criteria, but the latest quarter makes it fall short of the C criteria. The number of top-rated funds owning its shares rose from 1,635 in Dec '10 to 2,022 in Dec '11, a reassuring sign concerning the I criteria, however it is already well known by the institutional crowd. Leadership shown by at least one other well-known firm in the Finance - Credit Card Payment Processing firm (L criteria) has been a reassuring sign.
Disciplined investors might continue to give it the benefit of the doubt and let it a chance to tally more meaningful gains unless market conditions (the M criteria) further deteriorate prompting investors to raise cash. Watch out for any technical sell signals which might definitively prompt locking in hard fought gains.
Leader's Relative Strength Line Not Confirming Latest High - Monday, January 23, 2012
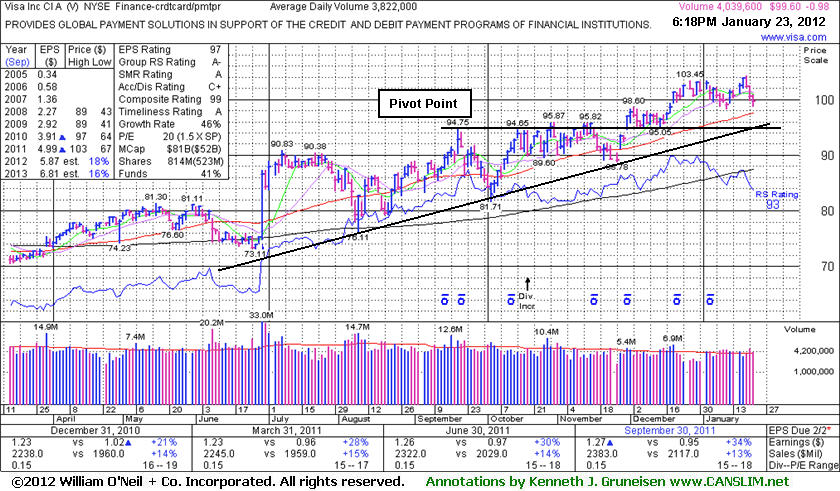
Visa Inc (V -$0.98 or -0.97% to $99.60) has encountered mild distributional pressure since its negative reversal on 1/19/12 after touching another new all-time high. Meanwhile, its Relative Strength line has been waning even though the Relative Strength rank still remains well above the 80+ guideline for the best buy candidates. Its recent gains lacked great volume conviction as it struggled to make progress even though no overhead supply remains to act as resistance. Its recent low ($98.33 on 1/11/12) and its 50-day moving average (DMA) line define initial chart support to watch on pullbacks. There is also a multi-month upward trendline that helps define additional chart support.
Its last appearance in this FSU section was on 12/15/11 with an annotated graph under the headline, "Distributional Action After Making Limited Progress." Its quarterly and annual earnings history has been strong enough to satisfy the C and A criteria. The number of top-rated funds owning its shares rose from 1,635 in Dec '10 to 1,919 in Dec '11, a reassuring sign concerning the I criteria, however it is already well known by the institutional crowd. Leadership shown by at least one other well-known firm in the Finance - Credit Card Payment Processing firm (L criteria) has been a reassuring sign.
Disciplined investors always limit losses by selling if ever any stock falls -7% from their purchase price. Otherwise, if leaving the risk un-contained, the damage can become more severe and undisciplined investors must be prepared to suffer the painful consequences.
Distributional Action After Making Limited Progress - Thursday, December 15, 2011
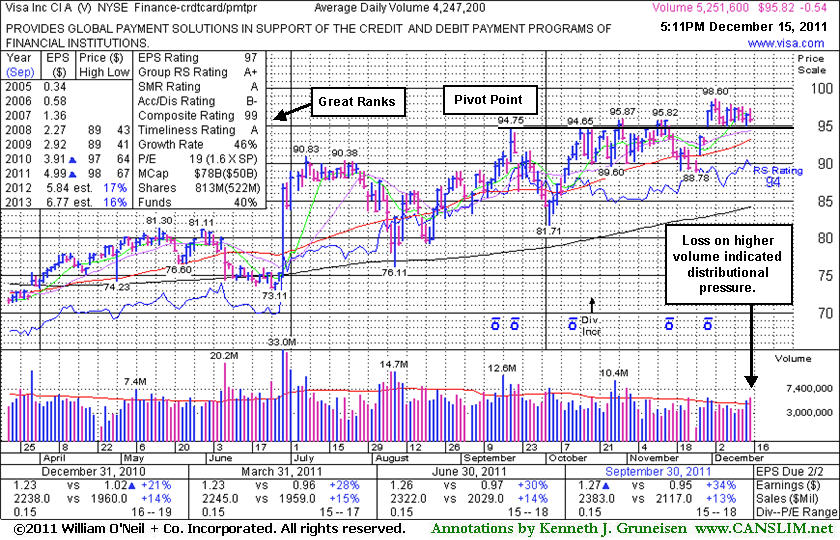
Visa Inc (V -$0.54 or -0.56% to $95.82) encountered distributional pressure today and ended the session near its low with a loss on slightly higher (above average) volume. Its last appearance in this FSU section was on 11/18/11 with an annotated graph under the headline, "Fall Leads to Testing Support Near 50-Day Moving Average." Afterward it briefly slumped below its 50-day moving average (DMA) line and prior lows triggering technical sell signals, then it soon rebounded above the 50 DMA and on to new highs. Volume conviction was not significant behind the gains, however, leaving questions as to the level of institutional buying conviction. A convincing breakout did not subsequently trigger a new technical buy signal.
Its quarterly and annual earnings history has been strong enough to satisfy the C and A criteria. The number of top-rated funds owning its shares rose from 1,635 in Dec '10 to 1,935 in Sep '11, a reassuring sign concerning the I criteria, however it is already well known by the institutional crowd. Leadership shown by at least one other well-known firm in the Finance - Credit Card Payment Processing firm (L criteria) has been a reassuring sign.
Keep in mind that the M criteria tells us that typically 3 out of 4 stocks move in the same direction of the major averages, and not a lot of examples worked out well in recent weeks while the broader market struggled. In a bullish market environment there is no shortage of action-worthy buy candidates, and many of the companies may form multiple sound base patterns throughout an ongoing advance. Disciplined investors always limit losses by selling if ever any stock falls -7% from their purchase price. Otherwise, if leaving the risk un-contained, the damage can become more severe and undisciplined investors must be prepared to suffer the painful consequences.
Fall Leads to Testing Support Near 50-Day Moving Average - Friday, November 18, 2011
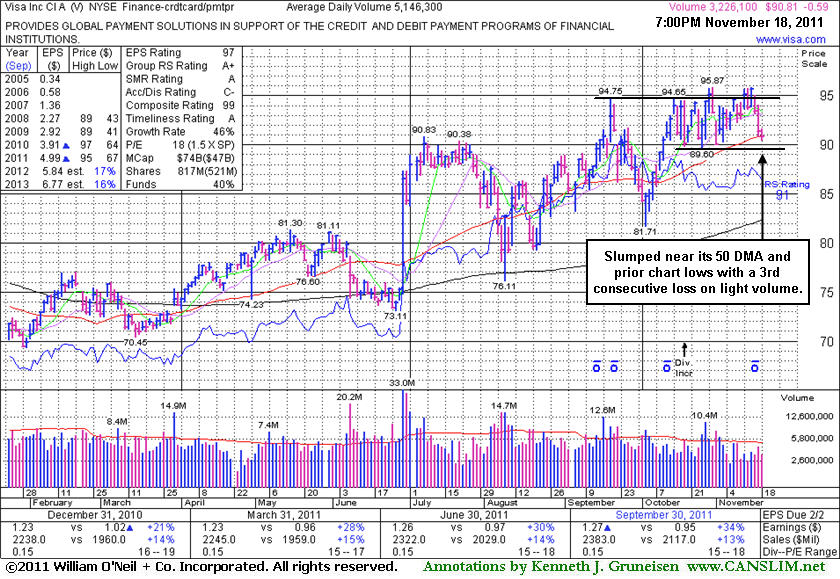
Visa Inc (V -$0.57 or -0.62% to $90.83) has slumped near its 50-day moving average (DMA) line (now $90.71) previously noted as near-term chart support to watch. A violation of that important short-term average line may trigger more worrisome technical sell signals. Prior lows just below that important short-term average are another important nearby chart support level to keep an eye on. Its last appearance in this FSU section was on 10/24/11 with an annotated weekly graph under the headline, "New Pivot Point Cited After Healthy Consolidation." A convincing breakout did not subsequently trigger a new technical buy signal. It has encountered resistance near prior highs.
Its quarterly and annual earnings history has been strong enough to satisfy the C and A criteria. The number of top-rated funds owning its shares rose from 1,642 in Dec '10 to 1,923 in Sep '11, a reassuring sign concerning the I criteria, however it is already well known by the institutional crowd. Leadership shown by at least one other well-known firm in the Finance - Credit Card Payment Processing firm (L criteria) has been a reassuring sign.
Keep in mind that the M criteria tells us that typically 3 out of 4 stocks move in the same direction of the major averages, and not a lot of examples worked out well in recent weeks while the broader market struggled. In a bullish market environment there is no shortage of action-worthy buy candidates, and many of the companies may form multiple sound base patterns throughout an ongoing advance. Disciplined investors always limit losses by selling if ever any stock falls -7% from their purchase price. Otherwise, if leaving the risk un-contained, the damage can become more severe and undisciplined investors must be prepared to suffer the painful consequences.
New Pivot Point Cited After Healthy Consolidation - Monday, October 24, 2011
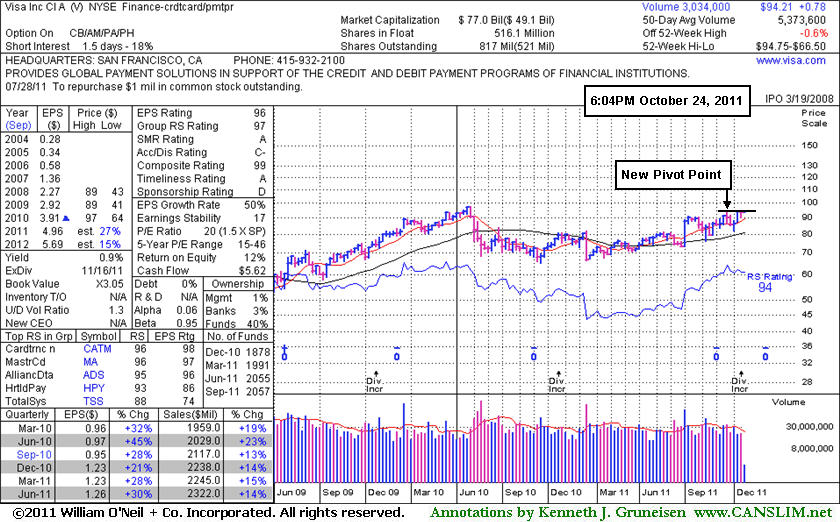
Visa Inc (V +$0.78 or +0.83% to $94.21) posted a 3rd consecutive small gain today with ever-lighter than average volume. A new pivot point is being cited based on its 52-week high plus 10 cents and its color code is changed to yellow while it is now working on the 6th week of a "square box" base pattern. A convincing breakout above the new pivot point with at least +50% above average or greater volume may trigger a new technical buy signal.
Its last appearance in this FSU section was on 10/10/11 with an annotated graph under the headline, "Volume Light Behind Rebound After Recently Failed Breakout". It found impressive support well above its prior chart lows and longer-term 200 DMA line, but likely prompted disciplined investors to sell and follow the system's loss-limiting rule with its sharp pullback. Gains thereafter have lacked great volume conviction while it continued to rebound and approached its 52-week high. Its quarterly and annual earnings history has been strong enough to satisfy the C and A criteria. The number of top-rated funds owning its shares rose from 1,878 in Dec '10 to 2,057 in Sep '11, a reassuring sign concerning the I criteria, however it is already well known by the institutional crowd. Leadership shown by at least one other well-known firm in the Finance - Credit Card Payment Processing firm (L criteria) has been a reassuring sign.
Keep in mind that the M criteria tells us that typically 3 out of 4 stocks move in the same direction of the major averages, and not a lot of examples worked out well in recent weeks while the broader market struggled. After the latest correction, the new rally attempt has produced a reassuring follow-through day coupled with an expansion in leadership (new 52-week highs) which suggests that investors' odds are again more favorable for success.
In a bullish market environment there is no shortage of action-worthy buy candidates, and many of the companies may form multiple sound base patterns throughout an ongoing advance. Disciplined investors always limit losses by selling if ever any stock falls -7% from their purchase price. Otherwise, if leaving the risk un-contained, the damage can become more severe and undisciplined investors must be prepared to suffer the painful consequences.
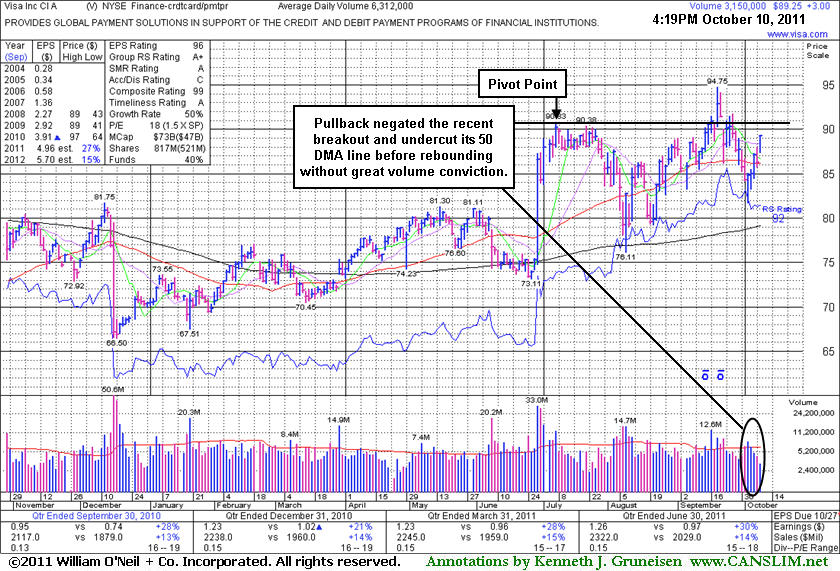
Volume Light Behind Rebound After Recently Failed Breakout - Monday, October 10, 2011
Visa Inc (V +$3.00 or +3.48% to $89.25) has rebounded back above its 50-day moving average (DMA) line without great volume conviction behind its recent gains. The 50 DMA line recently began sloping downward after it stalled following its breakout to a new 52-week high. Its last appearance in this FSU section was on 9/21/11 with an annotated graph under the headline, "Leadership in Group Has Been a Reassuring Sign" as it pulled back with volume slightly above average. Damaging losses soon thereafter promptly negated the breakout as it sank back into its prior base and then violated its 50 DMA line triggering technical sell signals.Visa was featured in yellow in the 9/20/11 mid-day report with a pivot point based on its 7/07/11 high plus 10 cents. That day's considerable closing gain for a new all-time high was ultimately backed by volume +54% above average. That technically triggered a buy signal by clearing an 11-week base during which it found impressive support near its longer-term 200 DMA line. Its quarterly and annual earnings history has been strong enough to satisfy the C and A criteria. The number of top-rated funds owning its shares rose from 1,878 in Dec '10 to 2,057 in Jun '11, a reassuring sign concerning the I criteria, however it is already well known by the institutional crowd. Leadership shown by at least one other well-known firm in the Finance - Credit Card Payment Processing firm (L criteria) has been a reassuring sign.
Disciplined investors always limit losses by selling if ever any stock falls -7% from their purchase price. Otherwise, if leaving the risk un-contained, the damage can become more severe and undisciplined investors must be prepared to suffer the painful consequences. Keep in mind that the M criteria tells us that typically 3 out of 4 stocks move in the same direction of the major averages, and until the new rally attempt produces a reassuring follow-through day of the outlook is questionable, hurting investors chances for landing great gains.
Leadership in Group Has Been a Reassuring Sign - Wednesday, September 21, 2011
Often, when a leading stock is setting up to breakout of a solid base, it is highlighted in CANSLIM.net's Mid-Day Breakouts Report. The most relevant factors are noted in the report which allows prudent CANSLIM oriented investors to place the issue in their watch list. After doing any necessary backup research, the investor is prepared to act if and when the stock triggers a technical buy signal (breaks above its pivot point on more than +50% average turnover). In the event the stock fails to trigger a technical buy signal and its price declines then it will simply be removed from the watch list.
Visa Inc (V -$1.42 or -1.53% to $91.42) pulled back today with volume slightly above average. It was featured in yellow in the 9/20/11 mid-day report with a pivot point based on its 7/07/11 high plus 10 cents. Its considerable closing gain for a new all-time high was ultimately backed by volume +54% above average. That technically triggered a buy signal by clearing an 11-week base during which it found impressive support near its longer-term 200 DMA line. Its quarterly and annual earnings history has been strong enough to satisfy the C and A criteria. The number of top-rated funds owning its shares rose from 1,878 in Dec '10 to 2,040 in Jun '11, a reassuring sign concerning the I criteria, however it is already well known by the institutional crowd. Leadership shown by at least one other well-known firm in the Finance - Credit Card Payment Processing firm (L criteria) has been a reassuring sign.
Disciplined investors always limit losses by selling if ever any stock falls -7% from their purchase price. Otherwise, if leaving the risk un-contained, the damage can become more severe and undisciplined investors must be prepared to suffer the painful consequences. Keep in mind that the M criteria tells us that typically 3 out of 4 stocks move in the same direction of the major averages, and the rally has been coming under pressure recently, hurting investors chances for landing great gains.
