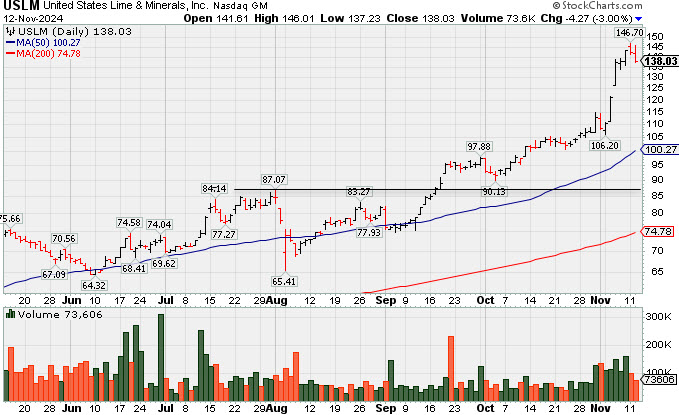
Extended From Any Sound Base After Impressive Rally - Tuesday, November 12, 2024
U.S. Lime & Minerals (USLM -$4.52 or -3.18% to $137.78) is extended from any sound base and hovering at its all-time high following a noted spurt of volume-driven gains. Its 50-day moving average (DMA) line ($100) defines important near-term support to watch on pullbacks.Fundamentals remain strong. USLM reported Sep '24 quarterly earnings +59% on +19% sales revenues versus the year-ago period. USLM has an Earnings Per Share Rating of 99. Prior quarterly and annual earnings (C and A criteria) history has been strong, a good match with the fact-based investment system's guidelines. Its shares split 5:1 effective on 7/15/24 and still the thinly-traded firm has only 28.6 million shares outstanding (S criteria), which can contribute to greater price volatility in the event of institutional buying or selling.
USLM was highlighted in yellow in the 2/09/24 mid-day report (read here). It was last shown in this FSU section on 10/07/24 with an annotated graph under the headline, "Hovering Above Prior Highs Near All-Time High". The number of top-rated funds owning its shares rose from 192 in Mar '23 to 262 in Sep '24, a reassuring sign concerning the I criteria. Its current Up/Down Volume Ratio of 2.3 is an unbiased indication its shares have been under accumulation over the past 50 days. It has an Accumulation/Distribution rating of A+ and a Timeliness rating of A.
Chart courtesy of www.stockcharts.com
| Symbol/Exchange Company Name Industry Group | PRICE | CHANGE | Day High | Volume (% DAV) (% 50 day avg vol) | 52 Wk Hi | Featured Date | Price Featured | Pivot Featured |
| Max Buy | ||||||||
U.S. Lime & Minerals Bldg-Cement/Concrt/Ag | $137.78 | -4.52 -3.18% | $146.01 | 101,778 50 DAV is 68,000 | $146.70 -6.08% | 9/17/2024 | $71.26 | PP = $87.23 |
| MB = $91.59 | ||||||||
G - Pulled back from its all-time high with today''s 2nd consecutive volume-driven loss following a noted spurt of volume-driven gains. Its 50 DMA line ($100) defines important near-term support to watch on pullbacks. See the latest FSU analysis for more details and a new annotated graph. >>> FEATURED STOCK ARTICLE : Extended From Any Sound Base After Impressive Rally - 11/12/2024 | View all notes | Set NEW NOTE alert | Company Profile | SEC News | Chart | Request a new note | ||||||||
Granite Construction Bldg-Heavy Construction | $97.23 | -1.18 -1.20% | $98.86 | 508,555 50 DAV is 693,000 | $99.32 -2.10% | 6/11/2024 | $59.76 | PP = $64.33 |
| MB = $67.55 | ||||||||
| Most Recent Note - 11/8/2024 5:15:57 PM G - Powered to another new all-time high with today''s 7th consecutive gain. Bullish action has come after it reported Sep '24 quarterly earnings +19% on +14% sales revenues versus the year-ago period, below the +25% minimum guideline (C criteria) of the fact-based investment system. See the latest FSU analysis for moer details and a new annotated graph. >>> FEATURED STOCK ARTICLE : Extended From Base After Streak of Gains for New Highs - 11/8/2024 | View all notes | Set NEW NOTE alert | Company Profile | SEC News | Chart | Request a new note | ||||||||
Texas Roadhouse Retail-Restaurants | $196.19 | +1.71 0.88% | $197.75 | 723,053 50 DAV is 735,000 | $201.24 -2.51% | 7/26/2024 | $173.08 | PP = $175.82 |
| MB = $184.61 | ||||||||
G - Volume totals have been cooling while holding its ground after a gap up on 11/06/24 hitting a new all-time high. Prior highs in the $177-180 area define important support to watch coinciding with its 50 DMA line ($178). >>> FEATURED STOCK ARTICLE : Gain With Light Volume for New High Close - 10/18/2024 | View all notes | Set NEW NOTE alert | Company Profile | SEC News | Chart | Request a new note | ||||||||
Howmet Aerospace Aerospace/Defense | $113.62 | -1.07 -0.93% | $115.51 | 1,197,196 50 DAV is 2,299,000 | $115.98 -2.04% | 7/30/2024 | $93.95 | PP = $85.52 |
| MB = $89.80 | ||||||||
G - Stubbornly holding its ground perched at its all-time high, extended from any sound base. Its prior high ($106.93 on 10/21/24) and 50 DMA line ($101) define near-term support levels to watch on pullbacks. Reported Sep ''24 quarterly earnings +54% on +11% sales revenues versus the year-ago period. >>> FEATURED STOCK ARTICLE : Found Support at 50-Day Moving Average Line Before Earnings Report - 11/5/2024 | View all notes | Set NEW NOTE alert | Company Profile | SEC News | Chart | Request a new note | ||||||||
Natural Grocers Retail-Super/Mini Mkts | $34.17 | +0.28 0.83% | $34.76 | 113,022 50 DAV is 89,000 | $34.76 -1.70% | 11/5/2024 | $30.57 | PP = $30.42 |
| MB = $31.94 | ||||||||
| Most Recent Note - 11/11/2024 9:25:55 PM G - Hit a new all-time high with today''s 6th consecutive gain and its color code is changed to green after rising above its "max buy" level. See the latest FSU analysis for more details and a new annotated graph. >>> FEATURED STOCK ARTICLE : New High After 6th Consecutive Gain - 11/11/2024 | View all notes | Set NEW NOTE alert | Company Profile | SEC News | Chart | Request a new note | ||||||||
| Symbol/Exchange Company Name Industry Group | PRICE | CHANGE | Day High | Volume (% DAV) (% 50 day avg vol) | 52 Wk Hi | Featured Date | Price Featured | Pivot Featured |
| Max Buy | ||||||||
Celestica Elec-Contract Mfg | $84.06 | -0.57 -0.67% | $84.38 | 1,591,703 50 DAV is 2,291,000 | $87.99 -4.47% | 10/11/2024 | $57.62 | PP = $63.59 |
| MB = $66.77 | ||||||||
G - Hovering at its all-time high today following recently noted gains backed by above-average volume. Very extended from any sound base, its prior highs in the $63 area define initial support to watch on pullbacks. >>> FEATURED STOCK ARTICLE : Celistica Hits New All-Time High With 8th Straight Gain - 10/11/2024 | View all notes | Set NEW NOTE alert | Company Profile | SEC News | Chart | Request a new note | ||||||||
Paymentus Holdings Finance-CrdtCard/PmtPr | $26.63 | -0.15 -0.56% | $27.26 | 304,538 50 DAV is 218,000 | $27.93 -4.66% | 10/17/2024 | $26.15 | PP = $25.31 |
| MB = $26.58 | ||||||||
Y - Perched at its 52-week high today, encountering some distributional pressure. Found support near prior highs in the $24-25 area during the recent consolidation. >>> FEATURED STOCK ARTICLE : Paymentus Featured Breaking Out With Volume Driven Gains - 10/17/2024 | View all notes | Set NEW NOTE alert | Company Profile | SEC News | Chart | Request a new note | ||||||||
ResMed Medical-Products | $246.77 | -1.92 -0.77% | $249.27 | 390,472 50 DAV is 1,059,000 | $260.49 -5.27% | 10/25/2024 | $256.64 | PP = $255.28 |
| MB = $268.04 | ||||||||
Y - Volume totals have been cooling while consolidating within close striking distance of its 52-week high, but it slumped below the recently cited pivot point raising concerns. Its 50 DMA line ($243.50) defines important near-term support to watch. Damaging losses quickly negated the recent breakout. >>> FEATURED STOCK ARTICLE : ResMed Negated Friday''s Breakout Raising Concerns - 10/28/2024 | View all notes | Set NEW NOTE alert | Company Profile | SEC News | Chart | Request a new note | ||||||||
Adtalem Global Education Consumer Svcs-Education | $89.26 | -1.57 -1.73% | $91.76 | 355,877 50 DAV is 372,000 | $92.93 -3.95% | 10/30/2024 | $83.34 | PP = $80.28 |
| MB = $84.29 | ||||||||
G - Extended from the previously noted base and perched at its all-time high, holding its ground following volume-driven gains. Fundamentals remain strong. >>> FEATURED STOCK ARTICLE : Holding Ground Following Recent Technical Breakout - 11/4/2024 | View all notes | Set NEW NOTE alert | Company Profile | SEC News | Chart | Request a new note | ||||||||
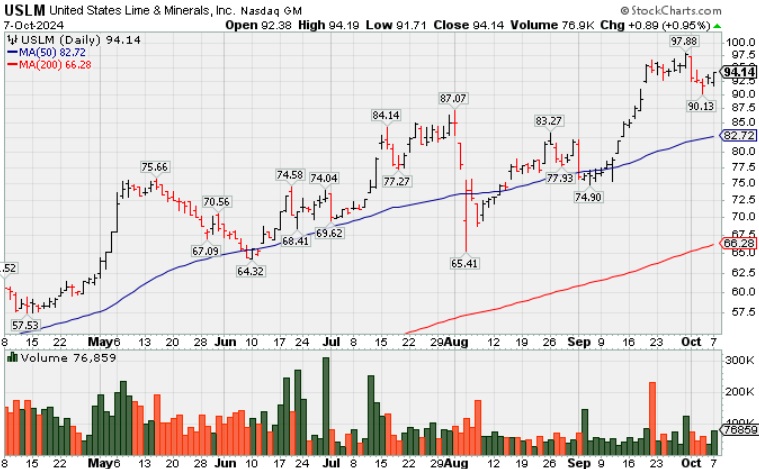
Hovering Above Prior Highs Near All-Time High - Monday, October 7, 2024
U.S. Lime & Minerals (USLM +$0.89 or +0.95% to $94.14) has seen volume totals cooling while consolidating above prior highs in the $87 area which define initial support to watch above its 50-day moving average (DMA) line ($82.72). More damaging losses would raise serious concerns.Fundamentals remain strong. USLM reported Jun '24 quarterly earnings +32% on +3% sales revenues versus the year-ago period. USLM has an Earnings Per Share Rating of 98. Prior quarterly and annual earnings (C and A criteria) history has been strong, a good match with the fact-based investment system's guidelines. Its shares split 5:1 effective on 7/15/24 and still the thinly-traded firm has only 28.6 million shares outstanding (S criteria), which can contribute to greater price volatility in the event of institutional buying or selling.
USLM was highlighted in yellow in the 2/09/24 mid-day report (read here). It was last shown in this FSU section on 9/06/24 with an annotated graph under the headline, "US Lime & Minerals Lingers Below 50-Day Average". The number of top-rated funds owning its shares rose from 192 in Mar '23 to 254 in Jun '24, a reassuring sign concerning the I criteria. Its current Up/Down Volume Ratio of 1.3 is an unbiased indication its shares have been under accumulation over the past 50 days. It has an Accumulation/Distribution rating of C and a Timeliness rating of A.
Chart courtesy of www.stockcharts.com
| Symbol/Exchange Company Name Industry Group | PRICE | CHANGE | Day High | Volume (% DAV) (% 50 day avg vol) | 52 Wk Hi | Featured Date | Price Featured | Pivot Featured |
| Max Buy | ||||||||
U.S. Lime & Minerals Bldg-Cement/Concrt/Ag | $94.14 | +0.89 0.95% | $94.19 | 55,994 50 DAV is 65,000 | $97.88 -3.82% | 9/17/2024 | $71.26 | PP = $87.23 |
| MB = $91.59 | ||||||||
G - Hovering near its all-time high. Prior high in the $87 area defines initial support to watch on pullbacks. See the latest FSU analysis for more details and a new annotated graph. >>> FEATURED STOCK ARTICLE : Hovering Above Prior Highs Near All-Time High - 10/7/2024 | View all notes | Set NEW NOTE alert | Company Profile | SEC News | Chart | Request a new note | ||||||||
Granite Construction Bldg-Heavy Construction | $80.82 | -0.47 -0.58% | $81.74 | 332,526 50 DAV is 577,000 | $81.38 -0.69% | 6/11/2024 | $59.76 | PP = $64.33 |
| MB = $67.55 | ||||||||
G - There was a "negative reversal" today after touching a new all-time high. Its 50 DMA line ($73.81) and prior low in the $70 area define important near-term support levels to watch on pullbacks. >>> FEATURED STOCK ARTICLE : Hovering Near All-Time High - 10/1/2024 | View all notes | Set NEW NOTE alert | Company Profile | SEC News | Chart | Request a new note | ||||||||
Texas Roadhouse Retail-Restaurants | $175.53 | -3.12 -1.75% | $178.25 | 747,302 50 DAV is 693,000 | $180.69 -2.86% | 7/26/2024 | $173.08 | PP = $175.82 |
| MB = $184.61 | ||||||||
| Most Recent Note - 10/2/2024 5:27:32 PM Y - Managed a "positive reversal" today and closed near the session high with a gain backed by lighter volume. Recently noted rebound above the 50 DMA line ($168.71) helped its outlook to improve. Faces no resistance due to overhead supply. >>> FEATURED STOCK ARTICLE : Wedging to New Highs With Quiet Volume Behind Gains - 9/26/2024 | View all notes | Set NEW NOTE alert | Company Profile | SEC News | Chart | Request a new note | ||||||||
Howmet Aerospace Aerospace/Defense | $102.83 | +0.80 0.78% | $103.38 | 1,778,830 50 DAV is 2,603,000 | $103.00 -0.17% | 7/30/2024 | $93.95 | PP = $85.52 |
| MB = $89.80 | ||||||||
G - Volume was light again today as it posted a small gain for a new all-time high. Its 50 DMA ($95.42) line defines important near-term support above the recent low ($90.72). >>> FEATURED STOCK ARTICLE : Gain With Light Volume for Best-Ever Close - 9/30/2024 | View all notes | Set NEW NOTE alert | Company Profile | SEC News | Chart | Request a new note | ||||||||
MercadoLibre Retail-Internet | $1,963.23 | +3.23 0.16% | $1,985.00 | 252,018 50 DAV is 325,000 | $2,161.73 -9.18% | 8/5/2024 | $1,793.73 | PP = $1,792.15 |
| MB = $1,881.76 | ||||||||
| Most Recent Note - 10/3/2024 5:03:34 PM G - Ended lower today with lighter volume after a volume-driven loss on the prior session undercut its prior low ($1,966). It is testing its 50 DMA line ($1,960) which defines important near-term support. More damaging losses would raise concerns and trigger a technical sell signal. See the latest FSU analysis for more details and a new annotated graph. >>> FEATURED STOCK ARTICLE : Testing 50-Day Moving Average Line - 10/3/2024 | View all notes | Set NEW NOTE alert | Company Profile | SEC News | Chart | Request a new note | ||||||||
| Symbol/Exchange Company Name Industry Group | PRICE | CHANGE | Day High | Volume (% DAV) (% 50 day avg vol) | 52 Wk Hi | Featured Date | Price Featured | Pivot Featured |
| Max Buy | ||||||||
Natural Grocers Retail-Super/Mini Mkts | $25.55 | -0.49 -1.88% | $25.93 | 84,144 50 DAV is 94,000 | $30.32 -15.73% | 9/5/2024 | $27.91 | PP = $27.60 |
| MB = $28.98 | ||||||||
| Most Recent Note - 10/4/2024 11:26:08 PM G - Paused today after 3 consecutive losses with above-average volume undercut its pivot point and violated its 50 DMA line ($26.24) triggering a technical sell signal. Only a prompt rebound above the 50 DMA line would help its outlook improve. See the latest FSU analysis for more details and a new annotated graph. >>> FEATURED STOCK ARTICLE : Near 50-Day Moving Average After Volume-Driven Losses - 10/4/2024 | View all notes | Set NEW NOTE alert | Company Profile | SEC News | Chart | Request a new note | ||||||||
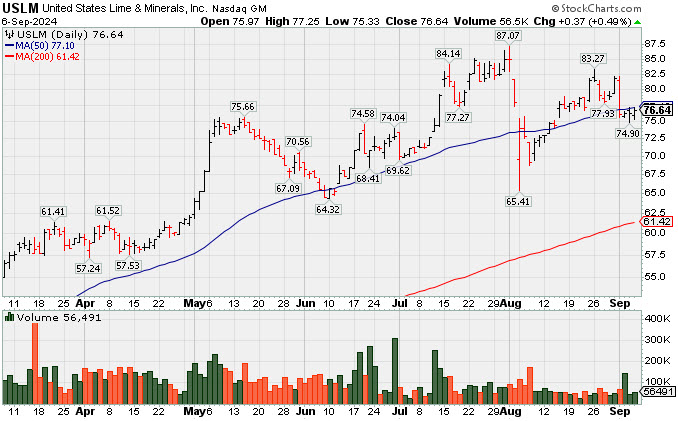
US Lime & Minerals Lingers Below 50-Day Average - Friday, September 6, 2024
U.S. Lime & Minerals (USLM +$0.37 or +0.49% to $76.64) has been stubbornly holding its ground near its 50-day moving average (DMA) line ($77.133). More damaging losses would raise serious concerns. Prior low ($65.45 on 8/05/24) defines the next important support to watch. Near-term resistance remains due to overhead supply up to the $87 level.Fundamentals remain strong. USLM reported Jun '24 quarterly earnings +32% on +3% sales revenues versus the year-ago period. USLM has an Earnings Per Share Rating of 98. Prior quarterly and annual earnings (C and A criteria) history has been strong, a good match with the fact-based investment system's guidelines. Its shares split 5:1 effective on 7/15/24 and still the thinly-traded firm has only 28.6 million shares outstanding (S criteria), which can contribute to greater price volatility in the event of institutional buying or selling.
USLM was highlighted in yellow in the 2/09/24 mid-day report (read here). It was last shown in this FSU section on 8/21/24 with an annotated graph under the headline, "Volume Cooling While Consolidating Above 50-Day Moving Average". The number of top-rated funds owning its shares rose from 192 in Mar '23 to 249 in Jun '24, a reassuring sign concerning the I criteria. Its current Up/Down Volume Ratio of 1.6 is an unbiased indication its shares have been under accumulation over the past 50 days. It has an Accumulation/Distribution rating of D+ and a Timeliness rating of A.
Chart courtesy of www.stockcharts.com
| Symbol/Exchange Company Name Industry Group | PRICE | CHANGE | Day High | Volume (% DAV) (% 50 day avg vol) | 52 Wk Hi | Featured Date | Price Featured | Pivot Featured |
| Max Buy | ||||||||
U.S. Lime & Minerals Bldg-Cement/Concrt/Ag | $76.64 | +0.37 0.49% | $77.18 | 56,491 50 DAV is 78,000 | $87.13 -12.04% | 6/18/2024 | $71.26 | PP = $75.77 |
| MB = $79.56 | ||||||||
| Most Recent Note - 9/3/2024 3:28:29 PM G - Pulling back today for a big loss testing its 50 DMA line ($76.86). More damaging losses would raise serious concerns. Near-term resistance remains due to overhead supply up to the $87 level. >>> FEATURED STOCK ARTICLE : US Lime & Minerals Lingers Below 50-Day Average - 9/6/2024 | View all notes | Set NEW NOTE alert | Company Profile | SEC News | Chart | Request a new note | ||||||||
Granite Construction Bldg-Heavy Construction | $71.39 | -0.63 -0.87% | $72.99 | 461,798 50 DAV is 691,000 | $75.36 -5.27% | 6/11/2024 | $59.76 | PP = $64.33 |
| MB = $67.55 | ||||||||
| Most Recent Note - 9/3/2024 3:32:39 PM G - Volume is light behind today''s loss, slumping from its all-time high. Its 50 DMA line ($67.11) defines inital support to watch on pullbacks above prior highs in the $64 area. >>> FEATURED STOCK ARTICLE : Granite Contruction Closes at All-Time High - 8/30/2024 | View all notes | Set NEW NOTE alert | Company Profile | SEC News | Chart | Request a new note | ||||||||
MakeMyTrip Leisure-Travel Booking | $93.40 | -0.36 -0.38% | $94.50 | 575,864 50 DAV is 680,000 | $101.50 -7.98% | 7/23/2024 | $96.92 | PP = $93.39 |
| MB = $98.06 | ||||||||
Y - Today''s loss is again testing support near its 50 DMA line ($91.44). Faces near-term resistance up to the $100 level. >>> FEATURED STOCK ARTICLE : Reversed Into Red After Quietly Touching a New High - 8/26/2024 | View all notes | Set NEW NOTE alert | Company Profile | SEC News | Chart | Request a new note | ||||||||
Texas Roadhouse Retail-Restaurants | $161.81 | -3.43 -2.08% | $167.25 | 611,031 50 DAV is 764,000 | $177.72 -8.95% | 7/26/2024 | $173.08 | PP = $175.82 |
| MB = $184.61 | ||||||||
| Most Recent Note - 9/3/2024 3:35:48 PM G - Pulling back today with below-average volume, sputtering below its 50 DMA line ($169.23) which is now downward sloping and has acted as resistance. >>> FEATURED STOCK ARTICLE : Meeting Stubborn Resistance at 50-Day Moving Average - 8/27/2024 | View all notes | Set NEW NOTE alert | Company Profile | SEC News | Chart | Request a new note | ||||||||
Howmet Aerospace Aerospace/Defense | $91.44 | -2.77 -2.94% | $94.15 | 4,136,985 50 DAV is 2,866,000 | $98.15 -6.84% | 7/30/2024 | $93.95 | PP = $85.52 |
| MB = $89.80 | ||||||||
G - Pulling back from its 52-week high with recent losses backed by higher (near average) volume after a quiet consolidation. Its 50 DMA ($87.78) and prior highs in the $85 area define important near-term support. >>> FEATURED STOCK ARTICLE : Holding Ground Near All-Time High After Pullback Testing Support - 8/29/2024 | View all notes | Set NEW NOTE alert | Company Profile | SEC News | Chart | Request a new note | ||||||||
| Symbol/Exchange Company Name Industry Group | PRICE | CHANGE | Day High | Volume (% DAV) (% 50 day avg vol) | 52 Wk Hi | Featured Date | Price Featured | Pivot Featured |
| Max Buy | ||||||||
MercadoLibre Retail-Internet | $1,986.05 | -52.13 -2.56% | $2,034.85 | 304,456 50 DAV is 315,000 | $2,064.76 -3.81% | 8/5/2024 | $1,793.73 | PP = $1,792.15 |
| MB = $1,881.76 | ||||||||
G - Pulling back today with lighter volume after hovering near its all-time high. Its 50 DMA line ($1,807) and prior highs define support to watch on pullbacks. >>> FEATURED STOCK ARTICLE : Pulled Back From New All-Time High - 9/3/2024 | View all notes | Set NEW NOTE alert | Company Profile | SEC News | Chart | Request a new note | ||||||||
Natural Grocers Retail-Super/Mini Mkts | $26.39 | -1.08 -3.93% | $27.72 | 69,177 50 DAV is 85,000 | $28.31 -6.78% | 9/5/2024 | $27.91 | PP = $27.60 |
| MB = $28.98 | ||||||||
Y - Pulling back today with lighter volume following a volume-driven gain. Color code was changed to yellow in the prior mid-day report as a valid secondary buy point was noted up to 5% above the prior high since finding support near its 10 WMA line after an earlier breakout. Reported earnings +29% on +10% sales revenues for the Jun '24 quarter versus the year ago period, its 5th consecutive strong quarter above the +25% minimum earnings guideline (C criteria). Annual earnings growth has been steady. See the latest FSU analysis for more details and an annotated graph. >>> FEATURED STOCK ARTICLE : Following Pullback a Secondary Buy Point Exists - 9/5/2024 | View all notes | Set NEW NOTE alert | Company Profile | SEC News | Chart | Request a new note | ||||||||
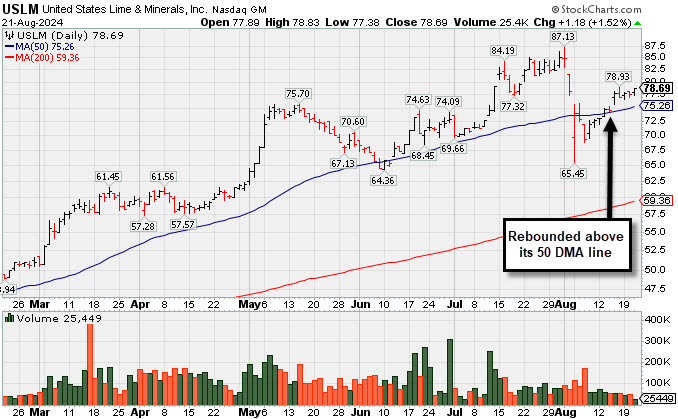
Volume Cooling While Consolidating Above 50-Day Moving Average - Wednesday, August 21, 2024
U.S. Lime & Minerals (USLM +$1.18 or +1.52% to $78.69) has seen volume totals cooling while consolidating above its 50-day moving average (DMA) line ($75.24). Near-term resistance remains due to overhead supply up to the $87 level. Do not be confused as shares split 5:1 (Featured Price and Pivot Point were adjusted).Fundamentals remain strong. USLM reported Jun '24 quarterly earnings +32% on +3% sales revenues versus the year-ago period. USLM has an Earnings Per Share Rating of 98. Prior quarterly and annual earnings (C and A criteria) history has been strong, a good match with the fact-based investment system's guidelines. Its shares split 5:1 effective on 7/15/24 and still the thinly-traded firm has only 28.6 million shares outstanding (S criteria), which can contribute to greater price volatility in the event of institutional buying or selling.
USLM was highlighted in yellow in the 2/09/24 mid-day report (read here). It was last shown in this FSU section on 7/22/24 with an annotated graph under the headline, "Recent Breakout Triggered New (or Add-On) Technical Buy Signal". The number of top-rated funds owning its shares rose from 192 in Mar '23 to 246 in Jun '24, a reassuring sign concerning the I criteria. Its current Up/Down Volume Ratio of 2.0 is an unbiased indication its shares have been under accumulation over the past 50 days. It has an Accumulation/Distribution rating of B- and a Timeliness rating of A.
Chart courtesy of www.stockcharts.com
| Symbol/Exchange Company Name Industry Group | PRICE | CHANGE | Day High | Volume (% DAV) (% 50 day avg vol) | 52 Wk Hi | Featured Date | Price Featured | Pivot Featured |
| Max Buy | ||||||||
U.S. Lime & Minerals Bldg-Cement/Concrt/Ag | $78.69 | +1.18 1.52% | $78.83 | 25,449 50 DAV is 96,000 | $87.13 -9.69% | 6/18/2024 | $71.26 | PP = $75.77 |
| MB = $79.56 | ||||||||
| Most Recent Note - 8/20/2024 6:02:00 PM G - Volume totals have been cooling while consolidating above its 50 DMA line ($75). Near-term resistance remains due to overhead supply up to the $87 level. >>> FEATURED STOCK ARTICLE : Volume Cooling While Consolidating Above 50-Day Moving Average - 8/21/2024 | View all notes | Set NEW NOTE alert | Company Profile | SEC News | Chart | Request a new note | ||||||||
Granite Construction Bldg-Heavy Construction | $71.13 | +0.84 1.20% | $71.22 | 250,363 50 DAV is 776,000 | $73.01 -2.57% | 6/11/2024 | $59.76 | PP = $64.33 |
| MB = $67.55 | ||||||||
G - Volume was below average behind today''s small gain. Prior highs in the $64 area define important support to watch coinciding with its 50 DMA line ($65.28). >>> FEATURED STOCK ARTICLE : Hit New High While Making Steady Progress - 7/31/2024 | View all notes | Set NEW NOTE alert | Company Profile | SEC News | Chart | Request a new note | ||||||||
MakeMyTrip Leisure-Travel Booking | $99.83 | +6.33 6.77% | $99.90 | 940,527 50 DAV is 705,000 | $100.22 -0.39% | 7/23/2024 | $96.92 | PP = $93.39 |
| MB = $98.06 | ||||||||
Y - Posted a big gain today with +34% above-average volume and ended near the session high for a best-ever close. Recently found prompt support near its 50 DMA line ($88). >>> FEATURED STOCK ARTICLE : Volume Driven Trip to New Highs - 7/23/2024 | View all notes | Set NEW NOTE alert | Company Profile | SEC News | Chart | Request a new note | ||||||||
Texas Roadhouse Retail-Restaurants | $169.61 | +2.88 1.73% | $169.67 | 565,705 50 DAV is 824,000 | $177.72 -4.56% | 7/26/2024 | $173.08 | PP = $175.82 |
| MB = $184.61 | ||||||||
G - Posted a gain today with below-average volume. Closed just above its 50 DMA line ($169.51) which is now downward sloping and has acted as resistance. >>> FEATURED STOCK ARTICLE : Encountered Distributional Pressure When Poised to Break Out - 7/26/2024 | View all notes | Set NEW NOTE alert | Company Profile | SEC News | Chart | Request a new note | ||||||||
Howmet Aerospace Aerospace/Defense | $96.26 | +0.63 0.66% | $96.61 | 1,321,852 50 DAV is 3,118,000 | $97.29 -1.06% | 7/30/2024 | $93.95 | PP = $85.52 |
| MB = $89.80 | ||||||||
| Most Recent Note - 8/20/2024 6:00:44 PM Y - Volume totals have still been cooling while hovering near its all-time high. Found prompt support after a pullback tested prior highs in the $85 area defining initial support to watch above its 50 DMA line ($84.21). >>> FEATURED STOCK ARTICLE : Breakaway Gap For Howmet Aerospace - 7/30/2024 | View all notes | Set NEW NOTE alert | Company Profile | SEC News | Chart | Request a new note | ||||||||
| Symbol/Exchange Company Name Industry Group | PRICE | CHANGE | Day High | Volume (% DAV) (% 50 day avg vol) | 52 Wk Hi | Featured Date | Price Featured | Pivot Featured |
| Max Buy | ||||||||
MercadoLibre Retail-Internet | $2,007.46 | +1.80 0.09% | $2,015.46 | 237,681 50 DAV is 320,000 | $2,029.99 -1.11% | 8/5/2024 | $1,793.73 | PP = $1,792.15 |
| MB = $1,881.76 | ||||||||
G - Posted a gain today with light volume, hovering near its 52-week high. Prior highs define initial support to watch on pullbacks. >>> FEATURED STOCK ARTICLE : Finished Flat When Poised to Breakout - 8/5/2024 | View all notes | Set NEW NOTE alert | Company Profile | SEC News | Chart | Request a new note | ||||||||
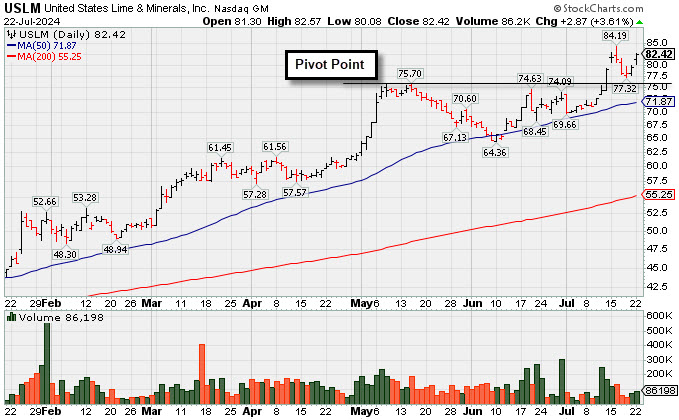
Recent Breakout Triggered New (or Add-On) Technical Buy Signal - Monday, July 22, 2024
U.S. Lime & Minerals (USLM +$2.87 or +3.61% to $82.42) posted a gain for a best-ever close today near its all-time high. Volume totals recently cooled following noted volume-driven gains. Prior highs in the $74-75 area define initial support to watch above its 50-day moving average (DMA) line ($71.88). Do not be confused as shares split 5:1 (Featured Price and Pivot Point were adjusted). The latest pivot point cited was based on its 5/15/24 high plus 10 cents. Subsequent gains above the pivot point backed by at least +40% above average volume triggered a new (or add-on) technical buy signal.Fundamentals remain strong. USLM reported Mar '24 quarterly earnings +31% on +7% sales revenues versus the year-ago period. USLM has a highest possible Earnings Per Share Rating of 99. Prior quarterly and annual earnings (C and A criteria) history has been strong, a good match with the fact-based investment system's guidelines. Its shares split 5:1 effective on 7/15/24 and still the thinly-traded firm has only 28.5 million shares outstanding (S criteria), which can contribute to greater price volatility in the event of institutional buying or selling.
USLM was highlighted in yellow in the 2/09/24 mid-day report (read here). It was last shown in this FSU section on 6/28/24 with an annotated graph under the headline, "In Striking Distance of All-Time High After Volume-Driven Gains". The number of top-rated funds owning its shares rose from 192 in Mar '23 to 238 in Mar '24, a reassuring sign concerning the I criteria. Its current Up/Down Volume Ratio of 1.0 is an unbiased indication its shares have been neutral concerning accumulation/distribution over the past 50 days. It has an Accumulation/Distribution rating of A and a Timeliness rating of B.
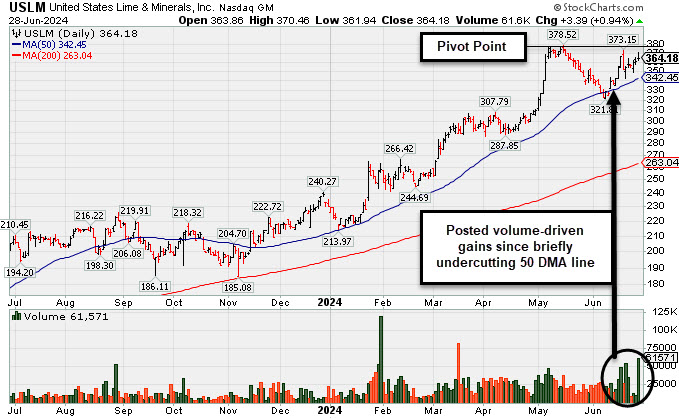
in Striking Distance of All-Time High After Volume-Driven Gains - Friday, June 28, 2024
U.S. Lime & Minerals (USLM +$3.39 or +0.94% to $364.18) has posted several gains backed by above average volume while recently consolidating above its 50-day moving average (DMA) line ($342.57). It is perched within close striking distance of its all-time high. Its color code was changed to yellow with new pivot point cited based on its 5/15/24 high plus 10 cents. Subsequent gains above the pivot point backed by at least +40% above average volume may trigger a new (or add-on) technical buy signal. It found prompt support after a streak of losses briefly undercut its 50 DMA line.
Fundamentals remain strong. USLM reported Mar '24 quarterly earnings +31% on +7% sales revenues versus the year-ago period. USLM has a highest possible Earnings Per Share Rating of 99. Prior quarterly and annual earnings (C and A criteria) history has been strong, a good match with the fact-based investment system's guidelines. The thinly traded firm has only 5.7 million shares outstanding (S criteria), which can contribute to greater price volatility in the event of institutional buying or selling.
USLM was highlighted in yellow in the 2/09/24 mid-day report (read here). It was last shown in this FSU section on 6/06/24 with an annotated graph under the headline, "Streak of Losses Testing 50-Day Moving Average Line". The number of top-rated funds owning its shares rose from 192 in Mar '23 to 231 in Mar '24, a reassuring sign concerning the I criteria. Its current Up/Down Volume Ratio of 1.3 is an unbiased indication its shares have been under accumulation over the past 50 days.
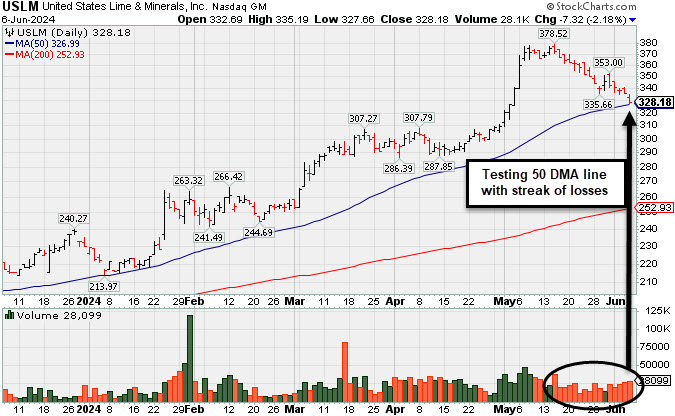
Streak of Losses Testing 50-Day Moving Average Line - Thursday, June 6, 2024
U.S. Lime & Minerals (USLM -$7.36 -or 2.19% to $328.14) ended near the session low as it fell for a 15th loss in the span of 16 sessions, testing its 50-day moving average (DMA) line ($327) which defines important near-term support to watch. More damaging losses would raise concerns and trigger a technical sell signal.
Fundamentals remain strong. USLM reported Mar '24 quarterly earnings +31% on +7% sales revenues versus the year-ago period. USLM has a highest possible Earnings Per Share Rating of 99. Prior quarterly and annual earnings (C and A criteria) history has been strong, a good match with the fact-based investment system's guidelines. The thinly traded firm has only 5.7 million shares outstanding (S criteria), which can contribute to greater price volatility in the event of institutional buying or selling.
USLM was highlighted in yellow in the 2/09/24 mid-day report (read here). It was last shown in this FSU section on 5/14/24 with an annotated graph under the headline, "Stubbornly Held Ground and Posted Quiet Gain for Best-Ever Close". The number of top-rated funds owning its shares rose from 192 in Mar '23 to 230 in Mar '24, a reassuring sign concerning the I criteria. Its current Up/Down Volume Ratio of 0.9 is an unbiased indication its shares have been under slight distributional pressure over the past 50 days.
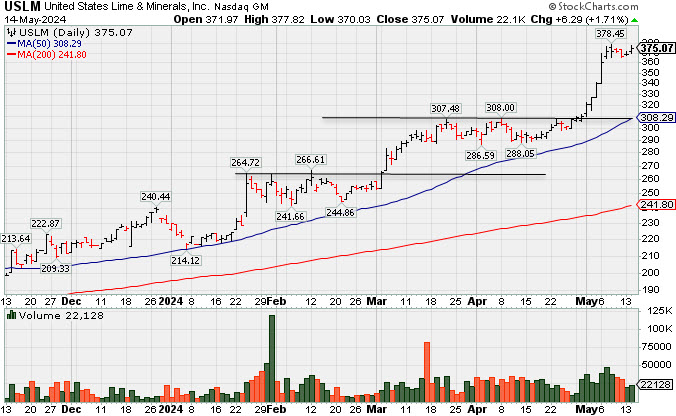
Stubbornly Held Ground and Posted Quiet Gain for Best-Ever Close - Tuesday, May 14, 2024
U.S. Lime & Minerals (USLM +$6.29 or +1.71% to $375.07) has been consolidating in a tight range near its all-time high following a recent streak of 9 consecutive volume-driven gains. Its 50-day moving average (DMA) line ($308) coincides with prior highs defining important near-term support to watch on pullbacks. During the ongoing market correction (M criteria) greater caution is important for all investors. New buying efforts should be avoided until a follow-through day signals a new confirmed uptrend.
Bullish action came after it reported Mar '24 quarterly earnings +31% on +7% sales revenues versus the year-ago period. USLM has a highest possible Earnings Per Share Rating of 99. Prior quarterly and annual earnings (C and A criteria) history has been strong, a good match with the fact-based investment system's guidelines. The thinly traded firm has only 5.7 million shares outstanding (S criteria), which can contribute to greater price volatility in the event of institutional buying or selling.
USLM was highlighted in yellow in the 2/09/24 mid-day report (read here) and last shown in this FSU section on 4/26/24 with an annotated graph under the headline, "Trading in Tight Range Near High". The number of top-rated funds owning its shares rose from 192 in Mar '23 to 228 in Mar '24, a reassuring sign concerning the I criteria. Its current Up/Down Volume Ratio of 1.6 is an unbiased indication its shares have been under accumulation over the past 50 days.
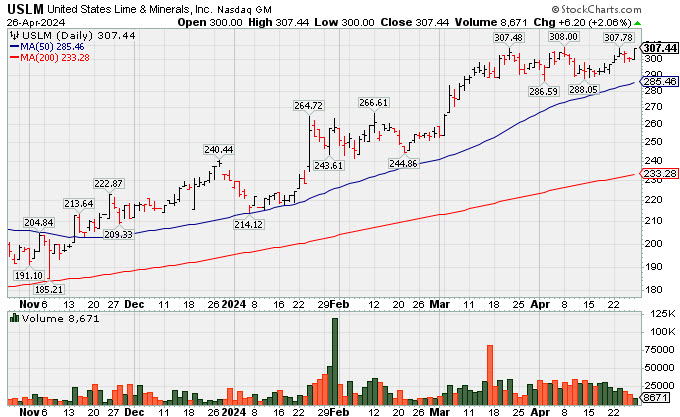
Trading in Tight Range Near High - Friday, April 26, 2024
U.S. Lime & Minerals (USLM +$6.20 or +2.06% to $307.44) has been consolidating in a tight range near its all-time high. Its 50-day moving average (DMA) line ($285) and prior lows define near-term support to watch. During the ongoing market correction (M criteria) greater caution is important for all investors. New buying efforts should be avoided until a follow-through day signals a new confirmed uptrend.
USLM has a highest possible Earnings Per Share Rating of 99. It reported Dec '23 quarterly earnings +57% on +13% sales revenues versus the year ago period. Its prior quarterly and annual earnings (C and A criteria) history has been strong, a good match with the fact-based investment system's guidelines. The thinly traded firm has only 5.7 million shares outstanding (S criteria), which can contribute to greater price volatility in the event of institutional buying or selling.
USLM was highlighted in yellow in the 2/09/24 mid-day report (read here) and last shown in this FSU section on 4/05/24 with an annotated graph under the headline, "Gain With Light Volume for Best Ever Close". The number of top-rated funds owning its shares rose from 192 in Mar '23 to 227 in Mar '24, a reassuring sign concerning the I criteria. Its current Up/Down Volume Ratio of 1.2 is an unbiased indication its shares have been under accumulation over the past 50 days.
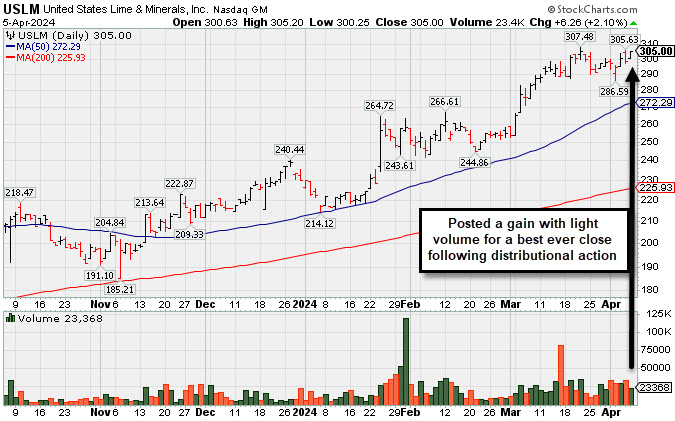
Gain With Light Volume for Best Ever Close - Friday, April 5, 2024
U.S. Lime & Minerals (USLM +$6.32 or +2.12% to $305.06) posted a gain with light volume after encountering distributional action and managed to finish at a best-ever close. It is hovering near its all-time high in a tight range, perched well above its 50-day moving average (DMA) line ($272.39) which defines near-term support to watch
USLM has a highest possible Earnings Per Share Rating of 99. It reported Dec '23 quarterly earnings +57% on +13% sales revenues versus the year ago period. Its prior quarterly and annual earnings (C and A criteria) history has been strong, a good match with the fact-based investment system's guidelines. The thinly traded firm has only 5.7 million shares outstanding (S criteria), which can contribute to greater price volatility in the event of institutional buying or selling.
USLM was last shown in this FSU section on 3/13/24 with an annotated graph under the headline, "Hit New All Time High With Light Volume Behind 5th Straight Gain". The number of top-rated funds owning its shares rose from 192 in Mar '23 to 228 in Dec '23, a reassuring sign concerning the I criteria. Its current Up/Down Volume Ratio of 1.4 is an unbiased indication its shares have been under accumulation over the past 50 days.
Chart courtesy of www.stockcharts.com
| Symbol/Exchange Company Name Industry Group | PRICE | CHANGE | Day High | Volume (% DAV) (% 50 day avg vol) | 52 Wk Hi | Featured Date | Price Featured | Pivot Featured |
| Max Buy | ||||||||
Arista Networks Computer-Networking | $297.60 | +8.83 3.06% | $298.25 | 1,451,932 50 DAV is 2,729,000 | $307.74 -3.29% | 3/18/2024 | $188.84 | PP = $292.76 |
| MB = $307.40 | ||||||||
Y - Still hovering near its all-time high with recent gains lacking great volume conviction. Found support near prior highs in the $292 area and additional near-term support to watch is its 50 DMA line ($279) and an upward trendline connecting its October-March lows. >>> FEATURED STOCK ARTICLE : Consolidating Abover Recent Highs and Above 50-Day Average - 3/26/2024 | View all notes | Set NEW NOTE alert | Company Profile | SEC News | Chart | Request a new note | ||||||||
Novo Nordisk ADR Medical-Ethical Drugs | $125.86 | +1.90 1.53% | $126.17 | 4,994,996 50 DAV is 5,404,000 | $138.28 -8.98% | 3/1/2024 | $124.23 | PP = $124.97 |
| MB = $131.22 | ||||||||
| Most Recent Note - 4/4/2024 3:57:27 PM Y - Quietly pulling back below the pivot point of the previously noted "3-weeks tight" base and testing its 50 DMA line ($123.46) which defines important near-term support. See the latest FSU analysis for more details and an annotated graph. >>> FEATURED STOCK ARTICLE : Volume Cools While Consolidating Above 50-Day Moving Average Line - 4/3/2024 | View all notes | Set NEW NOTE alert | Company Profile | SEC News | Chart | Request a new note | ||||||||
Axon Enterprise Security/Sfty | $309.90 | +3.07 1.00% | $312.25 | 183,787 50 DAV is 497,000 | $325.63 -4.83% | 4/5/2024 | $309.90 | PP = $325.73 |
| MB = $342.02 | ||||||||
Y - Color code is changed to yellow with new pivot point cited based on its 3/04/24 high plus 10 cents while hovering in a tight range near its all-time high. Volume-driven gains above the pivot point are needed to trigger a proper technical buy signal. Its 50-day moving average (DMA) line ($290) defines near-term support to watch. Fundamentals remain strong. >>> FEATURED STOCK ARTICLE : Hovering Near All-Time High; Spiked Higher Following Earnings - 3/14/2024 | View all notes | Set NEW NOTE alert | Company Profile | SEC News | Chart | Request a new note | ||||||||
TransDigm Group Aerospace/Defense | $1,235.28 | +30.92 2.57% | $1,237.13 | 152,925 50 DAV is 217,000 | $1,246.22 -0.88% | 12/12/2023 | $1,000.39 | PP = $1,013.18 |
| MB = $1,063.84 | ||||||||
G - Rebounded today following a "negative reversal" on the prior session after touching a new all-time high. Its 50 DMA line ($1,168) defines near-term support to watch. >>> FEATURED STOCK ARTICLE : Perched in Tight Range Encountering Distribtion Near All-Time High - 3/15/2024 | View all notes | Set NEW NOTE alert | Company Profile | SEC News | Chart | Request a new note | ||||||||
CrowdStrike Holdings Computer Sftwr-Security | $315.50 | +6.31 2.04% | $317.50 | 1,768,161 50 DAV is 3,997,000 | $365.00 -13.56% | 1/2/2024 | $246.42 | PP = $261.91 |
| MB = $275.01 | ||||||||
| Most Recent Note - 4/4/2024 3:54:49 PM G - Slumping below its 50 DMA ($317) today with light volume amid widespread market weakness. Only a prompt rebound above the 50 DMA line would help its outlook improve. It has not formed a sound base of sufficient length. Fundamentals remain strong after it reported Jan ''24 quarterly earnings +102% on +33% sales revenues versus the year-ago period. >>> FEATURED STOCK ARTICLE : 50-Day Moving Average Line Support Being Tested - 4/1/2024 | View all notes | Set NEW NOTE alert | Company Profile | SEC News | Chart | Request a new note | ||||||||
| Symbol/Exchange Company Name Industry Group | PRICE | CHANGE | Day High | Volume (% DAV) (% 50 day avg vol) | 52 Wk Hi | Featured Date | Price Featured | Pivot Featured |
| Max Buy | ||||||||
Paccar Trucks and Parts-Hvy Duty | $122.21 | +1.68 1.39% | $122.75 | 1,391,679 50 DAV is 2,223,000 | $125.50 -2.62% | 1/23/2024 | $100.35 | PP = $98.57 |
| MB = $103.50 | ||||||||
G - Posted a 2nd consecutive gain today with lighter volume after pulling back from its all-time high. Very extended from any sound base, its 50 DMA line ($112.61) defines near-term support to watch. Fundamentals remain strong. >>> FEATURED STOCK ARTICLE : Hit New High With 5th Consecutive Gain - 3/21/2024 | View all notes | Set NEW NOTE alert | Company Profile | SEC News | Chart | Request a new note | ||||||||
Hubbell Electrical-Power/Equipmt | $417.08 | +4.52 1.10% | $423.57 | 449,662 50 DAV is 441,000 | $429.61 -2.92% | 1/30/2024 | $343.26 | PP = $336.83 |
| MB = $353.67 | ||||||||
| Most Recent Note - 4/4/2024 3:55:51 PM G - Reversed into the red today after hitting another new all-time high. It is very extended from the previously noted base. Its 50 DMA line ($377) defines important support to watch. >>> FEATURED STOCK ARTICLE : Hubbell Perched at All-Time High After 5 Weekly Gains - 3/22/2024 | View all notes | Set NEW NOTE alert | Company Profile | SEC News | Chart | Request a new note | ||||||||
Manhattan Associates Computer Sftwr-Enterprse | $243.51 | +1.48 0.61% | $245.41 | 315,021 50 DAV is 384,000 | $266.94 -8.78% | 1/31/2024 | $240.57 | PP = $230.71 |
| MB = $242.25 | ||||||||
G - Sputtering beneath its 50 DMA line ($247.20) this week raising concerns. Recent lows in the $239-241 area define important near-term support where violations would raise greater concerns and trigger a worrisome technical sell signal. >>> FEATURED STOCK ARTICLE : Manhattan Associates Consolidating Above 50-Day Moving Average - 3/25/2024 | View all notes | Set NEW NOTE alert | Company Profile | SEC News | Chart | Request a new note | ||||||||
U.S. Lime & Minerals Bldg-Cement/Concrt/Ag | $305.06 | +6.32 2.12% | $305.20 | 23,368 50 DAV is 25,000 | $307.48 -0.79% | 2/9/2024 | $254.68 | PP = $265.09 |
| MB = $278.34 | ||||||||
G - Posted a gain today with lighter volume for a best-ever close, extended from the previously noted base. Its 50 DMA line ($272) defines near-term support to watch. See the latest FSU analysis for more detailed analysis and an annotated graph. >>> FEATURED STOCK ARTICLE : Gain With Light Volume for Best Ever Close - 4/5/2024 | View all notes | Set NEW NOTE alert | Company Profile | SEC News | Chart | Request a new note | ||||||||
ServiceNow Computer Sftwr-Enterprse | $783.50 | +25.95 3.43% | $791.88 | 1,284,951 50 DAV is 1,249,000 | $815.32 -3.90% | 2/22/2024 | $771.75 | PP = $815.32 |
| MB = $856.09 | ||||||||
Y - Posted a solid gain today with average (higher) volume, finding support near its 50 DMA line ($770). Prior lows in the $730 area define the next important near-term support to watch. >>> FEATURED STOCK ARTICLE : NOW Quietly Rebounded Above 50-Day Moving Average Line - 3/20/2024 | View all notes | Set NEW NOTE alert | Company Profile | SEC News | Chart | Request a new note | ||||||||
| Symbol/Exchange Company Name Industry Group | PRICE | CHANGE | Day High | Volume (% DAV) (% 50 day avg vol) | 52 Wk Hi | Featured Date | Price Featured | Pivot Featured |
| Max Buy | ||||||||
Synopsys Computer Sftwr-Design | $574.71 | +7.60 1.34% | $578.90 | 773,639 50 DAV is 1,101,000 | $629.38 -8.69% | 2/22/2024 | $600.65 | PP = $582.85 |
| MB = $611.99 | ||||||||
Y - Volume totals have been cooling while still consolidating just above near-term support at its 50 DMA line ($566). More damaging losses would raise concerns and trigger a technical sell signal. Previously noted - " A strong volume-driven gain and close above the pivot point is needed to clinch a proper technical buy signal." >>> FEATURED STOCK ARTICLE : Rallying From Support at 50-Day Moving Average Line - 3/19/2024 | View all notes | Set NEW NOTE alert | Company Profile | SEC News | Chart | Request a new note | ||||||||
Paymentus Holdings Finance-CrdtCard/PmtPr | $20.68 | +0.13 0.63% | $20.74 | 349,616 50 DAV is 363,000 | $25.21 -17.97% | 3/5/2024 | $19.97 | PP = $18.89 |
| MB = $19.83 | ||||||||
| Most Recent Note - 4/4/2024 3:58:14 PM G - Suffering a 4th consecutive loss today with above-average volume. It is extended from the previously noted base. Its 50 DMA line ($18.60) coincides with prior highs in the $18 range defining important support to watch on pullbacks. >>> FEATURED STOCK ARTICLE : Consolidating After Powerful Breakout and Volume-Driven Gains - 3/27/2024 | View all notes | Set NEW NOTE alert | Company Profile | SEC News | Chart | Request a new note | ||||||||
HubSpot Comp Sftwr-Spec Enterprs | $670.00 | +12.15 1.85% | $688.87 | 916,674 50 DAV is 508,000 | $693.85 -3.44% | 4/4/2024 | $686.66 | PP = $660.10 |
| MB = $693.11 | ||||||||
Y - Gapped up today and on track for a solid gain. On the prior session it finished in middle of its intra-day range after highlighted yellow in the mid-day report with pivot point cited based on its 2/09/24 high plus 10 cents. Hit a new 52-week high with a volume-driven gain triggering a technical buy signal after finding prompt support at its 50 DMA line ($617) in recent weeks. Reported Dec '23 quarterly earnings +59% on +24% sales revenues versus the year-ago period, its 6th consecutive quarterly comparison well above the +25% minimum guideline (C criteria). Annual earnings history (A criteria) has been strong. Faces some resistance due to old overhead supply up to the $866 level. See the latest FSU analysis for more details and a new annotated graph. >>> FEATURED STOCK ARTICLE : Encountered Distributional Pressure and Finished Below Pivot Point - 4/4/2024 | View all notes | Set NEW NOTE alert | Company Profile | SEC News | Chart | Request a new note | ||||||||
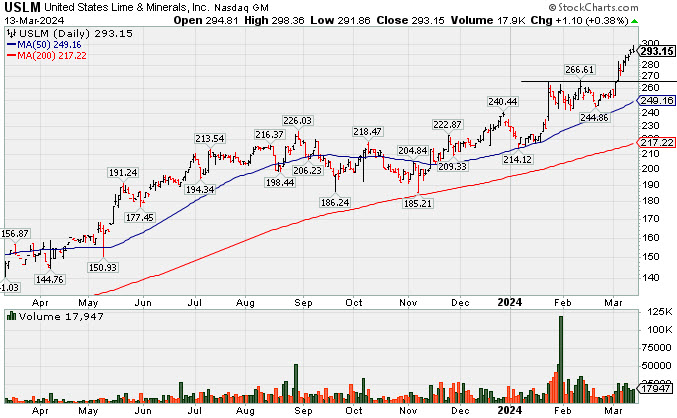
Hit New All Time High With Light Volume Behind 5th Straight Gain - Wednesday, March 13, 2024
U.S. Lime & Minerals (USLM +$1.10 or +0.38% to $293.15) wedged higher with below average volume behind today's 5th consecutive gain hitting another new all-time high. It is extended from any sound base. Prior highs in the $265-266 area define initial support to watch above its 50-day moving average (DMA) line.
It has a highest possible earnings Per Share Rating of 99. It reported Dec '23 quarterly earnings +57% on +13% sales revenues versus the year ago period. Its prior quarterly and annual earnings (C and A criteria) history has been strong, a good match with the fact-based investment system's guidelines. The thinly traded firm has only 5.7 million shares outstanding (S criteria), which can contribute to greater price volatility in the event of institutional buying or selling.
It has a highest possible earnings Per Share Rating of 99. It reported Dec '23 quarterly earnings +57% on +13% sales revenues versus the year ago period. Its prior quarterly and annual earnings (C and A criteria) history has been strong, a good match with the fact-based investment system's guidelines. The thinly traded firm has only 5.7 million shares outstanding (S criteria), which can contribute to greater price volatility in the event of institutional buying or selling.
USLM was last shown in this FSU section on 2/09/24 with an annotated graph under the headline, "Strong Finish for Thinly Traded U.S Lime & Minerals". The number of top-rated funds owning its shares rose from 192 in Mar '23 to 221 in Dec '23, a reassuring sign concerning the I criteria. Its current Up/Down Volume Ratio of 1.7 is an unbiased indication its shares have been under accumulation over the past 50 days.
Chart courtesy of www.stockcharts.com
Strong Finish for Thinly Traded U.S Lime & Minerals - Friday, February 9, 2024
U.S. Lime & Minerals (USLM +$5.84 or +2.30% to $259.99) finished strong for a best-ever close after it was highlighted in yellow in the earlier mid-day report (read here) with pivot point cited based on its 1/24/24 high plus 10 cents. It hovered in a tight range perched near its 52-week high, and appeared to be forming an advanced "3 weeks tight" base. However, its strong finish on Friday led to a +4% weekly gain. A proper "3-weeks tight" base has 3 closes with less than a 2% weekly gain or loss for the last 2 weeks. Subsequent gains above the pivot point backed by at least +40% above average volume may still help trigger a convincing technical buy signal.
It has a highest possible earnings Per Share Rating of 99. It reported Dec '23 quarterly earnings +57% on +13% sales revenues versus the year ago period. Its prior quarterly and annual earnings (C and A criteria) history has been strong, a good match with the fact-based investment system's guidelines.
The thinly traded firm has only 5.7 million shares outstanding (S criteria), which can contribute to greater price volatility in the event of institutional buying or selling. The number of top-rated funds owning its shares rose from 192 in Mar '23 to 217 in Dec '23, a reassuring sign concerning the I criteria. Its current Up/Down Volume Ratio of 1.3 is an unbiased indication its shares have been under accumulation over the past 50 days.
