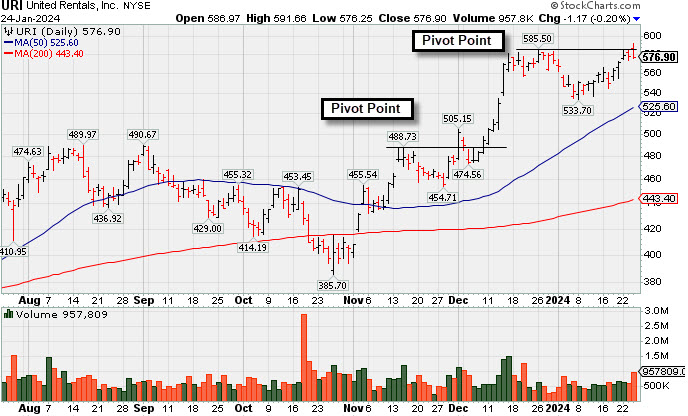
Negative Reversal After New High for United Rentals - Wednesday, January 24, 2024
United Rentals Inc (URI -$1.17 or -0.20% to $576.90) had a "negative reversal" today for a loss with above average volume after touching a new all-time high. Its recent low ($533.70) and its 50-day moving average (DMA) line ($525.60) define near-term support to watch. A new pivot point was cited based on its 12/26/23 high plus 10 cents. Subsequent gains above the pivot point backed by at least +40% above average volume may trigger a new technical buy signal.
URI finished strong after highlighted in yellow in the 12/01/23 mid-day report (read here) with pivot point cited based on its 11/15/23 high after a cup-with-handle base. The gain above the pivot point backed by +51% above average volume triggered a proper technical buy signal. It was last shown in this FSU section on 12/19/23 with an annotated graph under the headline, "Perched Near All-Time High Following Volume-Driven Gains".
URI has a 96 Earnings Per Share Rating. Through Sep '23 its quarterly earnings increases versus the year ago periods have been above the +25% minimum guideline (C criteria). Annual earnings (A criteria) history had a downturn in FY '20 like many companies during the pandemic. Consensus estimates for FY '23 and '24 have been increasing, an encouraging sign.
The number of top-rated funds owning its shares reportedly rose from 2,204 in Sep '23 to 2,251 in Dec '23, not a reassuring sign concerning the I criteria. Its current Up/Down Volume Ratio of 1.5 is an unbiased indication its shares have been under accumulation over the past 50 days.
Chart courtesy of www.stockcharts.com
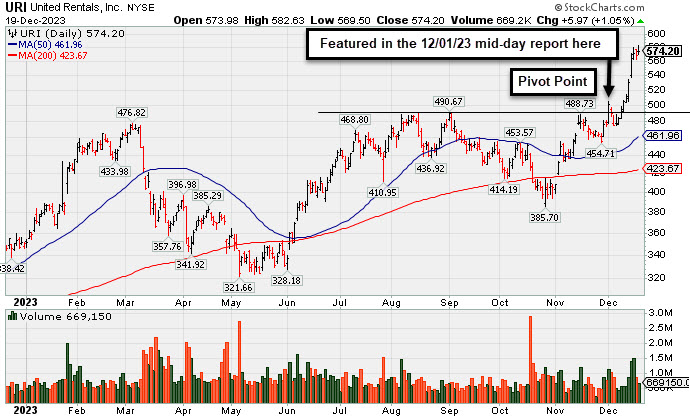
Perched Near All-Time High Following Volume-Driven Gains - Tuesday, December 19, 2023
United Rentals Inc (URI +$5.97 or +1.05% to $574.20) is consolidating following a noted streak of 7 consecutive gains for new all-time highs. On pullbacks, prior highs define near-term support to watch above its 50-day moving average (DMA) line.
URI finished strong after highlighted in yellow in the 12/01/23 mid-day report (read here) with pivot point cited based on its 11/15/23 high after a cup-with-handle base. The gain above the pivot point backed by +51% above average volume triggered a proper technical buy signal. It was shown in greater detail that evening with an annotated graph under the headline, "New Breakout For United Rentals".
URI has a 96 Earnings Per Share Rating. Through Sep '23 its quarterly earnings increases versus the year ago periods have been above the +25% minimum guideline (C criteria). Annual earnings (A criteria) history had a downturn in FY '20 like many companies during the pandemic. Consensus estimates for FY '23 and '24 have been increasing, an encouraging sign.
The number of top-rated funds owning its shares reportedly fell from 2,267 in Mar '23 to 2,192 in Sep '23, not a reassuring sign concerning the I criteria. Its current Up/Down Volume Ratio of 1.2 is an unbiased indication its shares have been under accumulation over the past 50 days.
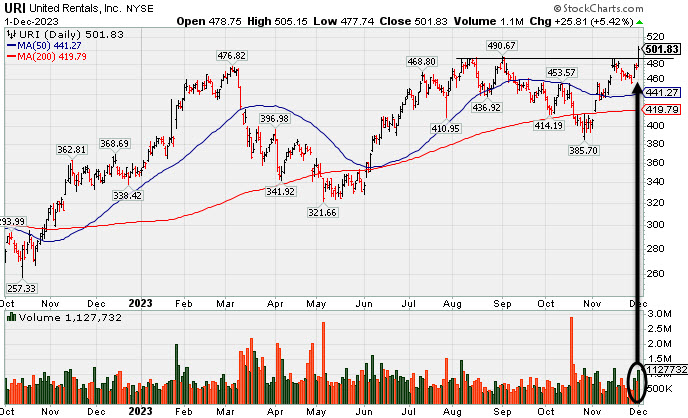
New Breakout For United Rentals - Friday, December 1, 2023
United Rentals Inc (URI +$25.81 or +5.42% to $501.83) finished strong after highlighted in yellow in the earlier mid-day report (read here) with new pivot point cited based on its 11/15/23 high after a cup-with-handle base. It hit a new 52-week high with today's big gain clearing prior resistance in the $488-492 area. The gain above the pivot point backed by +51% above average volume triggered a proper technical buy signal.
URI has a 96 Earnings Per Share Rating. Through Sep '23 its quarterly earnings increases versus the year ago periods have been above the +25% minimum guideline (C criteria). Annual earnings (A criteria) history had a downturn in FY '20 like many companies during the pandemic. Consensus estimates for FY '23 and '24 have been increasing, an encouraging sign.
The number of top-rated funds owning its shares reportedly fell from 2,266 in Mar '23 to 2,188 in Sep '23, not a reassuring sign concerning the I criteria. Its current Up/Down Volume Ratio of 0.8 is also an unbiased indication its shares have been under distributional pressure over the past 50 days. Follow-through gains would be a rerassuring sign of fresh institutional buying demand that could lead to a meaningful advance in price.