Wedged to New Highs With Earnings Report Due Soon - Tuesday, February 16, 2021
Hit New All-Time High With Gain Backed by Average Volume - Tuesday, January 19, 2021
Hit New High With Light Volume Behind 4th Consecutive Gain - Tuesday, December 22, 2020
Consolidating Back Above 50-Day Moving Average Line - Tuesday, December 1, 2020
Rebound Above 50-Day Moving Average Helped Technical Stance - Wednesday, November 4, 2020
Recently Wedged Into New High Territory - Friday, October 16, 2020
TREX Rebounded Above 50-Day Moving Average - Wednesday, September 30, 2020
Slumped Below 50-Day Average With Loss on Light Volume - Thursday, September 17, 2020
Fall Below "Max Buy" Level Also Undercut 50-Day Moving Average - Friday, September 4, 2020
Wedging Into New High Territory After Latest Earnings Report - Wednesday, August 19, 2020
Perched Near All Time High With Earnings News Due Monday - Thursday, July 30, 2020
Quietly Perched Near All-Time High After Forming a New Base - Monday, July 6, 2020
Pullback Toward Prior Highs Which Define Near-Term Support - Thursday, June 11, 2020
Bullish Action Continues for Top Wood Alternative Firm - Wednesday, May 20, 2020
Gapped Up for Volume-Driven Gain and Hit a New All-Time High - Tuesday, May 5, 2020
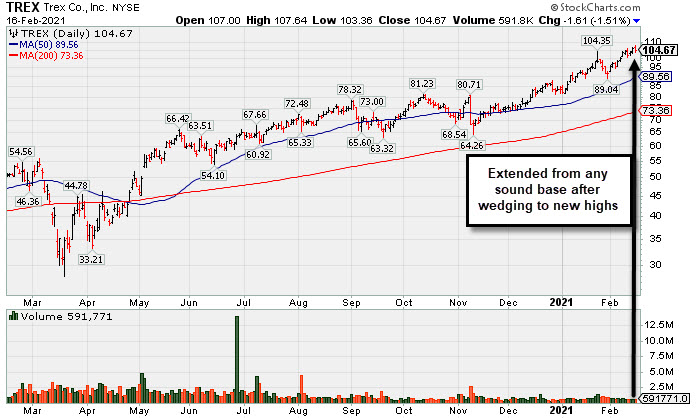
Wedged to New Highs With Earnings Report Due Soon - Tuesday, February 16, 2021
Trex Company Inc (TREX) touched another new all-time high with today but reversed into the red. Recent gains were backed by below average volume, action termed "wedging". Its 50-day moving average (DMA) line ($89.56) and the recent low ($89.04 on 1/29/21) coincide defining important near-term support to watch on pullbacks.
TREX currently has a 94 Earnings Per Share Rating. It is due to report Dec '20 quarterly results on 2/22/21. Volume and volatility often increase near earnings news. Its Sep '20 quarterly earnings rose +14% on +19% sales revenues versus the year ago period, below the +25% minimum guideline (C criteria), raising fundamental concerns. That broke a streak of 4 consecutive quarterly comparisons above the +25% minimum earnings guideline (C criteria). Annual earnings (A criteria) growth has been strong.
TREX last appeared in this FSU section on 1/19/21 with an annotated graph under the headline, "Hit New All-Time High With Gain Backed by Average Volume". The company hails from the General Building Materials industry group which currently has a Group Relative Strength Rating of (54) C+.
The company has a new CEO as of 4/29/20. After a 2:1 share split effective 9/15/20 it now has a supply (S criteria) of 115.8 million shares outstanding. The number of top-rated funds owning its shares rose from 540 in Jun '19 to 733 in Dec '20, a reassuring sign concerning the I criteria. Its current Up/Down Volume Ratio of 2.0 is an unbiased indication its shares have been under accumulation over the past 50 days. It has a Timeliness rating of B and a Sponsorship Rating of B.
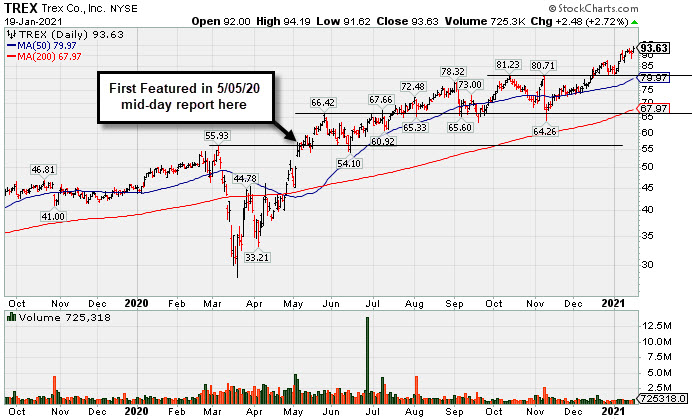
Hit New All-Time High With Gain Backed by Average Volume - Tuesday, January 19, 2021
Trex Company Inc (TREX +$2.48 or +2.72% to $93.63) posted another gain today with average volume for a new all-time high. Prior highs in the $80-81 area define initial support to watch above its 50-day moving average (DMA) line ($80).
Recently it reported Sep '20 quarterly earnings +14% on +19% sales revenues versus the year ago period, below the +25% minimum guideline (C criteria) raising fundamental concerns while breaking a streak of 4 consecutive quarterly comparisons above the +25% minimum earnings guideline (C criteria).
TREX last appeared in this FSU section on 12/22/20 with an annotated graph under the headline, "Hit New High With Light Volume Behind 4th Consecutive Gain". It has a 95 Earnings Per Share Rating. Annual earnings (A criteria) growth has been strong. The company hails from the General Building Materials industry group which currently has a Group Relative Strength Rating of (61) B.
The company has a new CEO as of 4/29/20. After a 2:1 share split effective 9/15/20 it now has a supply (S criteria) of 115.8 million shares outstanding. The number of top-rated funds owning its shares rose from 540 in Jun '19 to 768 in Sep '20, a reassuring sign concerning the I criteria. Its current Up/Down Volume Ratio of 1.4 is an unbiased indication its shares have been under accumulation over the past 50 days. It has a Timeliness rating of B and a Sponsorship Rating of B.
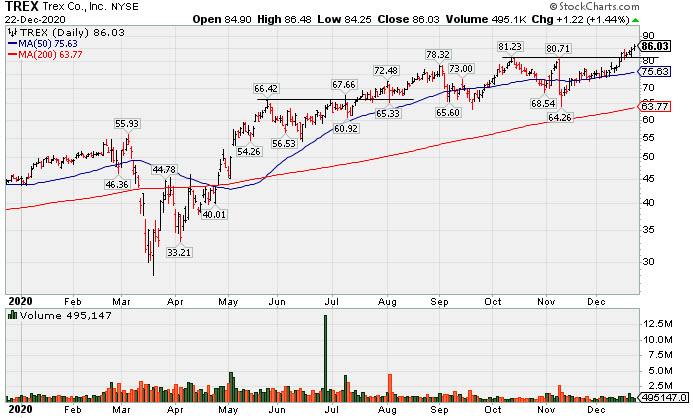
Hit New High With Light Volume Behind 4th Consecutive Gain - Tuesday, December 22, 2020
Trex Company Inc (TREX +$1.22 or +1.44% to $86.03) hit yet another new 52-week high with today's 4th consecutive gain. Its 50-day moving average (DMA) line ($75.63) defines near-term support to watch. Volume-driven gains helped its technical stance and outlook improve.
Recently it reported Sep '20 quarterly earnings +14% on +19% sales revenues versus the year ago period, below the +25% minimum guideline (C criteria) raising fundamental concerns while breaking a streak of 4 consecutive quarterly comparisons above the +25% minimum earnings guideline (C criteria).
TREX last appeared in this FSU section on 12/01/20 with an annotated graph under the headline, "Consolidating Back Above 50-Day Moving Average Line". It has a 95 Earnings Per Share Rating. Annual earnings (A criteria) growth has been strong. The company hails from the General Building Materials industry group which currently has a Group Relative Strength Rating of (70) B+.
The company has a new CEO as of 4/29/20. After a 2:1 share split effective 9/15/20 it now has a supply (S criteria) of 115.8 million shares outstanding. The number of top-rated funds owning its shares rose from 540 in Jun '19 to 770 in Sep '20, a reassuring sign concerning the I criteria. Its current Up/Down Volume Ratio of 1.1 is an unbiased indication its shares have been under slight accumulation over the past 50 days. It has a Timeliness rating of B and a Sponsorship Rating of B.
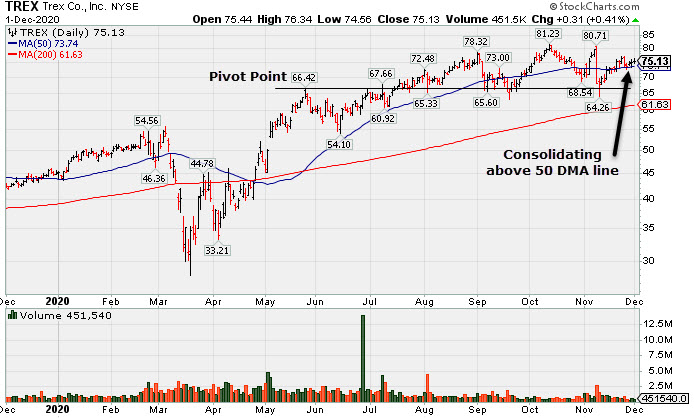
Consolidating Back Above 50-Day Moving Average Line - Tuesday, December 1, 2020
Trex Company Inc (TREX +0.31 or +0.41% to $75.13) is consolidating above its 50-day moving average (DMA) line ($73.74). Volume-driven gains helped its technical stance and outlook improve. Recently it reported Sep '20 quarterly earnings +14% on +19% sales revenues versus the year ago period, below the +25% minimum guideline (C criteria) raising fundamental concerns while breaking a streak of 4 consecutive quarterly comparisons above the +25% minimum earnings guideline (C criteria).
TREX last appeared in this FSU section on 11/04/20 with an annotated graph under the headline, "Rebound Above 50-Day Moving Average Helped Technical Stance". It has a 95 Earnings Per Share Rating. Annual earnings (A criteria) growth has been strong. The company hails from the General Building Materials industry group which currently has a Group Relative Strength Rating of (68) B.
The company has a new CEO as of 4/29/20. After a 2:1 share split effective 9/15/20 it now has a supply (S criteria) of 115.8 million shares outstanding. The number of top-rated funds owning its shares rose from 540 in Jun '19 to 766 in Sep '20, a reassuring sign concerning the I criteria. Its current Up/Down Volume Ratio of 0.8 is an unbiased indication its shares have been under distributional pressure over the past 50 days. It has a Timeliness rating of B and a Sponsorship Rating of C.
Rebound Above 50-Day Moving Average Helped Technical Stance - Wednesday, November 4, 2020
Trex Company Inc (TREX +$4.42 or +6.23% to $75.32) rebounded above its 50-day moving average (DMA) line ($72.83) today with a big volume-driven gain helping its technical stance and outlook improve. The prior low ($63.32 on 9/21/20) defines the next near-term support. Recently it reported Sep '20 quarterly earnings +14% on +19% sales revenues versus the year ago period, below the +25% minimum guideline (C criteria) raising fundamental concerns while breaking a streak of 4 consecutive quarterly comparisons above the +25% minimum earnings guideline (C criteria).
TREX last appeared in this FSU section on 10/16/20 with an annotated graph under the headline, "Recently Wedged Into New High Territory". It has a 96 Earnings Per Share Rating. Annual earnings (A criteria) growth has been strong. The company hails from the General Building Materials industry group which currently has a Group Relative Strength Rating of (84) A.
The company has a new CEO as of 4/29/20. After a 2:1 share split effective 9/15/20 it now has a supply (S criteria) of 115.8 million shares outstanding. The number of top-rated funds owning its shares rose from 540 in Jun '19 to 771 in Sep '20, a reassuring sign concerning the I criteria. Its current Up/Down Volume Ratio of 0.7 is an unbiased indication its shares have been under distributional pressure over the past 50 days. It has a Timeliness rating of B and a Sponsorship Rating of C.
Recently Wedged Into New High Territory - Friday, October 16, 2020
Trex Company Inc (TREX -$1.13 or -1.44% to $77.20) pulled back for a 3rd consecutive loss with below average volume, retreating after quietly reaching a new all-time high this week. It did not form a sound base pattern and recently rose to new highs with gains lacking great volume conviction. Any subsequent losses below the 50-day moving average (DMA) line ($72.41) or recent low ($63.32 on 9/21/20) would raise concerns and trigger technical sell signals. Do not be confused by the 2:1 share split effective 9/15/20 (Featured Price, Pivot Point, and Max Buy prices have been adjusted accordingly). Fundamentals remain strong.
Fundamentals remain strong. Recently it reported Jun '20 quarterly earnings +27% on +7% sales revenues versus the year ago period, its 4th consecutive quarterly comparison above the +25% minimum earnings guideline (C criteria). It wedged into new high territory with gains lacking volume conviction since last appearing in this FSU section on 9/30/20 with an annotated graph under the headline, "TREX Rebounded Above 50-Day Moving Average". It has earned the highest possible 99 Earnings Per Share Rating. Annual earnings (A criteria) growth has been strong. The company hails from the General Building Materials industry group which currently has a Group Relative Strength Rating of A+
The company has a new CEO as of 4/29/20. After a 2:1 share split effective 9/15/20 it now has a supply (S criteria) of 115.8 million shares outstanding. The number of top-rated funds owning its shares rose from 540 in Jun '19 to 745 in Jun '20, a reassuring sign concerning the I criteria. Its current Up/Down Volume Ratio of 1.1 is an unbiased indication its shares have been under slight accumulation over the past 50 days. It has a Timeliness rating of A and a Sponsorship Rating of C.
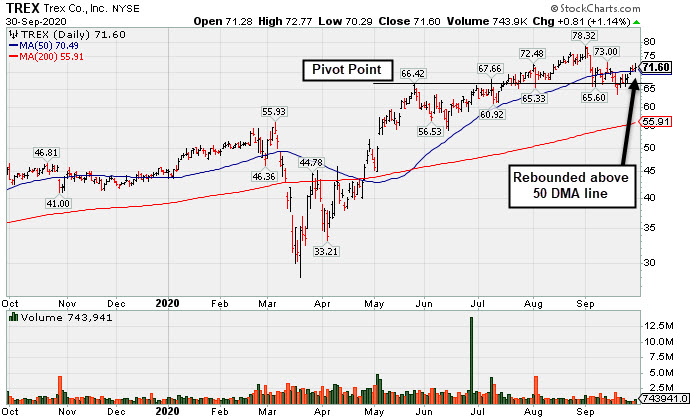
TREX Rebounded Above 50-Day Moving Average - Wednesday, September 30, 2020
Trex Company Inc (TREX +$0.81 or +1.14% to $71.60) has quietly rebounded above its 50-day moving average (DMA) line ($70.49) helping its outlook to improve, but lighter than average volume was behind today's gain. More damaging losses below the recent low ($63.32 on 9/21/20) would raise serious concerns. Do not be confused by the 2:1 share split effective 9/15/20 (Featured Price, Pivot Point, and Max Buy prices have been adjusted accordingly).
Fundamentals remain strong. Recently it reported Jun '20 quarterly earnings +27% on +7% sales revenues versus the year ago period, its 4th consecutive quarterly comparison above the +25% minimum earnings guideline (C criteria). It has shown resilience since last appearing in this FSU section on 9/17/20 with an annotated graph under the headline, "Slumped Below 50-Day Average With Loss on Light Volume". It has earned the highest possible 99 Earnings Per Share Rating. Annual earnings (A criteria) growth has been strong. The company hails from the General Building Materials industry group which currently has a Group Relative Strength Rating of A+
The company has a new CEO as of 4/29/20. After a 2:1 share split effective 9/15/20 it now has a supply (S criteria) of 115.8 million shares outstanding. The number of top-rated funds owning its shares rose from 540 in Jun '19 to 735 in Jun '20, a reassuring sign concerning the I criteria. Its current Up/Down Volume Ratio of 0.8 is an unbiased indication its shares have been under some distributional pressure over the past 50 days. It has a Timeliness rating of A and a Sponsorship Rating of C.
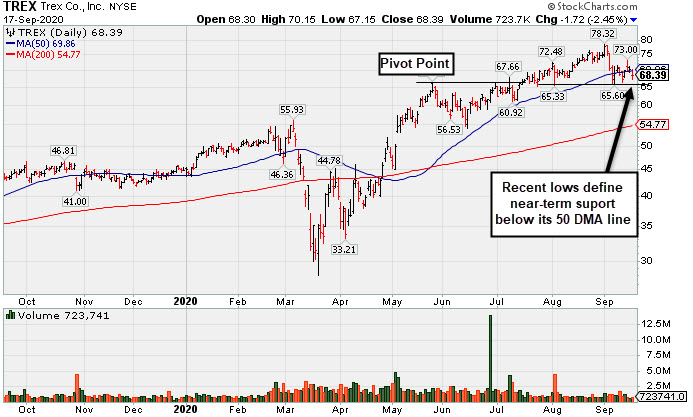
Slumped Below 50-Day Average With Loss on Light Volume - Thursday, September 17, 2020
Trex Company Inc (TREX -$1.72 or -2.45% to $68.39) slumped to close below its 50-day moving average (DMA) line ($69.86) with today's loss on light volume. The recent lows in the $65 area define the next important support level to watch. Only a prompt rebound above the 50 DMA line might help its outlook improve. Do not be confused by the 2:1 share split effective 9/15/20 (Featured Price, Pivot Point, and Max Buy prices have been adjusted accordingly).
Fundamentals remain strong. Recently it reported Jun '20 quarterly earnings +27% on +7% sales revenues versus the year ago period, its 4th consecutive quarterly comparison above the +25% minimum earnings guideline (C criteria). It has shown resilience since last appearing in this FSU section on 9/04/20 with an annotated graph under the headline, "Fall Below "Max Buy" Level Also Undercut 50-Day Moving Average". It has earned the highest possible 99 Earnings Per Share Rating. Annual earnings (A criteria) growth has been strong. The company hails from the General Building Materials industry group which currently has a Group Relative Strength Rating of A+
The company has a new CEO as of 4/29/20. After a 2:1 share split effective 9/15/20 it now has a supply (S criteria) of 115.8 million shares outstanding. The number of top-rated funds owning its shares rose from 540 in Jun '19 to 719 in Jun '20, a reassuring sign concerning the I criteria. Its current Up/Down Volume Ratio of 1.2 is an unbiased indication its shares have been under accumulation over the past 50 days. It has a Timeliness rating of A and a Sponsorship Rating of C.
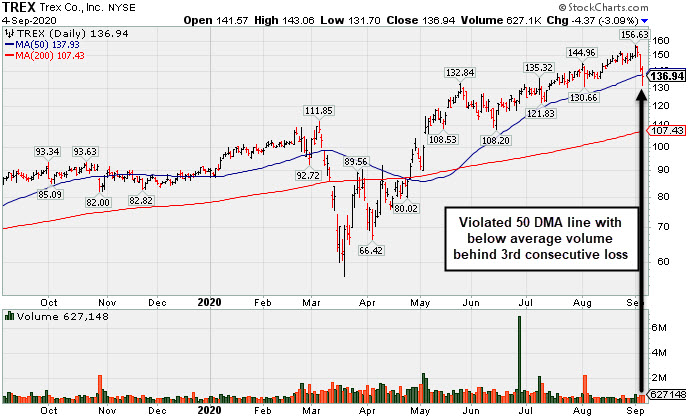
Fall Below "Max Buy" Level Also Undercut 50-Day Moving Average - Friday, September 4, 2020
Trex Company Inc's (TREX -$4.37 or -3.09% to $136.94) abruptly retreated from its all-time high with today's 3rd consecutive loss backed by below average volume. Its color code is changed to yellow after retreating below its "max buy" level, however concerns were raised as it has violated important near-term support at its 50 DMA line ($137.93). Only a prompt rebound above the 50 DMA line might help its outlook improve.
Recently it reported Jun '20 quarterly earnings +27% on +7% sales revenues versus the year ago period, its 4th consecutive quarterly comparison above the +25% minimum earnings guideline (C criteria). It was last shown in this FSU section on 8/19/20 with an annotated graph under the headline, "Wedging Into New High Territory After Latest Earnings Report". It has earned the highest possible 99 Earnings Per Share Rating. Annual earnings (A criteria) growth has been strong. The company hails from the General Building Materials industry group which currently has a Group Relative Strength Rating of A-
The company has a new CEO as of 4/29/20. It has a small supply (S criteria) of only 57.9 million shares outstanding. The number of top-rated funds owning its shares rose from 540 in Jun '19 to 715 in Jun '20, a reassuring sign concerning the I criteria. Its current Up/Down Volume Ratio of 1.8 is an unbiased indication its shares have been under accumulation over the past 50 days. It has a Timeliness rating of A and a Sponsorship Rating of C.
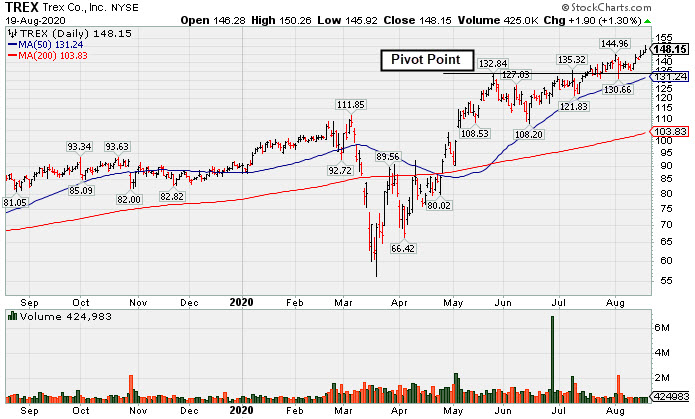
Wedging Into New High Territory After Latest Earnings Report - Wednesday, August 19, 2020
Trex Company Inc's (TREX +$1.90 or +1.30% to $148.15) hit another new all-time high with today's 3rd consecutive gain backed by light volume. It has been wedging above its "max buy" level with volume totals cooling. Important near-term support is at its 50-day moving average (DMA) line ($131.25).
Recently it reported Jun '20 quarterly earnings +27% on +7% sales revenues versus the year ago period, its 4th consecutive quarterly comparison above the +25% minimum earnings guideline (C criteria). It was last shown in this FSU section on 7/30/20 with an annotated graph under the headline, "Perched Near All Time High With Earnings News Due Monday". It has earned the highest possible 99 Earnings Per Share Rating. Annual earnings (A criteria) growth has been strong. The company hails from the General Building Materials industry group which currently has a Group Relative Strength Rating of A-
The company has a new CEO as of 4/29/20. It has a small supply (S criteria) of only 57.9 million shares outstanding. The number of top-rated funds owning its shares rose from 540 in Jun '19 to 717 in Jun '20, a reassuring sign concerning the I criteria. Its current Up/Down Volume Ratio of 1.5 is an unbiased indication its shares have been under accumulation over the past 50 days. It has a Timeliness rating of A and a Sponsorship Rating of C.
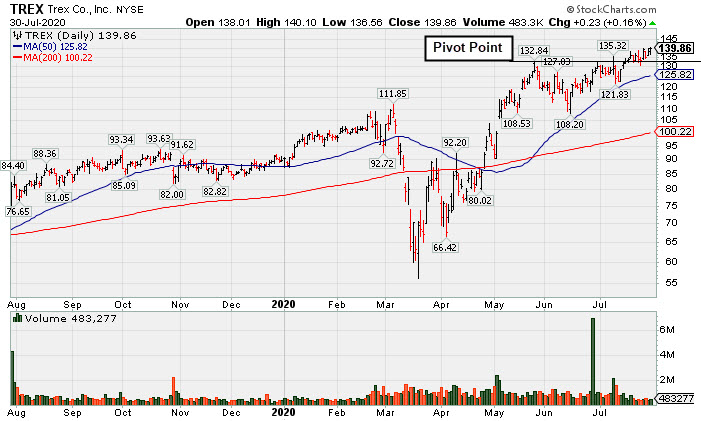
Perched Near All Time High With Earnings News Due Monday - Thursday, July 30, 2020
Trex Company Inc's (TREX +$0.23 or +0.16% to $139.86) color code was changed to green after rising above its "max buy" level. Keep in mind it is due to report Jun '20 quarterly results after the close on Monday, 8/03/20. Volume and volatility often increase near earnings news. Important near-term support is at its 50 DMA line ($125.82).
Fundamentals remain strong. It has earned the highest possible 99 Earnings Per Share Rating. TREX reported earnings +35% on +12% sales revenues for the Mar '20 quarter versus the year ago period, its 3rd consecutive quarterly comparison above the +25% minimum earnings guideline (C criteria). Annual earnings (A criteria) growth has been strong. The company hails from the General Building Materials industry group which currently has a Group Relative Strength Rating of B+.
The company has a new CEO as of 4/29/20. It has a small supply (S criteria) of only 57.9 million shares outstanding. The number of top-rated funds owning its shares rose from 540 in Jun '19 to 685 in Jun '20, a reassuring sign concerning the I criteria. Its current Up/Down Volume Ratio of 1.5 is an unbiased indication its shares have been under accumulation over the past 50 days. It has a Timeliness rating of A and a Sponsorship Rating of C.
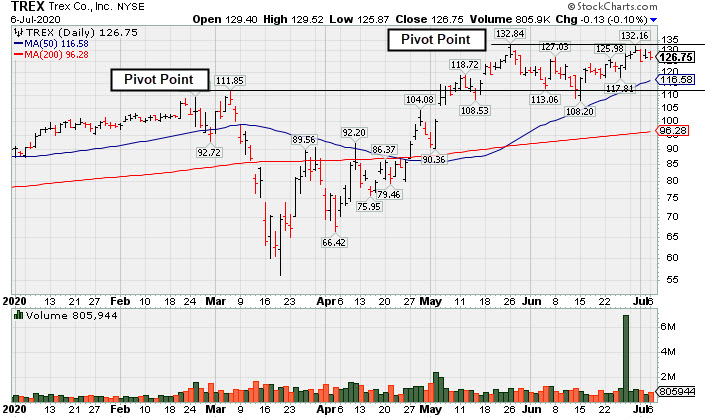
Quietly Perched Near All-Time High After Forming a New Base - Monday, July 6, 2020
Trex Company Inc (TREX -$0.13 or -0.10% to $126.75) ended slightly lower today with a small loss on light volume. It has been challenging its all-time high. Subsequent volume-driven gains for new highs may trigger a new (or add-on) technical buy signal. Important near-term support is at its 50-day moving average (DMA) line ($116.58).
Fundamentals remain strong. It has earned the highest possible 99 Earnings Per Share Rating. TREX reported earnings +35% on +12% sales revenues for the Mar '20 quarter versus the year ago period, its 3rd consecutive quarterly comparison above the +25% minimum earnings guideline (C criteria). Annual earnings (A criteria) growth has been strong. The company hails from the General Building Materials industry group which currently has a Group Relative Strength Rating of B+.
The company has a new CEO as of 4/29/20. It has a small supply (S criteria) of only 57.9 million shares outstanding. The number of top-rated funds owning its shares rose from 540 in Jun '19 to 668 in Jun '20, a reassuring sign concerning the I criteria. Its current Up/Down Volume Ratio of 1.9 is an unbiased indication its shares have been under accumulation over the past 50 days. It has a Timeliness rating of A and a Sponsorship Rating of C.
Pullback Toward Prior Highs Which Define Near-Term Support - Thursday, June 11, 2020
Trex Company Inc (TREX -$8.62 or -7.04% to $113.83) pulled back below its "max buy" level with today's big loss with near average volume and its color code was changed to yellow. Prior highs in the $111 area define initial support to watch.
TREX was highlighted in yellow with pivot point cited based on its 3/05/20 high plus 10 cents in the 5/05/20 mid-day report (read here). It rebounded impressively after a deep slump below its 50-day and 200-day moving average (DMA) lines during the recent market correction. It was last shown in this FSU section on 5/20/20 with an annotated graph under the headline, "Bullish Action Continues for Top Wood Alternative Firm".
Fundamentals remain strong. It has earned the highest possible 99 Earnings Per Share Rating. TREX reported earnings +35% on +12% sales revenues for the Mar '20 quarter versus the year ago period, its 3rd consecutive quarterly comparison above the +25% minimum earnings guideline (C criteria). Annual earnings (A criteria) growth has been strong. The company hails from the General Building Materials industry group which currently has a Group Relative Strength Rating of B+.
The company has a new CEO as of 4/29/20. It has a small supply (S criteria) of only 57.9 million shares outstanding. The number of top-rated funds owning its shares rose from 540 in Jun '19 to 627 in Mar '20, a reassuring sign concerning the I criteria. Its current Up/Down Volume Ratio of 1.6 is an unbiased indication its shares have been under accumulation over the past 50 days. It has a Timeliness rating of A and a Sponsorship Rating of C.
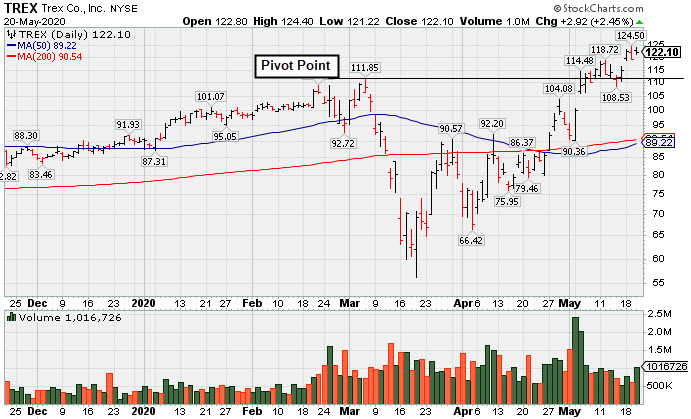
Bullish Action Continues for Top Wood Alternative Firm - Wednesday, May 20, 2020
Trex Company Inc (TREX +$2.92 or +2.45% to $122.10) posted a small gain today. It gapped up on 5/18/20 rising above the "max buy" level, hitting a new all-time high with volume below average. Recent gains above the pivot point lacked the great volume conviction indicative of institutional demand. Prior highs in the $111 area define initial support to watch on pullbacks
TREX was highlighted in yellow with pivot point cited based on its 3/05/20 high plus 10 cents in the 5/05/20 mid-day report (read here). It rebounded impressively after a deep slump below its 50-day and 200-day moving average (DMA) lines during the recent market correction. It was last shown in this FSU section on 5/05/20 with an annotated graph under the headline, "Gapped Up for Volume-Driven Gain and Hit a New All-Time High".
It has earned the highest possible 99 Earnings Per Share Rating. TREX reported earnings +35% on +12% sales revenues for the Mar '20 quarter versus the year ago period, its 3rd consecutive quarterly comparison above the +25% minimum earnings guideline (C criteria). Annual earnings (A criteria) growth has been strong. The company hails from the General Building Materials industry group which currently has a Group Relative Strength Rating of B-.
The company has a new CEO as of 4/29/20. It has a small supply (S criteria) of only 57.9 million shares outstanding. The number of top-rated funds owning its shares rose from 540 in Jun '19 to 617 in Mar '20, a reassuring sign concerning the I criteria. Its current Up/Down Volume Ratio of 1.5 is an unbiased indication its shares have been under accumulation over the past 50 days. It has a Timeliness rating of A and a Sponsorship Rating of C.
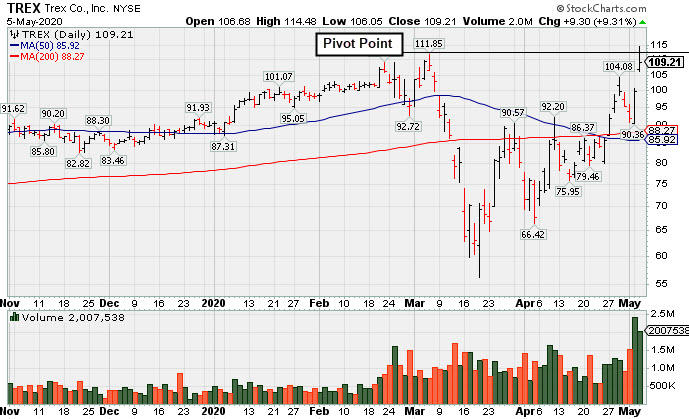
Gapped Up for Volume-Driven Gain and Hit a New All-Time High - Tuesday, May 5, 2020
Trex Company Inc (TREX +$9.30 or +9.31% to $109.21) was highlighted in yellow with pivot point cited based on its 3/05/20 high plus 10 cents in the earlier mid-day report (read here). It touched a new all-time high with today's gap up and 2nd consecutive volume-driven gain. Subsequent gains and strong close above the pivot point backed by at least +40% above average volume may trigger a technical buy signal. It rebounded impressively after a deep slump below its 50-day and 200-day moving average (DMA) lines during the recent market correction.
It has earned the highest possible 99 Earnings Per Share Rating. TREX reported earnings +35% on +12% sales revenues for the Mar '20 quarter versus the year ago period, its 3rd consecutive quarterly comparison above the +25% minimum earnings guideline (C criteria). Annual earnings (A criteria) growth has been strong. However, the company hails from the General Building Materials industry group which currently has a Group Relative Strength Rating of C+.
It has a small supply (S criteria) of only 58.2 million shares outstanding. The number of top-rated funds owning its shares rose from 540 in Jun '19 to 622 in Mar '20, a reassuring sign concerning the I criteria. Its current Up/Down Volume Ratio of 1.1 is an unbiased indication its shares have been under slight accumulation over the past 50 days. It has a Timeliness rating of B and a Sponsorship Rating of C.