Recently Perched Within Striking Distance of Prior Highs - Wednesday, March 30, 2022
Slumped Below 50-Day Moving Average Line Toward Prior Lows - Monday, March 14, 2022
Consolidating Near High Following Strong Earnings Report - Tuesday, February 15, 2022
Consolidating Above 50-Day Moving Average - Monday, January 31, 2022
Pulling Back Below "Max Buy" Level With Lighter Volume - Wednesday, November 10, 2021
Perched Near High With Strong Fundamentals - Thursday, October 7, 2021
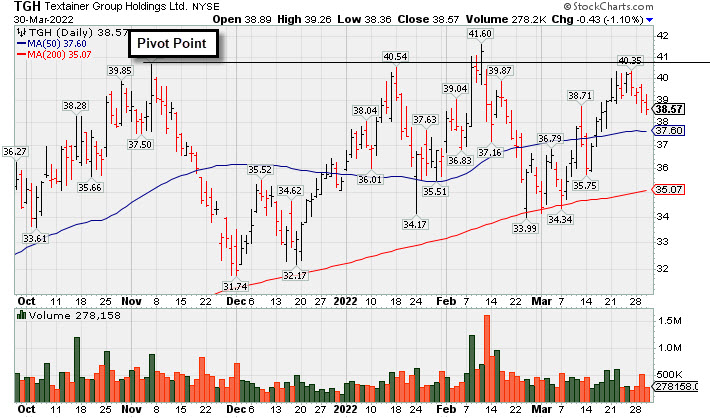
Recently Perched Within Striking Distance of Prior Highs - Wednesday, March 30, 2022
Textainer Group Holdings (TGH -$0.43 or -1.10% to $38.57) ended lower and volume was below average behind today's 4th consecutive small loss. Volume has been cooling while hovering within close striking distance of its all-time high. The color code was changed to yellow after rebounding above its 50 DMA line ($37.75) since it was last covered in greater detail on 3/14/22 with an annotated graph under the headline, "Slumped Below 50-Day Moving Average Line Toward Prior Lows". Important near-term support to watch is its 200 DMA line ($35.45) and prior lows. Any violations would raise serious concerns and trigger technical sell signals.
TGH was highlighted in yellow with pivot point cited based on its 11/05/21 high plus 10 cents in the 1/31/22 mid-day report (read here). Fundamentals remain strong. TGH has the highest possible Earnings Per Share Rating of 99. It reported Dec '21 quarterly earnings +80% on +23% sales revenues versus the year ago period, its 7th strong earnings comparison. Sales revenues growth has been improving and accelerating in recent quarterly comparisons, a strong match with regard to the fact-based investment system's fundamental guidelines. Annual earnings (A criteria) history has been strong after a downturn and loss in FY '16.
It hails from the Commercial Services - Leasing industry group which is currently ranked 96th on the 197 Industry Groups list (L criteria), down from 72nd a month a ago. There are 49.3 million shares outstanding (S criteria) which can contribute to greater price volatility in the event of institutional buying or selling. The number of top-rated funds owning its shares has risen from 294 in Dec '20 to 341 in Dec '21, a reassuring sign concerning the I criteria. However, its current Up/Down Volume Ratio of 0.8 is an unbiased indication its shares have been under distributional pressure over the past 50 days. It has a Timeliness rating of A and an Accumulation/Distribution rating of C.
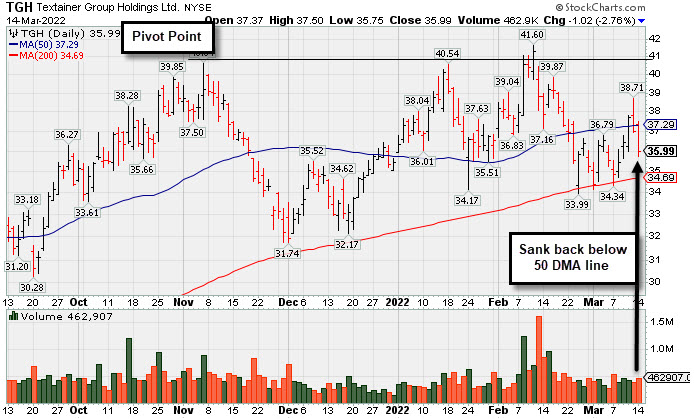
Slumped Below 50-Day Moving Average Line Toward Prior Lows - Monday, March 14, 2022
Textainer Group Holdings (TGH -$1.02 or -2.76% to $35.99) fell following a "negative reversal" on Friday and slumped further below its 50-day moving average (DMA) line ($37.29). It faces some resistance due to overhead supply up to the $41 level. Its 200 DMA line ($35) and prior lows define important near-term support to watch. Any violations would raise serious concerns and trigger technical sell signals.
Fundamentals remain strong. TGH has the highest possible Earnings Per Share Rating of 99. It reported Dec '21 quarterly earnings +80% on +23% sales revenues versus the year ago period, its 7th strong earnings comparison. Sales revenues growth has been improving and accelerating in recent quarterly comparisons, a strong match with regard to the fact-based investment system's fundamental guidelines. Annual earnings (A criteria) history has been strong after a downturn and loss in FY '16.
It hails from the Commercial Services - Leasing industry group which is currently ranked 72nd on the 197 Industry Groups list (L criteria). There are 49.3 million shares outstanding (S criteria) which can contribute to greater price volatility in the event of institutional buying or selling. The number of top-rated funds owning its shares has risen from 294 in Dec '20 to 341 in Dec '21, a reassuring sign concerning the I criteria. It has a Timeliness rating of B and an Accumulation/Distribution rating of C.
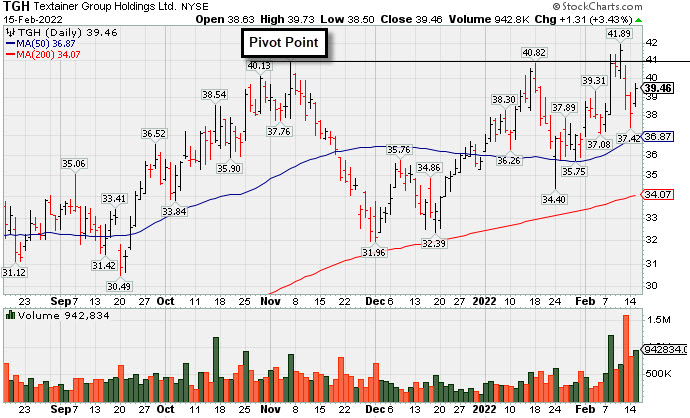
Consolidating Near High Following Strong Earnings Report - Tuesday, February 15, 2022
Textainer Group Holdings (TGH +$1.31 and +3.43% to $39.46) posted a solid volume-driven gain today. It recently found support at its 50-day moving average (DMA) line ($36.87) while consolidating. TGH was highlighted in yellow with pivot point cited based on its 11/05/21 high plus 10 cents in the 1/31/22 mid-day report (read here) and covered in greater detail that evening with an annotated graph under the headline, "Consolidating Above 50-Day Moving Average".
Fundamentals remain strong. TGH has the highest possible Earnings Per Share Rating of 99. It reported Dec '21 quarterly earnings +80% on +23% sales revenues versus the year ago period, its 7th strong earnings comparison. Sales revenues growth has been improving and accelerating in recent quarterly comparisons, a strong match with regard to the fact-based investment system's fundamental guidelines. Annual earnings (A criteria) history has been strong after a downturn and loss in FY '16.
It hails from the Commercial Services - Leasing industry group which is currently ranked 53rd on the 197 Industry Groups list (L criteria). There are 49.3 million shares outstanding (S criteria) which can contribute to greater price volatility in the event of institutional buying or selling. The number of top-rated funds owning its shares has risen from 294 in Dec '20 to 339 in Dec '21, a reassuring sign concerning the I criteria. It has a Timeliness rating of A and an Accumulation/Distribution rating of D.
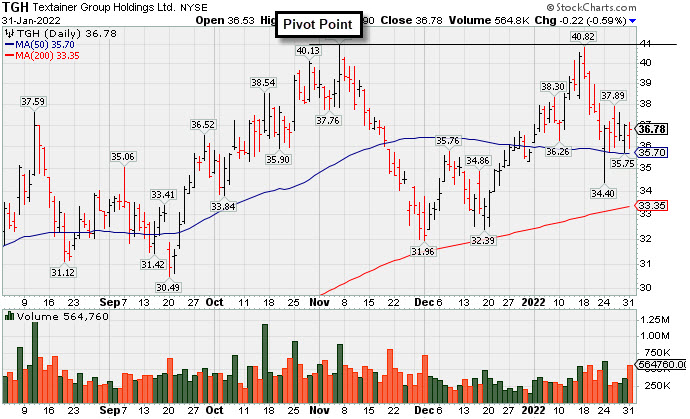
Consolidating Above 50-Day Moving Average - Monday, January 31, 2022
Textainer Group Holdings (TGH -$0.22 or -0.59% to $36.78) was highlighted in yellow with pivot point cited based on its 11/05/21 high plus 10 cents in the earlier mid-day report (read here). It churned higher volume but ended the day lower, a sign of distributional pressure. It is consolidating above its 50-day moving average (DMA) line ($35.75) after recently challenging its 52-week high. Some resistance remains due to overhead supply. Subsequent gains above the pivot point backed by at least +40% above average volume are needed to trigger a technical buy signal.
TGH was last shown in greater detail on November 10th with an annotated graph, "Perched Near High With Strong Fundamentals". It found support at its 200 DMA line during its consolidation after dropped from the Featured Stocks list on 11/26/21.
Fundamentals remain strong. TGH has the highest possible Earnings Per Share Rating of 99. It recently reported Sep '21 quarterly earnings +271% on +31% sales revenues versus the year ago period, its 6th strong earnings comparison. Sales revenues growth has been improving and accelerating in the 4 latest quarterly comparisons, a strong match with regard to the fact-based investment system's fundamental guidelines. Annual earnings (A criteria) history has been strong after a downturn and loss in FY '16.
It hails from the Commercial Services - Leasing industry group which is currently ranked 68th on the 197 Industry Groups list (L criteria). There are 49.3 million shares outstanding (S criteria) which can contribute to greater price volatility in the event of institutional buying or selling. The number of top-rated funds owning its shares has risen from 294 in Dec '20 to 338 in Dec '21, a reassuring sign concerning the I criteria. It has a Timeliness rating of A and an Accumulation/Distribution rating of D.
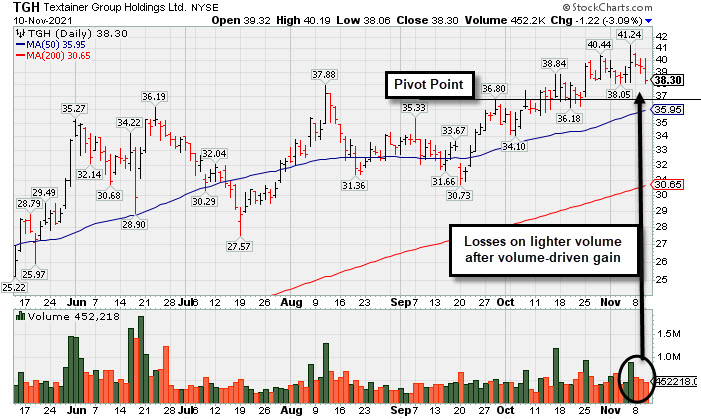
Pulling Back Below "Max Buy" Level With Lighter Volume - Wednesday, November 10, 2021
Textainer Group Holdings (TGH -$1.22 or -3.09% to $38.30) pulled back below its "max buy" level with today's 3rd consecutive loss on lighter (near average) volume and its color code was changed to yellow. Its 50-day moving average (DMA) line ($35.95) and prior highs define important near-term support to watch.
TGH has the highest possible Earnings Per Share Rating of 99. It recently reported Sep '21 quarterly earnings +271% on +31% sales revenues versus the year ago period, its 6th strong earnings comparison. Sales revenues growth has been improving and accelerating in the 4 latest quarterly comparisons, a strong match with regard to the fact-based investment system's fundamental guidelines. Annual earnings (A criteria) history has been strong after a downturn and loss in FY '16.
TGH was highlighted in yellow in the 10/07/21 mid-day report (read here) with pivot point cited based on its 9/29/21 high while building on a cup-with-handle base. It was shown in greater detail that evening with an annotated graph, "Perched Near High With Strong Fundamentals".
It hails from the Commercial Services - Leasing industry group which is currently ranked 28th on the 197 Industry Groups list (L criteria). There are 49.6 million shares outstanding (S criteria) which can contribute to greater price volatility in the event of institutional buying or selling. The number of top-rated funds owning its shares has risen from 294 in Dec '20 to 326 in Sep '21, a reassuring sign concerning the I criteria. It has a Timeliness rating of A and an Accumulation/Distribution rating of C.
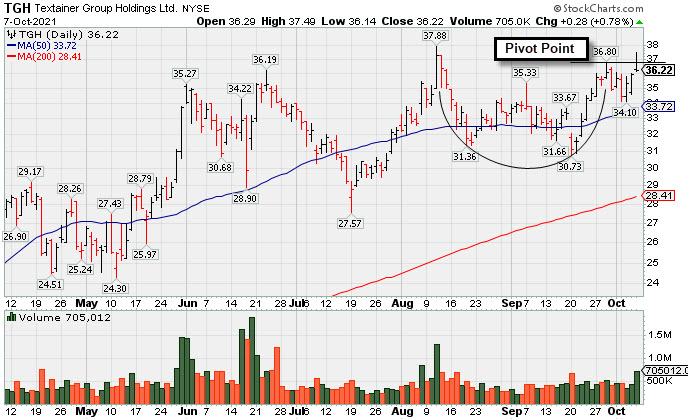
Perched Near High With Strong Fundamentals - Thursday, October 7, 2021
Textainer Group Holdings (TGH +$0.28 or +0.78% to $36.22) finished near the session low after churning higher volume today. It was highlighted in yellow in the earlier mid-day report (read here) with pivot point cited based on its 9/29/21 high while building on a cup-with-handle base. It is perched within close striking distance of its 52-week high after finding prompt support near its 50-day moving average (DMA) line ($33.73) during an orderly consolidation. Subsequent gains above the pivot point backed by at least +40% above average volume may trigger a proper technical buy signal.
It hails from the Commercial Services - Leasing industry group which is currently ranked 35th on the 197 Industry Groups list (L criteria). It has the highest possible Earnings Per Share Rating of 99. It recently reported Jun '21 quarterly earnings +429% on +29% sales revenues versus the year ago period, its 5th strong earnings comparison. Sales revenues growth has been improving and accelerating in the 3 latest quarterly comparisons after years of sub-par and negative comparisons, not a match with with regard to the fact-based investment system's fundamental guidelines. Annual earnings (A criteria) history has been strong after a downturn and loss in FY '16.
There are 49.6 million shares outstanding (S criteria) which can contribute to greater price volatility in the event of institutional buying or selling. The number of top-rated funds owning its shares has risen from 294 in Dec '20 to 329 in Sep '21, a reassuring sign concerning the I criteria. It has a Timeliness rating of A and an Accumulation/Distribution rating of B-.