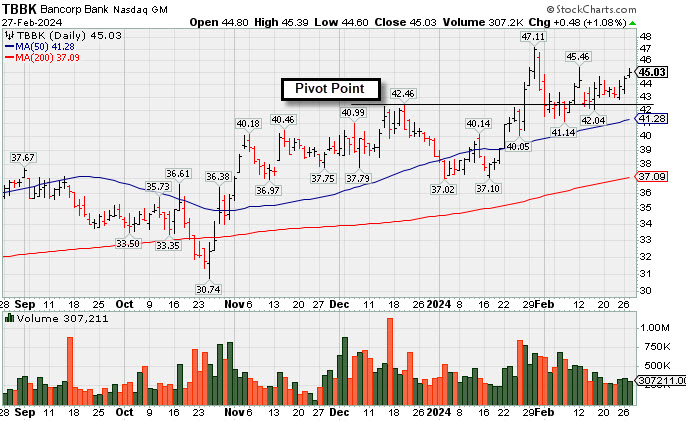
Wedging Above "Max Buy" Level With Gains Lacking Great Volume - Tuesday, February 27, 2024
The Bancorp (TBBK +$0.48 or +1.08% to $45.03) wedged above the "max buy" level with today's 3rd consecutive gain backed by below-average volume. Prior highs in the $42 area define support above its 50-day moving average (DMA) line.
TBBK was highlighted in yellow with pivot point cited based on its 7/27/23 high plus 10 cents in the 12/04/23 mid-day report (read here). It last appeared in this FSU section on 1/26/24 with an annotated graph under the headline, "Volume-Driven Breakout Triggered Buy Signal After Earnings Report".
Quarterly earnings increases above the +25% guideline satisfy the C criteria. Its annual earnings (A criteria) history has been steadily improving. The number of top-rated funds owning its shares rose from 422 in Sep '12 to 466 in Dec '23, a reassuring sign concerning the I criteria. Its small supply (S criteria) of only 51 million shares in the public float can contribute to greater price volatility in the event of institutional buying or selling.
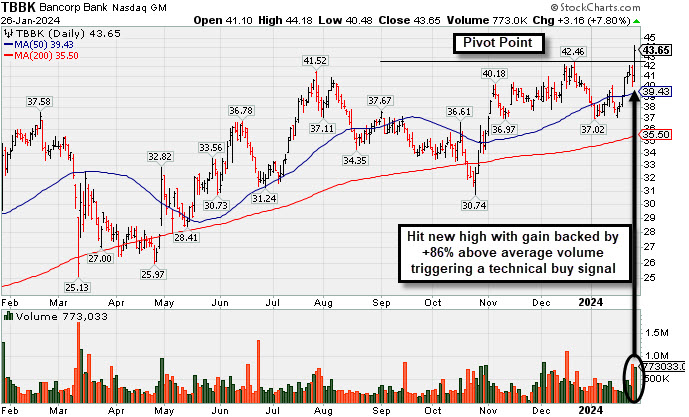
Volume-Driven Breakout Triggered Buy Signal After Earnings Report - Friday, January 26, 2024
The Bancorp (TBBK +$3.16 or +7.80% to $43.65) powered above its pivot point to a new all-time high with today's gain backed +86% above average volume. Bullish action came after it reported Dec '23 quarterly earnings +34% on +16% sales revenues versus the year-ago period. Volume and volatility often increase near earnings news. The gain and strong close above the pivot point triggered a proper technical buy signal.
TBBK was highlighted in yellow with pivot point cited based on its 7/27/23 high plus 10 cents in the 12/04/23 mid-day report (read here). It last appeared in this FSU section on 12/22/23 with an annotated graph under the headline, "Negative Reversals are Signs of Distributional Pressure".
Quarterly earnings increases above the +25% guideline satisfy the C criteria. Its annual earnings (A criteria) history has been steadily improving. The number of top-rated funds owning its shares rose from 422 in Sep '12 to 463 in Dec '23, a reassuring sign concerning the I criteria. Its small supply (S criteria) of only 51 million shares in the public float can contribute to greater price volatility in the event of institutional buying or selling.
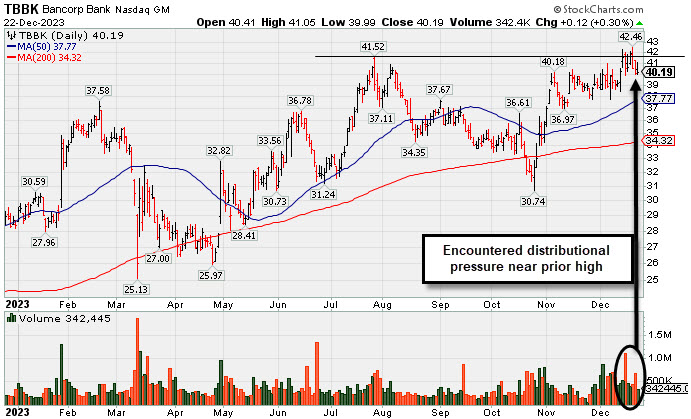
Negative Reversals are Signs of Distributional Pressure - Friday, December 22, 2023
The Bancorp (TBBK +$0.12 or +0.30% to $40.19) posted a small gain today with light volume after "negative reversals" on the 2 prior sessions while perched at its all-time high, sputtering back below its pivot point raising concerns. The recent action has been indicative of distributional pressure. Subsequent gains and a strong close above the pivot point backed by at least +40% above average volume may trigger a proper technical buy signal.
TBBK was highlighted in yellow with pivot point cited based on its 7/27/23 high plus 10 cents in the 12/04/23 mid-day report (read here). It last appeared in this FSU section on 12/05/23 with an annotated graph under the headline, "The Bancorp is Perched Near High with Strong Fundamentals".
Quarterly earnings increases above the +25% guideline satisfy the C criteria. Its annual earnings (A criteria) history has been steadily improving. The number of top-rated funds owning its share rose from 422 in Sep '12 to 454 in Sep '23, a reassuring sign concerning the I criteria. Its small supply (S criteria) of only 51 million shares in the public float can contribute to greater price volatility in the event of institutional buying or selling.
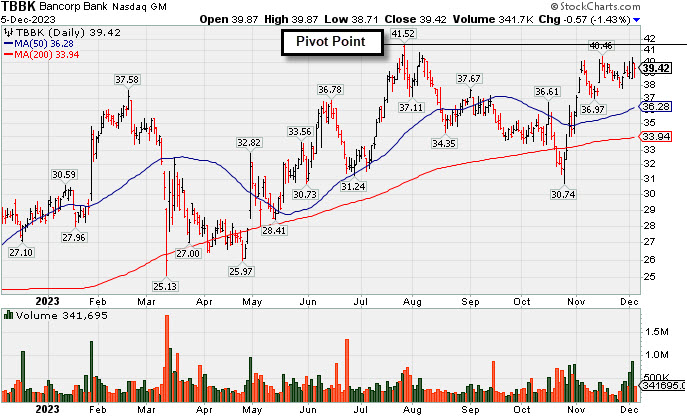
The Bancorp is Perched Near High with Strong Fundamentals - Tuesday, December 5, 2023
The Bancorp (TBBK -$0.57 or -1.43% to $39.42) was highlighted in yellow with pivot point cited based on its 7/27/23 high plus 10 cents in the 12/04/23 mid-day report (read here). It is perched within close striking distance of its all-time high. Subsequent gains above the pivot point backed by at least +40% above average volume may trigger a technical buiy signal.
Quarterly earnings increases above the +25% guideline satisfy the C criteria. Its annual earnings (A criteria) history has been steadily improving. The number of top-rated funds owning its share rose from 422 in Sep '12 to 454 in Sep '23, a reassuring sign concerning the I criteria. Its small supply (S criteria) of only 51 million shares in the public float can contribute to greater price volatility in the event of institutional buying or selling.
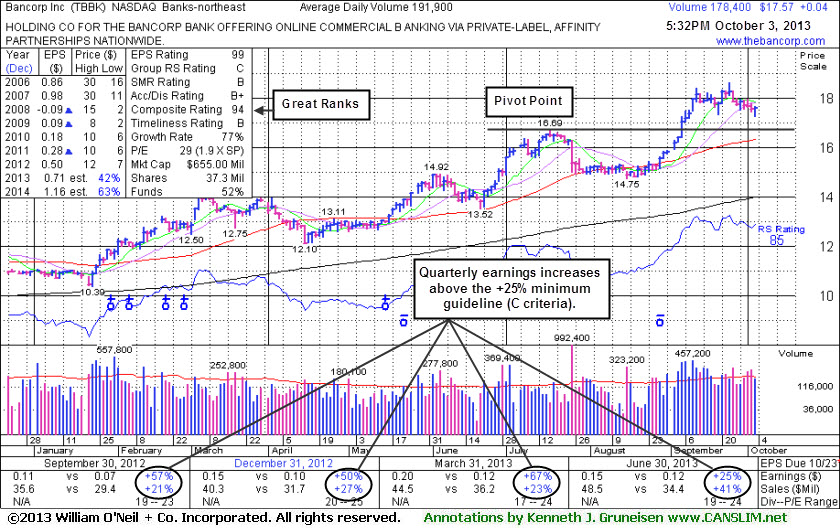
Encountering Distributional Pressure While Consolidating Above Prior Highs - Thursday, October 03, 2013
Bancorp Inc (TBBK +$0.04 or +0.23% to $17.57) encountered distributional pressure this week with losses on higher volume. Its color code has been changed to yellow after consolidating back below its "max buy" level. However, odds are less favorable for investors buying stocks on pullbacks rather when they are in the midst of a technical breakout. Recent pressure weighing on the broader market (M criteria) also could hurt its ability to make headway, since 3 out of 4 stocks typically move in the same direction as the major averages.
Prior highs and its 50-day moving average (DMA) line define important support to watch on pullbacks. It tallied multiple volume-driven gains for new highs immediately after last shown in this FSU section on 9/04/13 with an annotated graph under the headline, "Forming Sound Set-Up While 'M' Correction Remains Overriding Concern" as the broader market resumed its rally. It was highlighted in yellow with pivot point cited based on its 7/17/13 high plus 10 cents while building on an 8-week base in the earlier mid-day report (read here). The old resistance level now is expected to be a support area.
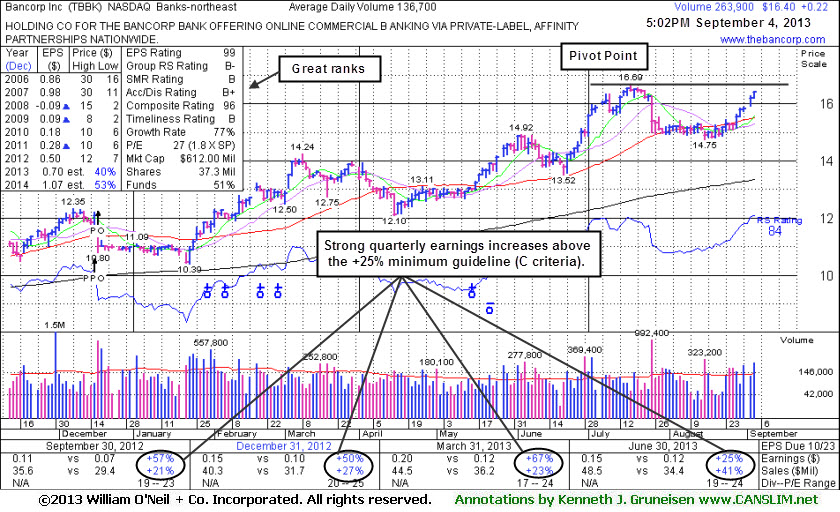
It reported +25% earnings for the Jun '13 quarter. Quarterly earnings increases above the +25% guideline satisfy the C criteria. Its annual earnings (A criteria) history has been steadily improving after an abrupt downturn and loss in FY '08. It completed a new Public Offering on 12/18/12. The number of top-rated funds owning its share rose from 169 in Sep '12 to 187 in Jun '13, a reassuring sign concerning the I criteria. Its small supply (S criteria) of only 32.9 million shares in the public float can contribute to greater price volatility in the event of institutional buying or selling.
Forming Sound Set-Up While "M" Correction Remains Overriding Concern - Wednesday, September 04, 2013
Bancorp Inc (TBBK +$0.22 or +1.36% to $16.40) has rebounded near its 52-week high with 5 consecutive gains after sputtering near its 50-day moving average (DMA) line in recent weeks. It was highlighted in yellow with pivot point cited based on its 7/17/13 high plus 10 cents while building on an 8-week base in the earlier mid-day report (read here). It reported +25% earnings for the Jun '13 quarter. Quarterly earnings increases above the +25% guideline satisfy the C criteria. Its annual earnings (A criteria) history has been steadily improving after an abrupt downturn and loss in FY '08. It completed a new Public Offering on 12/18/12.
The number of top-rated funds owning its share rose from 169 in Sep '12 to 181 in Jun '13, a reassuring sign concerning the I criteria. This makes an ideal stock for members' watch lists while waiting until a proper technical buy signal occurs, providing proof of fresh institutional buying demand. Keep in mind that the broader market (M criteria) weakness is an overriding concern that currently argues against new buying efforts in stocks until a new confirmed rally is noted. Its small supply (S criteria) of only 32.9 million shares in the public float can contribute to greater price volatility in the event of institutional buying or selling.