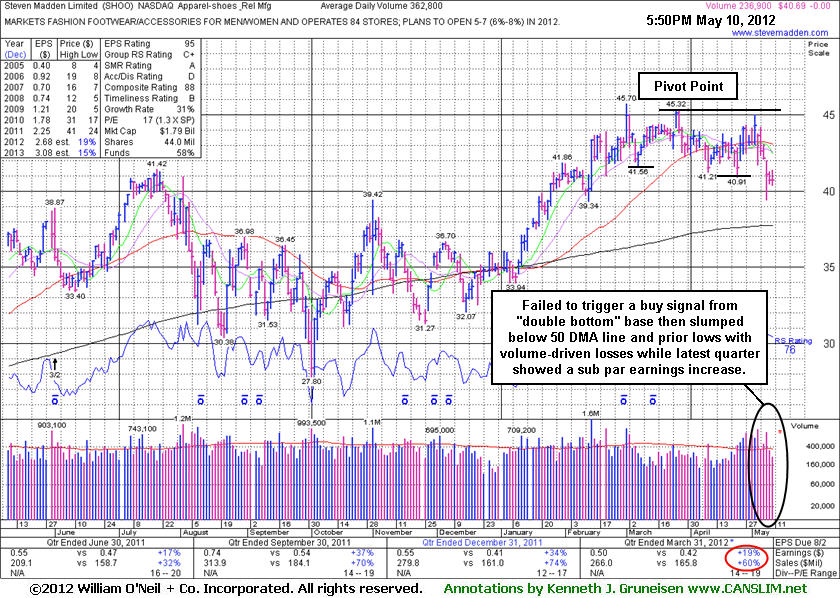
Fundamentals and Technicals Show Deterioration Not Strength - Thursday, May 10, 2012
Often, when a leading stock is setting up to breakout of a solid base it is highlighted in CANSLIM.net's Mid-Day Breakouts Report. The most relevant factors are noted in the report which alerts prudent CANSLIM oriented investors to place the issue in their watch list. After doing any necessary backup research, the investor is prepared to act after the stock triggers a technical buy signal (breaks above its pivot point on more than +50% average turnover) but before it gets too extended from a sound base. In the event the stock fails to trigger a technical buy signal and its price declines then it will simply be removed from the watch list. Disciplined investors know to buy as near as possible to the pivot point and avoid chasing stocks after they have rallied more than +5% above their pivot point. It is crucial to always limit losses whenever any stock heads the wrong direction, and disciplined investors sell if a struggling stock ever falls more than -7% from their purchase price.
Steve Madden Ltd (SHOO -$0.00 or -0.00% to $40.69) faced distributional pressure amid a recent market downdraft that was particularly hard on many Retail/Apparel related firms. It was featured in yellow in the mid-day report on 4/27/12 (read here) with pivot point cited based on its 3/26/12 high while working on a "double bottom" base pattern. Disciplined investors avoided harm by patiently waiting for proof of fresh institutional buying demand. Subsequent volume-driven gains above the pivot point never triggered a technical buy signal. Its color code was changed to green on 5/03/12 after earnings growth for the quarter ended March 31, 2012 versus the year ago period was below the +25% minimum guideline. Subsequent technical deterioration below the recent low ($40.91 on 4/24/12) with a streak of volume-driven losses raised more serious concerns.
Sales revenues had shown impressive acceleration in the Jun, Sep, and Dec '11 quarterly comparisons with earnings increases above the +25% minimum guideline. The high-ranked Apparel firm's annual earnings history (A criteria) since FY '07 has been good. Top-rated funds owning an interest increased from 354 in Jun '11 to 372 in Mar '12, which is good news concerning the I criteria. Regardless of any stock's mostly favorable characteristics, keep in mind that 3 out of 4 stocks follow the direction of the major averages (M criteria).
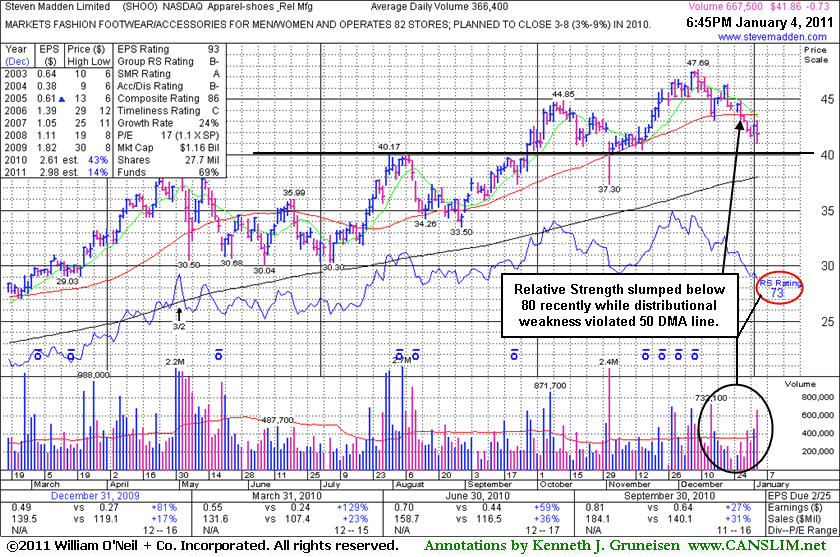
Technical Weakness Shows In Waning Relative Strength Rating - Tuesday, January 04, 2011
Steve Madden Ltd (SHOO -$0.73 or -1.71% to $41.86) was down with above average volume today, slumping further below its 50-day moving average (DMA) line and prior lows. It had found support near that short-term average after it negated its 12/07/10 breakout, but it has bee raising greater concerns as technical damage mounts. Prior highs near $40 define the nearest chart support. Since its last appearance in this FSU section on 11/23/10 under the headline "New High Close Not A Powerful Breakout" it had risen from a valid new base-on-base type pattern. However, its Relative Strength rating (73 see red circle) is a concern. At its recent best, it only traded up as much as +17.6% above its original pivot point shown the FSU section on 8/05/10 under the headline "Footwear Firm's Sales Growth Has Been Kicking." The high-ranked Apparel firm's quarterly earnings increases have been well above the +25% guideline, satisfying the C criteria. Its annual earnings history (A criteria) since FY '07 has been good. Top-rated funds owning an interest increased from 359 in Dec '09 to 403 in Sep '10, which is good news concerning the I criteria. (NOTE: Prior notes on this and other stocks cited top-rated US funds, and now our source is including foreign funds and hedge funds in their totals reported).
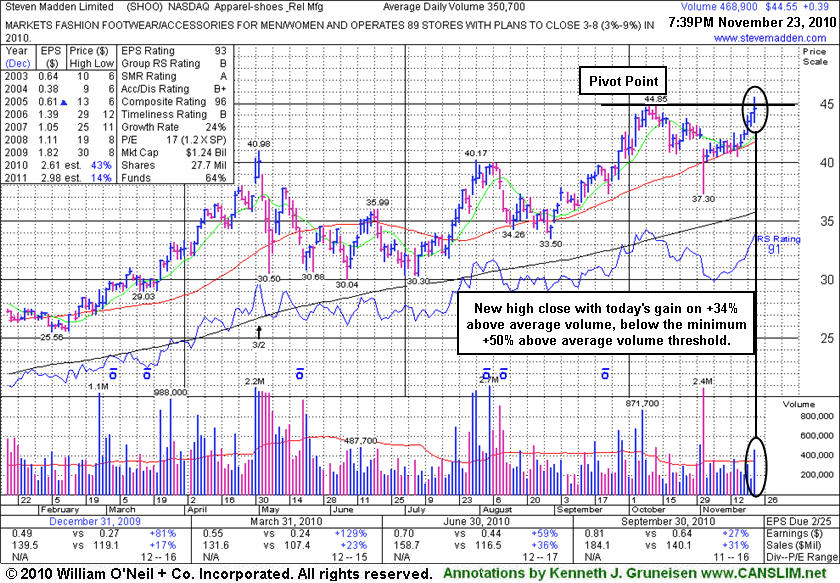
New High Close Not A Powerful Breakout - Tuesday, November 23, 2010
Steve Madden Ltd (SHOO +$0.45 or +1.02% to $44.61) faces no resistance due to overhead supply. There was +34% above average volume was behind today's 5th consecutive gain as it hit and closed at new 2010 highs. It may be considered a valid base-on-base type pattern, yet it was not a convincing breakout. Its color code is changed to yellow with new pivot point cited based on its 10/13/10 high plus ten cents. Disciplined investors will watch for a new confirmed rally with a follow-through day (FTD) gain of at least +1.8% from one or more of the major averages with higher volume and an expansion in leadership (new highs). A strong FTD would suggest that another sustainable advance may be at hand. Patience is called for before new buying efforts are justified.
SHOO recently found support above its 50-day moving average (DMA) line and prior chart highs in the $40 area. In its last FSU section appearance on 9/29/10 an annotated graph was included under the headline "Breakout Narrowly Met Volume Guideline When Clearing Adjusted Pivot" it had posted a 2nd consecutive gain with above average volume while hitting new 52-week highs. Its solid gain on 9/28/10 with +50% above average volume triggered a technical buy signal, not with very heavy volume, but volume just meeting the minimum volume threshold under the fact-based investment system guidelines. It had found prompt support after it gapped down on 11/02/10, rebounding to close above its 50-day moving average line. Earlier, that short term average was noted as a key support level during its deep consolidation after its appearance in the FSU section on 8/05/10 under the headline "Footwear Firm's Sales Growth Has Been Kicking."
The high-ranked Apparel firm's quarterly earnings increases have been well above the +25% guideline, satisfying the C criteria. Its annual earnings history (A criteria) since FY '07 has been good. Top-rated funds owning an interest increased from 359 in Dec '09 to 396 in Sep '10, which is good news concerning the I criteria. (NOTE: Prior notes on this and other stocks cited top-rated US funds, and now our source is including foreign funds and hedge funds in their totals reported).
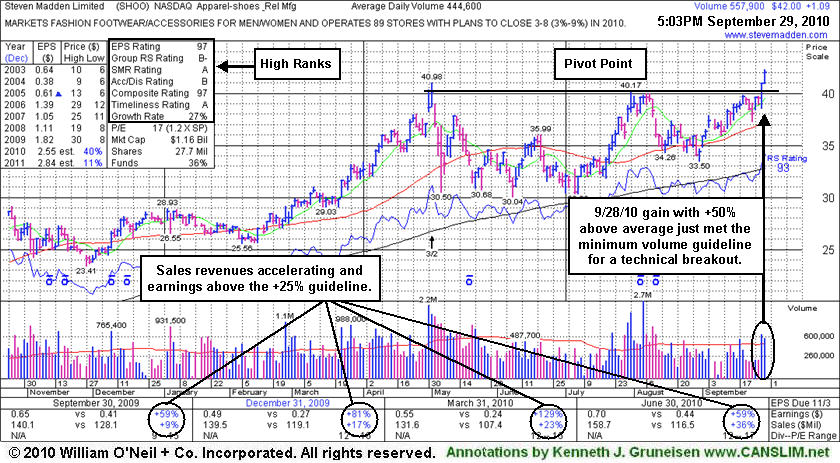
Breakout Narrowly Met Volume Guideline When Clearing Adjusted Pivot - Wednesday, September 29, 2010
Steve Madden Ltd (SHOO +$1.09 or +2.66% to $42.00) posted a 2nd consecutive gain today with above average volume while hitting new 52-week highs. Its solid gain on 9/28/10 with +50% above average volume triggered a technical buy signal, not with very heavy volume, but volume just meeting the minimum volume threshold under the fact-based investment system guidelines. It found support near its 50-day moving average line since its last appearance in the FSU section on 8/05/10 under the headline "Footwear Firm's Sales Growth Has Been Kicking."
From 8/13/10 to 9/03/10 its color code was green while it struggled but remained on the Featured Stocks list. Its color code was changed to yellow again after it showed resilience, and on 9/15/10 the new pivot point cited was adjusted down slightly to its 7/30/10 plus ten cents. Interestingly, had that minor adjustment not been made, it would not have cleared its "pivot point" until it tallied today's gain - which was backed by only +28% above average volume! Keep in mind that the objective of our ongoing analysis is to determine when a stock has built a sound base pattern and risen clear of resistance with great volume conviction behind meaningful price gains. Usually, greater volume conviction has been behind he market's biggest winners, and it was rather obvious at the beginning of a substantial leg up that the stocks were under institutional accumulation. Disciplined investors avoid chasing stocks more than +5% above their prior chart highs, and they always limit losses if a stock falls more than 7-8% from its purchase price.
Sales revenues have shown impressive sequential acceleration and it has shown strong earnings. The high-ranked Apparel firm's quarterly earnings increases have been well above the +25% guideline, satisfying the C criteria. Its annual earnings history (A criteria) since FY '07 has been good. The number of top-rated funds owning an interest in its shares rose from 85 in Sept '09 to 102 in June '10, which is a very reassuring sign with respect to the I criteria.
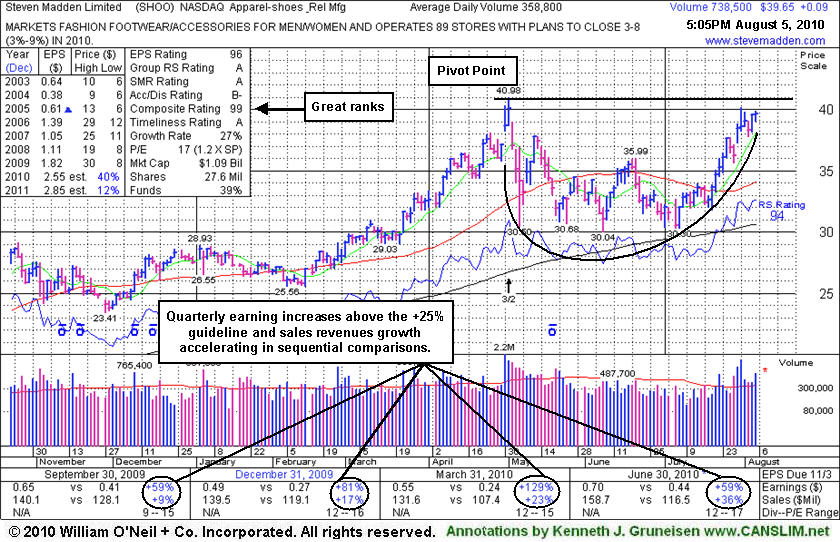
Footwear Firm's Sales Growth Has Been Kicking - Thursday, August 05, 2010
Steve Madden Ltd (SHOO +$0.05 or +0.13% to $39.61) ended today's session -3.3% of its 5/03/10 all-time high, now working on the right side of a 15-week cup shaped base without a handle. A proper "handle" forms over a minimum of 1 week and includes a pullback in the 10-12% range. This high-ranked Apparel - Shoes firm was featured in today's mid-day report (read here) and it was color coded yellow with the pivot point cited based on its 52-week high plus ten cents. Sales revenues have shown impressive sequential acceleration and it has shown strong earnings.
As noted in the 7/30/10 mid-day report - "It has the look of a big base-on-base type pattern now with prior resistance near $40. Recent quarters showed accelerating sales revenues and earnings increases since last noted in the 4/30/10 mid-day report. The high-ranked Apparel firm's quarterly earnings increases have been well above the +25% guideline, satisfying the C criteria. Its annual earnings history (A criteria) since FY '07 has been good."