Consolidating Above 50 DMA Line; Waning Relative Strength Raises Concerns - Tuesday, April 06, 2010
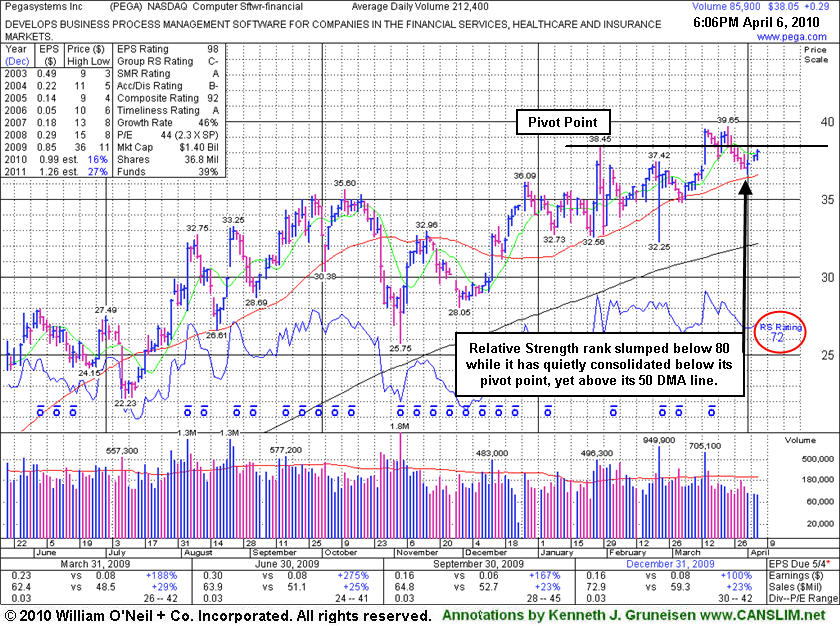
Pegasystems Inc. (PEGA +$0.29 or +0.77% to $38.05) has failed thus far to follow through with confirming gains on heavy volume since it last appeared in this FSU section on 3/15/10 with an annotated graph under the headline "Software Firm Breaks Out After Announcing Acquisition." That considerable gain above its pivot point with more than 3 times average volume met the requirement for a technical buy signal. The bullish action came after the high-ranked Computer Software - Financial firm announced plans to buy Chordiant Software Inc (CHRD), a firm with sub par fundamentals under the investment system guidelines. It is far more common for any company making an acquisition to pull back while the firm being acquired rises, however the market reacted positively to the news and lifted PEGA shares.
PEGA recently found support above its 50-day moving average (DMA) line after slumping below its pivot point and testing support near prior chart highs previously noted as "an initial support level to watch on subsequent pullbacks." Another concern is that its Relative Strength rank has slumped to 72 from an 88 back on February 8, 2010, whereas the best buy candidates under the investment system rules are stocks with RS ranks above the 80 minimum guideline. It had 80+ ranks when it was featured in the January 2010 issue of CANSLIM.net News (read here). The company has attracted an increasing number of institutional investors, as the number of top-rated funds owning its shares rose from 43 in Sep '08 to 90 in Dec '09, which is a solid reassurance concerning the investment system's I criteria. It has shown good sales revenues increases and its earnings increases were well above the +25% guideline in the 5 last quarterly comparisons versus the year ago period.
Software Firm Breaks Out After Announcing Acquisition Plans - Monday, March 15, 2010
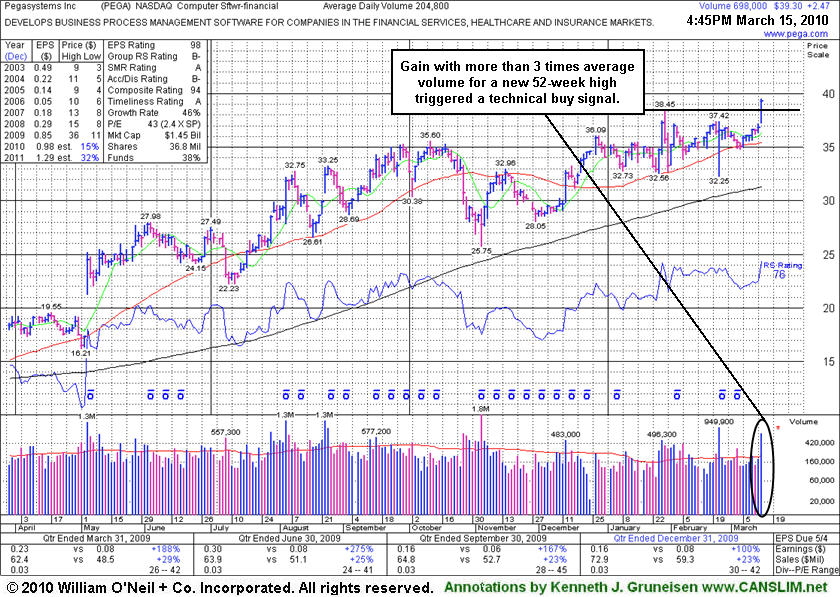
Pegasystems Inc. (PEGA +2.47 or +7.15% to $39.30) gapped up today and rallied to a new 52-week high. The considerable gain above its pivot point with more than 3 times average volume met the requirement for a technical buy signal. The bullish action came after the high-ranked Computer Software - Financial firm announced plans to buy Chordiant Software Inc (CHRD), a firm with sub par fundamentals under the investment system guidelines. It is far more common for any company making an acquisition to pull back while the firm being acquired rises, however the market reacted positively to the news and lifted PEGA shares. Prior chart highs are now an initial support level to watch on subsequent pullbacks.
It recently found support near its 50-day moving average (DMA) line. Mostly healthy action has followed since its color code was changed to yellow 2/26/10 with a new pivot point cited and an annotated graph included under the headline "Consolidation Continues For Computer Software Firm." It was featured in the January 2010 issue of CANSLIM.net News (read here). The company has attracted an increasing number of institutional investors, as the number of top-rated funds owning its shares rose from 43 in Sep '08 to 90 in Dec '09, which is a solid reassurance concerning the investment system's I criteria. It has shown good sales revenues increases and its earnings increases were well above the +25% guideline in the 5 last quarterly comparisons versus the year ago period.
Consolidation Continues For Computer Software Firm - Friday, February 26, 2010
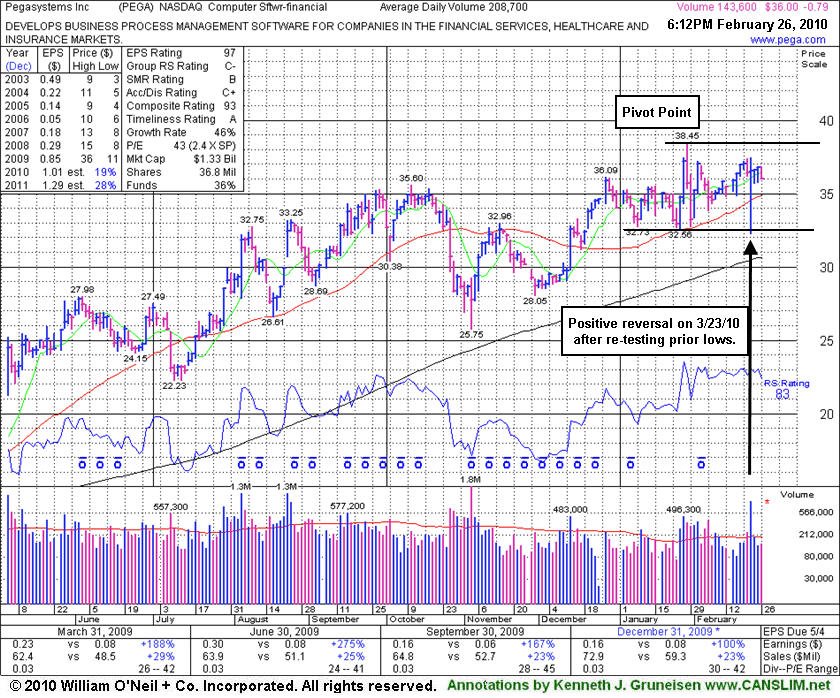
Pegasystems Inc. (PEGA -0.79 or -2.15% to $36.00) has shown mostly healthy action since its last appearance in this FSU section on 2/08/10 under the headline "Latest Breakout Promptly Failed, Yet 50 DMA Acted As Support". Now consolidating above its 50-day moving average (DMA) line for about 5-weeks since reaching its all-time high on 1/28/10, its color code was changed to yellow today with a new pivot point cited. Disciplined investors would note that it still needs a convincing gain above its pivot point to trigger a new technical buy signal. It positively reversed on 2/23/10 after a brief 50 DMA line violation, finding prompt support near prior chart lows in the $32 area. Market conditions (M criteria) are currently an overriding concern prompting great caution, since a follow-through day is currently needed from at least one of the major averages to confirm the latest rally.
PEGA was featured in the January 2010 issue of CANSLIM.net News (read here). This high-ranked Computer Software - Financial firm develops, markets, licenses, and supports software to automate various business processes primarily the United States, the United Kingdom, and Europe. It has attracted an increasing number of institutional investors, as the number of top-rated funds owning its shares rose from 43 in Sep '08 to 89 in Dec '09, which is a solid reassurance concerning the investment system's I criteria. PEGA has shown good sales revenues increases and its earnings increases were well above the +25% guideline in the 5 last quarterly comparisons versus the year ago period. The previously noted downturn in annual earnings (the A criteria) from 2003 to 2006 has been followed by a solid turn around and big earnings increases in '07, '08 and '09. The stock has built a new base but caution and patience are suggested until and the broader market (M criteria) proves itself.
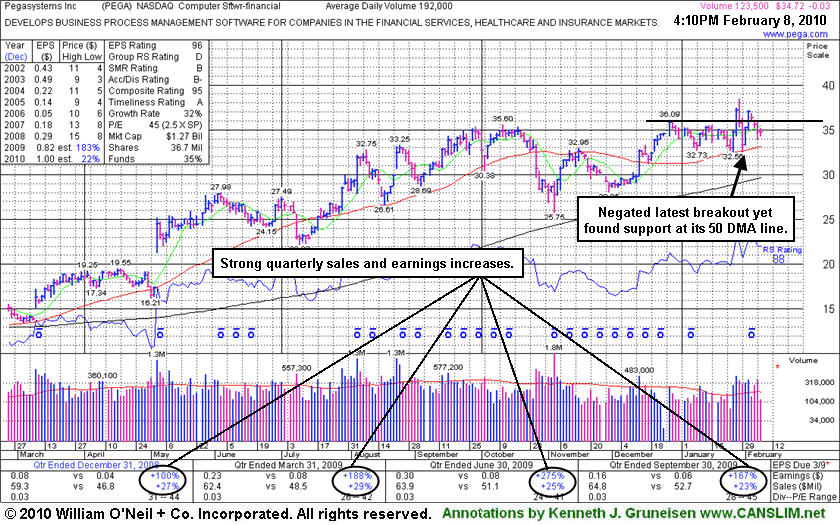
Latest Breakout Promptly Failed, Yet 50 DMA Acted As Support - Monday, February 08, 2010
Pegasystems Inc. (PEGA -0.19 or -0.55% to $34.56) was down today on lighter volume as it fell for a 4th consecutive loss. Wider than usual intra-day price swings in the past 2 weeks were noted as signs of uncertainty. Since its prior appearance in this FSU section on 1/25/10 under the headline "No Buy Signal Since Recently Featured in CANSLIM.net News" it broke out with great volume conviction on 1/27/10 and triggered a technical buy signal, however 2 big losses on heavy volume promptly negated that breakout. Its 50-day moving average line and recent chart lows near $32.50 help define important technical support, where violations would trigger more worrisome sell signals. Negative market conditions (M criteria) are currently an overriding concern prompting great caution, since a follow-through day is still needed to confirm a new rally.
PEGA was featured in the January 2010 issue of CANSLIM.net News (read here). This high-ranked Computer Software - Financial firm develops, markets, licenses, and supports software to automate various business processes primarily the United States, the United Kingdom, and Europe. It has attracted an increasing number of institutional investors, as the number of top-rated funds owning its shares rose from 43 in Sep '08 to 84 in Dec '09, which is a solid reassurance concerning the investment system's I criteria. PEGA has shown good sales revenues increases and its earnings increases were well above the +25% guideline in the 4 last quarterly comparisons versus the year ago period. The previously noted downturn in annual earnings (the A criteria) from 2003 to 2006 has been followed by a solid turn around and big earnings increases in '07, '08 and '09.
No Buy Signal Since Recently Featured in CANSLIM.net News - Monday, January 25, 2010
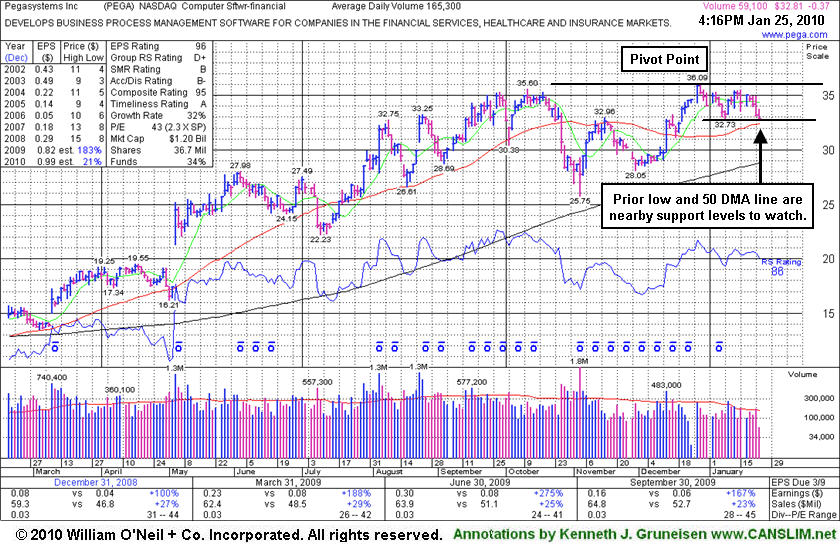
Pegasystems Inc. (PEGA -0.25 or -0.75% to $32.93) suffered a 4th consecutive loss today with light volume, closing near prior chart lows and just above its 50-day moving average (DMA) line in the $32-33 area which define important chart support. Additional deterioration would raise concerns and hurt it chances for the near term. Prior highs in the $35-36 area have been a stubborn resistance level since featured in the January 2010 issue of CANSLIM.net News (read here). Since that appearance it did not trigger a proper technical buy signal, so disciplined investors did not risk any capital if they simply waited for the critical confirming gains that would have dictated taking action.
This high-ranked Computer Software - Financial firm develops, markets, licenses, and supports software to automate various business processes primarily the United States, the United Kingdom, and Europe. It has attracted an increasing number of institutional investors, as the number of top-rated funds owning its shares rose from 43 in Sep '08 to 79 in Dec '09, which is a solid reassurance concerning the investment system's I criteria. PEGA has shown good sales revenues increases and its earnings increases were well above the +25% guideline in the 4 last quarterly comparisons versus the year ago period. The previously noted downturn in annual earnings (the A criteria) from 2003 to 2006 has been followed by a solid turn around and big earnings increases in '07, '08 and '09.
Caution and patience are suggested until the stock manages to trigger a solid technical buy signal with gains above its pivot point. Until then, investors may be wise to resist the urge to get in "early." Confirming gains backed by more than the minimum +50% above average volume guideline would provide a reassuring proof of institutional buying demand which could sustain a more meaningful upward advance. Keep in mind that much of a stock's success depends on the broader market's (the M criteria) ability to sustain a meaningful rally, otherwise 3 out of 4 stocks are likely to struggle in the event that the market encounters more distributional pressure in the new year. Since the market is currently in a corrections, odds are not in favor of new buys working out until a new rally is confirmed with a follow-through-day of gains from at least one of the 3 major market averages.
No Overhead Supply To Act As Resistance For Software Firm - Sunday, January 03, 2010
|
Pegasystems Inc. |
- Kenneth Gruneisen, Founder/Contributing Writer, www.CANSLIM.net | |
|
Ticker Symbol: PEGA (NASDAQ) |
Industry Group: Computer Software - Financial |
Shares Outstanding: 36,700,000 |
|
Price: $34.00 1/03/2010 |
Day's Volume: 120,900 12/31/2009 |
Shares in Float: 14,700,000 |
|
52 Week High: $36.09 12/28/2009 |
50-Day Average Volume: 256,300 |
Up/Down Volume Ratio: 0.8 |
|
Pivot Point: $36.19 12/28/2009 (high plus $0.10) |
Pivot Point +5% = Max Buy Price: $38.00 |
Web Address: http://www.pega.com/ |

CANSLIM.net Company Profile: Pegasystems Inc. is a high-ranked Computer Software - Financial firm that develops, markets, licenses, and supports software to automate various business processes primarily the United States, the United Kingdom, and Europe. It has attracted an increasing number of institutional investors, as the number of top-rated funds owning its shares rose from 43 in Sep '08 to 78 in Sep '09, which is a solid reassurance concerning the investment system's I criteria. PEGA has shown good sales revenues increases and its earnings increases were well above the +25% guideline in the 4 last quarterly comparisons versus the year ago period. The previously noted downturn in annual earnings (the A criteria) from 2003 to 2006 has been followed by a solid turn around and big earnings increases in '07, '08 and '09.
What to Look For and What to Look Out For: The stock is currently consolidating near its all-time highs. Caution and patience are suggested until the stock manages to trigger a solid technical buy signal with gains above its pivot point. Until then, investors may be wise to resist the urge to get in "early." Confirming gains backed by more than the minimum +50% above average volume guideline would provide a reassuring proof of institutional buying demand which could sustain a more meaningful upward advance. Keep in mind that much of a stock's success depends on the broader market's (the M criteria) ability to sustain a meaningful rally, otherwise 3 out of 4 stocks are likely to struggle in the event that the market encounters more distributional pressure in the new year.
Technical Analysis: The stock has built a choppy base over about 12 weeks since its prior 52-week high of $35.60 was reached on October 12th. During that period it encountered heavy distributional pressure, yet it generally found support above earlier chart highs in the $27 area and stayed well above its 200-day moving average (DMA) line. One concern is that its Relative Strength line (jagged blue line) has not provided recent confirmation by spiking to a new high (above its Septermber highs, as the annotated graph shows) first, but its Relative Strength rating of 85 is nicely above the minimum guideline of 80. A considerable gain with above average volume on 12/14/09 helped its outlook improve by rallying above its 50 DMA line. Subsequent gains have lacked great volume conviction, but no overhead supply remains to act as resistance to hinder the stock's ability to rally, which is an encouraging sign.
Latest Earnings News Fails To Help Slumping Software Stock - Wednesday, November 04, 2009
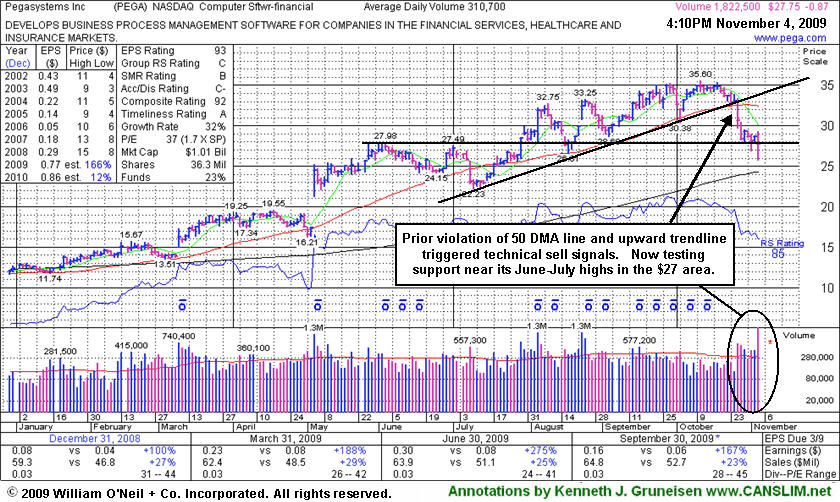
Pegasystems Inc (PEGA -$0.87 or -3.14% to $27.75) suffered a loss today with almost 6 times average volume after opening the session with a steep decline following its results for the period ended Sept 30, 2009, yet it rebounded considerably from its early lows after briefly undercutting its June-July highs. It flashed worrisome technical sell signals last week while violating its 50-day moving average (DMA) line and sinking below an upward trendline connecting its July-October lows. Since its 10/23/09 appearance in this FSU section under the headline "Quiet Consolidation Near Important Support Level" its subsequent losses on above average volume have been noted as signs of distribution. Prior resistance in the $27 area is an important chart support level for it to find prompt support. Additional damaging losses would hurt its outlook. It would need to rally back above its 50 DMA for its outlook to improve.
This high-ranked Computer Software - Financial firm attracted an increasing number of institutional investors, as the number of top-rated funds owning its shares rose from 43 in Sep '08 to 80 in Jun '09, which is a solid reassurance concerning the investment system's I criteria. PEGA has shown good sales revenues increases and its earnings increases were well above the +25% guideline in the 4 last quarterly comparisons versus the year ago period. The previously noted downturn in annual earnings (the A criteria) from 2003 to 2006 has been followed by a solid turn around and big earnings increases in '07 and '08, and Street expectations for '09 are calling for well above +25% growth.
Quiet Consolidation Near Important Support Level - Friday, October 23, 2009
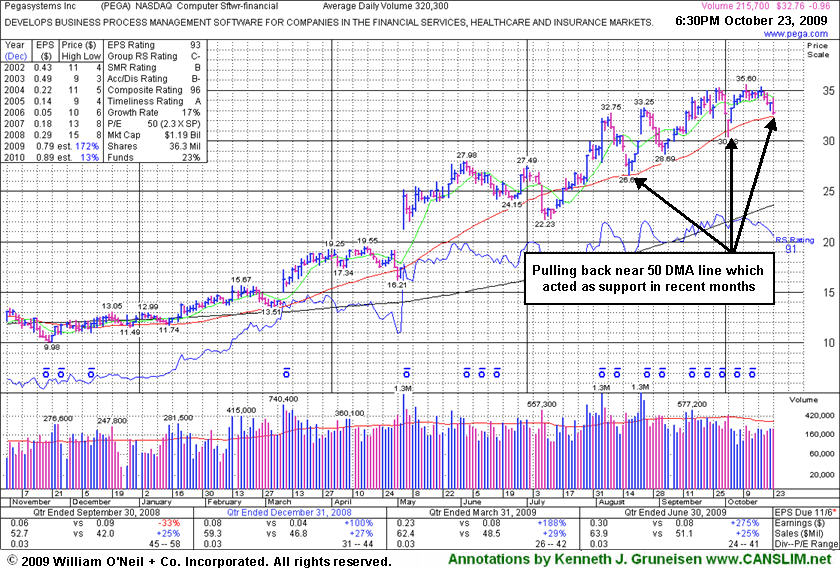
Pegasystems Inc (PEGA -$0.96 or -1.02% to $32.76) gapped up today but then negatively reversed for a loss on light volume, pulling back near its 50 DMA line. This high-ranked Computer Software - Financial firm quietly ended the week just above that short-term average line. An upward trendline (not drawn) connecting its July-October lows also coincides in that area, helping define an important technical support level to watch. Violations could trigger technical sell signals, with its 10/02/09 intra-day low ($30.38) the next chart support level to keep an eye on.
The number of top-rated funds owning its shares rose from 43 in Sep '08 to 80 in Jun '09, which is a solid reassurance concerning the investment system's I criteria. PEGA has shown solid sales revenues increases and +25% earnings increases in the 3 last quarterly comparisons versus the year ago period. It also appears to have an easy comparison in the upcoming report for the quarter ended September 30, 2009 versus the year ago period's earnings of only 6 cents per share. The previously noted downturn in annual earnings (the A criteria) from 2003 to 2006 has been followed by a solid turn around and big earnings increases in '07 and '08, and Street expectations for '09 are calling for well above +25% growth.
Software Firm Hovering In Close Striking Distance of All-Time Highs - Thursday, October 08, 2009
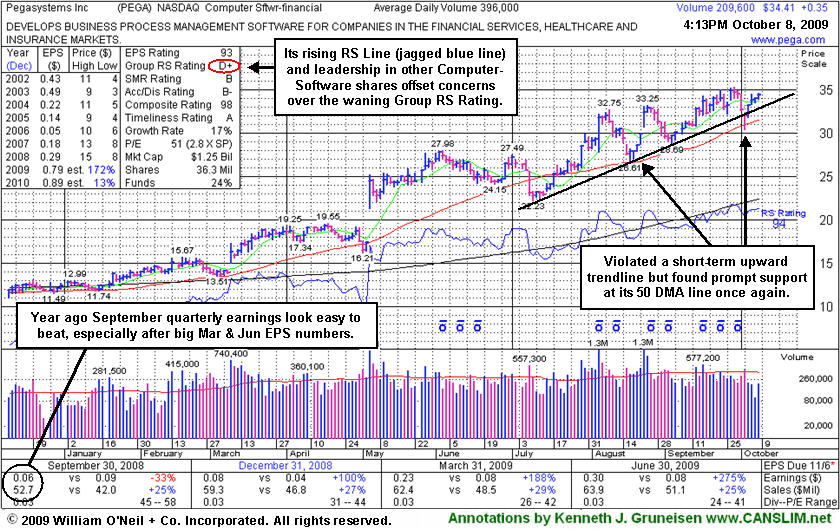
Pegasystems Inc (PEGA +$0.35 or +1.02% to $34.41) posted a 4th consecutive gain on light volume today, rallying toward all-time highs after its latest test of support at its 50-day moving average (DMA) line. Since its last FSU section appearance the high-ranked Computer Software - Financial firm briefly violated an upward trendline connecting its July-September chart lows, an initial chart support level. The group's RS Rating (see red circle) was also previously noted for having slumped to D+ from a B when PEGA first triggered a technical buy signal as its broke out from a "double bottom" base when featured in the 7/29/09 mid-day report (read here). However, the stock has a 94 Relative Strength rank now, and it is a reassuring sign to see its Relative Strength line (the jagged blue line) recently rising above its August highs.
PEGA has shown solid sales revenues increases and +25% earnings increases in the 3 last quarterly comparisons versus the year ago period. It also appears to have an easy comparison in the upcoming report for the quarter ended September 30, 2009 versus the year ago period's earnings of only 6 cents per share. The previously noted downturn in annual earnings (the A criteria) from 2003 to 2006 has been followed by a solid turn around and big earnings increases in '07 and '08, and Street expectations for '09 are calling for well above +25% growth.
All-Time High Despite Software Group's Waning Relative Strength - Tuesday, September 22, 2009
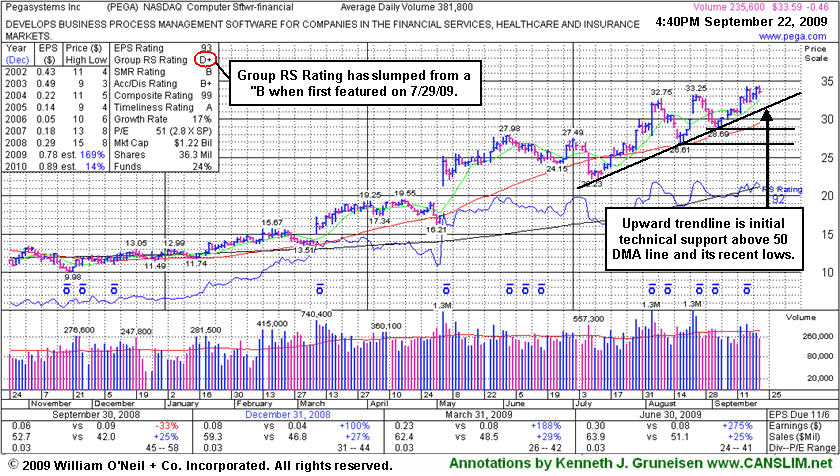
Pegasystems Inc (PEGA -$0.47 or -1.38% to $33.58) reached a new all-time high today but it reversed for a small loss on lighter volume. Volume-driven gains pegged the high-ranked Computer Software - Financial firm to a new all-time high on 9/16/09. Now an upward trendline connecting its July-September chart lows may be watched as an initial chart support level. Additional support might be expected at its 50-day moving average (DMA) line and its recent low ($28.69 on 9/03/09).
The group's RS Rating (see red circle) has slumped to D+ from a B when PEGA first triggered a technical buy signal as its broke out from a "double bottom" base on the day it was featured in the 7/29/09 mid-day report (read here). The stock itself has a 92 Relative Strength rank now, but it might be acting stronger if the industry group was strengthening rather than weakening in the recent period. PEGA has shown solid sales revenues increases and +25% earnings increases in the 3 last quarterly comparisons versus the year ago period. The previously noted downturn in annual earnings (the A criteria) from 2003 to 2006 has been followed by a solid turn around and big earnings increases in '07 and '08, and Street expectations for '09 are calling for well above +25% growth.
Ascending Base A Possible 4th Stage Set-Up To Watch - Wednesday, September 09, 2009
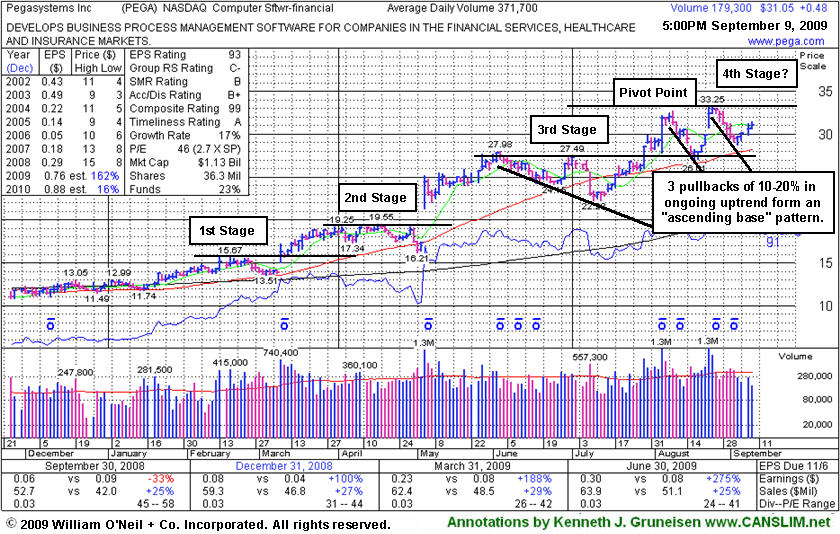
Pegasystems Inc (PEGA +$0.57 or +1.86% to $31.14) has been quietly consolidating above its 50-day moving average line, with volume totals drying up since its big 8/24/09 gain. It promptly stalled after clearing its early-August highs and fell back near its short-term average again, yet it proved resilient and found great support during a brief market correction which recently led many leading stocks to break down at key chart support levels. Now an upward trendline (not shown) connecting its July-September chart lows may be watched as an initial chart support level above additional support that might be expected at its 50 DMA line and its recent low ($26.61 on 8/18/09). PEGA may be forming an "ascending base" pattern, so its color code is changed to yellow with new pivot point and max buy levels noted. Ascending bases are formed when an upward trending stock endures 3 pullbacks of 10-20%, each pullback followed by higher highs and higher lows. This analysis is considering the previously cited "double bottom" as the first of three pullbacks, followed by two more recent pullbacks. Therefore, a powerful breakout with volume conviction could trigger a fresh technical buy signal. However, this may also be considered a 4th stage base, and experienced investors know that late stage bases can be more failure prone.
PEGA first triggered a technical buy signal when rising from the "double bottom" base on the day it was featured in the 7/29/09 mid-day report (read here). The Computer Software - Financial firm has shown solid sales revenues increases and +25% earnings increases in the 3 last quarterly comparisons versus the year ago period. The previously noted downturn in annual earnings (the A criteria) from 2003 to 2006 has been followed by a solid turn around and big earnings increases in '07 and '08, and Street expectations for '09 are calling for well above +25% growth.
Software Firm Rallies To New High After Testing Support - Monday, August 24, 2009
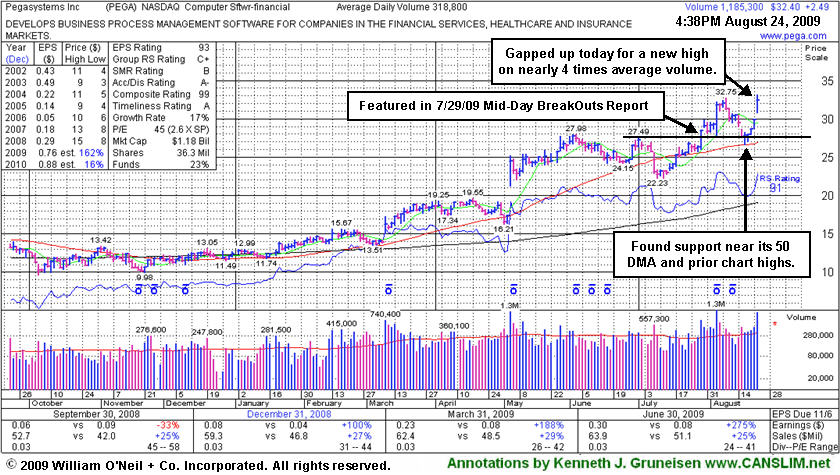
Pegasystems Inc (PEGA +$2.49 or +8.36% to $32.40) gapped up today for a considerable gain and new high close with volume nearly 4 times average, its 5th consecutive gain on ever-increasing volume. As noted in its last appearance in this section on 8/11/09 (read here), "studies have shown that approximately 40% of successful breakouts pull back and re-test their pivot points before continuing higher." Prior highs which were old resistance in the mid-$27 area have recently served as a technical support level along with its 50-day moving average line (now $26.87). It proved resilient and found great support during a brief market correction which recently led many stocks to break down at key chart support levels.
PEGA posted a considerable 8/05/09 gain with nearly 5 times average volume following strong Q2 earnings and raised guidance. It first triggered a technical buy signal when rising from the "double bottom" base on the day it was featured in the 7/29/09 mid-day report (read here). The Computer Software - Financial firm has shown solid sales revenues increases and +25% earnings increases in the 3 last quarterly comparisons versus the year ago period. The previously noted downturn in annual earnings (the A criteria) from 2003 to 2006 has been followed by a solid turn around and big earnings increases in '07 and '08, and Street expectations for '09 are calling for well above +25% growth.
Normal Consolidation After Getting A Bit Extended - Tuesday, August 11, 2009
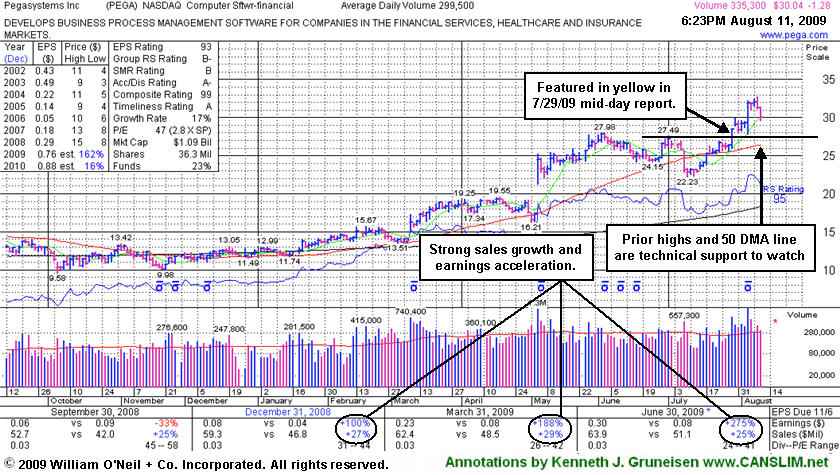
Pegasystems Inc (PEGA -$1.28 or -4.09% to $30.04) gapped down for a loss today on lighter volume following a negative reversal after hitting a new high on the prior session. It is still extended from its latest base and above its "max buy" level. Note that studies have shown that approximately 40% of successful breakouts pull back and re-test their pivot points before continuing higher. Prior chart highs which were resistance in the mid-$27 area are now a very important technical support level to watch, and they come into play above its 50-day moving average line (now $26.39). It posted a considerable 8/05/09 gain with nearly 5 times average volume following strong Q2 earnings and raised guidance. That was a confirming follow-through gain after the high-ranked software firm had first triggered a technical buy signal when rising from the "double bottom" base on the day it was featured in the 7/29/09 mid-day report (read here).
Disciplined investors avoid chasing stocks extended more than +5% above their pivot point, and once any new buys are made, those stocks are quickly sold if they fall more than -7% from the buy price. Investors who typically enter stop-loss order -7% below their buy price might raise their stop losses and not be willing to give the stock as much room to the downside now. However, after having seen it trade as much as +19% above its pivot point, also keep in mind a rule of the investment system that says a stock which rallies more than +20% in the first 2-3 weeks after it was bought should be held for a minimum of 8 weeks and given a chance to produce more substantial gains. It may be worthwhile to occasionally review past trades to see if you have a tendency to let losing positions get out of control, chase stocks and buy them too late, or jump the gun and buy them before they have triggered a proper breakout from a sound base pattern. Being ultra-careful in regard to entries and exits provides no guarantee that investors will reap huge profits, however, undisciplined buying and selling decisions will obviously hurt your chances of having great success.
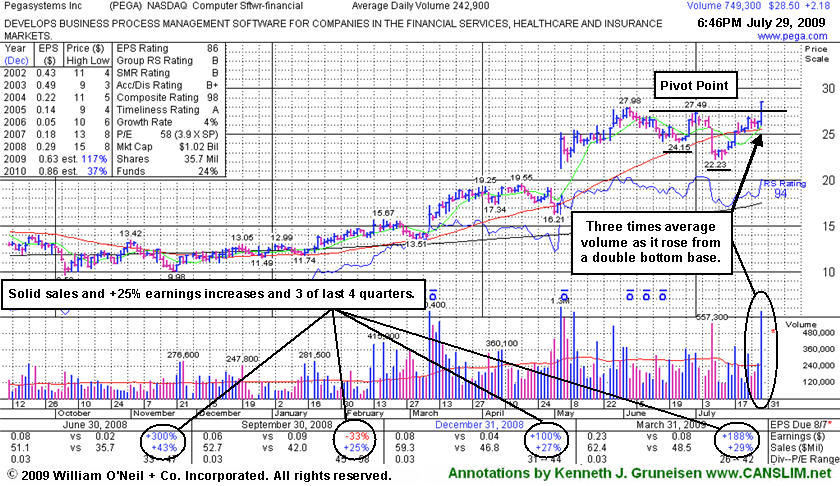
During its last base, the second low was a "lower low" which provided the necessary "shakeout" which is an important characteristic of a proper double bottom pattern. The heavy volume behind its breakout easily met the minimum +50% above average volume guideline of the investment system for a proper breakout. The high-ranked Computer Software - Financial firm has shown solid sales revenues increases and +25% earnings increases and 3 of last 4 quarterly comparisons versus the year ago period. The previously noted downturn in annual earnings (the A criteria) from 2003 to 2006 has been followed by a solid turn around and big earnings increases in '07 and '08, and Street expectations for '09 are calling for well above +25% growth.
Software Firm Pegs New Highs With Big Gain on Triple Average Volume - Wednesday, July 29, 2009
Pegasystems Inc (PEGA +$2.18 or +8.28% to $28.50) was featured in yellow in today's mid-day report (read here) during the course of its considerable gain on heavy volume 3 times its average for a new 52-week high. There were no news headlines to be found as this software firm triggered a technical buy signal by breaking out from a third stage, 8-week "double bottom" type base. The second low was a "lower low" which provided a necessary "shakeout" which is an important characteristic of a proper double bottom pattern. The heavy volume behind its breakout easily met the minimum +50% above average volume guideline of the investment system for a proper breakout. The high-ranked Computer Software - Financial firm has shown solid sales revenues increases and +25% earnings increases and 3 of last 4 quarterly comparisons versus the year ago period. The previously noted downturn in annual earnings (the A criteria) from 2003 to 2006 has been followed by a solid turn around and big earnings increases in '07 and '08, and Street expectations for '09 are calling for well above +25% growth. As always, disciplined investors avoid chasing stocks extended more than +5% above their pivot point, and once any new buys are made, those stocks are quickly sold if they fall more than -7% from the buy price. Being ultra-careful in regard to entries and exits provides no guarantee that investors will reap huge profits, however, undisciplined buying and selling decisions will obviously hurt your chances of great success.
