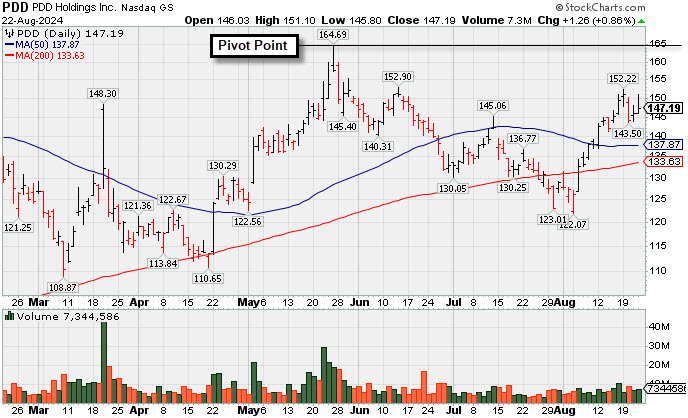
Rebounding Toward Prior High With Earnings News Due - Thursday, August 22, 2024
PDD Holdings (PDD +$1.26 or +0.86% to $147.19) was highlighted in the earlier mid-day report (read here) in yellow with pivot point cited based on its 5/24/24 high plus 10 cents. Keep in mind it is due to report Jun '24 quarterly results on 8/26/24. Volume and volatilitry often increase near earnings news. Fundamentals have been strong. It is perched -10.6% off its high and faces near-term resistance due to overhead supply up to the $164 level. Subsequent gains above the pivot point backed by at least +40% above average volume are needed for its outlook to improve.
PDD found support near its 200 DMA line ($134) and rebounded above the 50 DMA line ($138) helping its outlook to improve. It was dropped from the Featured Stocks list on 7/11/24 when last shown in this FSU section under the headline "Sputtering Below 50-Day Moving Average Line". It has a highest possible Earnings Per Share Rating of 99. Quarterly comparisons through Mar '24 showed encouraging sales revenues and greatly improved earnings versus the year-ago periods with growth rate acceleration. After years of losses, it had a profitable FY '21-23 helping it better match the fundamental annual earnings (A criteria) guidelines of the fact-based investment system.
The number of top-rated funds owning its shares rose from 1,487 in Jun '23 to 1,954 in Jun '24, a reassuring sign concerning the I criteria. Its current Up/Down Volume Ratio of 0.9 is an unbiased indication its shares have been under slight distributional pressure over the past 50 days. It has an A Timelinesss Rating and a B Sponsorship Rating.
| Symbol/Exchange Company Name Industry Group | PRICE | CHANGE | Day High | Volume (% DAV) (% 50 day avg vol) | 52 Wk Hi | Featured Date | Price Featured | Pivot Featured |
| Max Buy | ||||||||
U.S. Lime & Minerals Bldg-Cement/Concrt/Ag | $77.14 | -1.55 -1.97% | $78.69 | 59,232 50 DAV is 94,000 | $87.13 -11.47% | 6/18/2024 | $71.26 | PP = $75.77 |
| MB = $79.56 | ||||||||
G - Pulled back today. Volume totals have been cooling while consolidating above its 50 DMA line ($75.49). Near-term resistance remains due to overhead supply up to the $87 level. >>> FEATURED STOCK ARTICLE : Volume Cooling While Consolidating Above 50-Day Moving Average - 8/21/2024 | View all notes | Set NEW NOTE alert | Company Profile | SEC News | Chart | Request a new note | ||||||||
Granite Construction Bldg-Heavy Construction | $71.66 | +0.53 0.75% | $72.59 | 397,908 50 DAV is 716,000 | $73.01 -1.85% | 6/11/2024 | $59.76 | PP = $64.33 |
| MB = $67.55 | ||||||||
| Most Recent Note - 8/21/2024 5:23:16 PM G - Volume was below average behind today''s small gain. Prior highs in the $64 area define important support to watch coinciding with its 50 DMA line ($65.28). >>> FEATURED STOCK ARTICLE : Hit New High While Making Steady Progress - 7/31/2024 | View all notes | Set NEW NOTE alert | Company Profile | SEC News | Chart | Request a new note | ||||||||
MakeMyTrip Leisure-Travel Booking | $97.77 | -2.06 -2.06% | $100.67 | 399,869 50 DAV is 704,000 | $100.22 -2.44% | 7/23/2024 | $96.92 | PP = $93.39 |
| MB = $98.06 | ||||||||
Y - There was a "negative reversal" today for a loss with light volume after touching a new all-time high. Posted a big gain on the prior session with +34% above-average volume and ended near the session high for a best-ever close. Recently found prompt support near its 50 DMA line ($88.48). >>> FEATURED STOCK ARTICLE : Volume Driven Trip to New Highs - 7/23/2024 | View all notes | Set NEW NOTE alert | Company Profile | SEC News | Chart | Request a new note | ||||||||
Texas Roadhouse Retail-Restaurants | $168.32 | -1.29 -0.76% | $170.87 | 411,750 50 DAV is 821,000 | $177.72 -5.29% | 7/26/2024 | $173.08 | PP = $175.82 |
| MB = $184.61 | ||||||||
| Most Recent Note - 8/21/2024 5:24:40 PM G - Posted a gain today with below-average volume. Closed just above its 50 DMA line ($169.51) which is now downward sloping and has acted as resistance. >>> FEATURED STOCK ARTICLE : Encountered Distributional Pressure When Poised to Break Out - 7/26/2024 | View all notes | Set NEW NOTE alert | Company Profile | SEC News | Chart | Request a new note | ||||||||
Howmet Aerospace Aerospace/Defense | $96.55 | +0.29 0.30% | $97.09 | 1,437,572 50 DAV is 3,090,000 | $97.29 -0.76% | 7/30/2024 | $93.95 | PP = $85.52 |
| MB = $89.80 | ||||||||
| Most Recent Note - 8/20/2024 6:00:44 PM Y - Volume totals have still been cooling while hovering near its all-time high. Found prompt support after a pullback tested prior highs in the $85 area defining initial support to watch above its 50 DMA line ($84.21). >>> FEATURED STOCK ARTICLE : Breakaway Gap For Howmet Aerospace - 7/30/2024 | View all notes | Set NEW NOTE alert | Company Profile | SEC News | Chart | Request a new note | ||||||||
| Symbol/Exchange Company Name Industry Group | PRICE | CHANGE | Day High | Volume (% DAV) (% 50 day avg vol) | 52 Wk Hi | Featured Date | Price Featured | Pivot Featured |
| Max Buy | ||||||||
MercadoLibre Retail-Internet | $1,988.83 | -18.63 -0.93% | $2,019.00 | 191,465 50 DAV is 319,000 | $2,029.99 -2.03% | 8/5/2024 | $1,793.73 | PP = $1,792.15 |
| MB = $1,881.76 | ||||||||
| Most Recent Note - 8/21/2024 5:25:28 PM G - Posted a gain today with light volume, hovering near its 52-week high. Prior highs define initial support to watch on pullbacks. >>> FEATURED STOCK ARTICLE : Finished Flat When Poised to Breakout - 8/5/2024 | View all notes | Set NEW NOTE alert | Company Profile | SEC News | Chart | Request a new note | ||||||||
PDD Holdings ADR Retail-Internet | $147.19 | +1.26 0.86% | $151.10 | 7,348,036 50 DAV is 6,682,000 | $164.69 -10.63% | 8/22/2024 | $146.35 | PP = $164.79 |
| MB = $173.03 | ||||||||
Y - Color code was changed to yellow with pivot point cited based on its 5/24/24 high plus 10 cents. Due to report Jun '24 quarterly results on 8/26/24. Fundamentals have been strong. It faces near-term resistance due to overhead supply up to the $164 level. Found support near its 200 DMA line ($134) and rebounded above the 50 DMA line ($138) helping its outlook to improve. It was dropped from the Featured Stocks list on 7/11/24. Subsequent gains above the pivot point backed by at least +40% above average volume are needed for its outlook to improve. See the latest FSU analysis for more details and a new annotated graph. >>> FEATURED STOCK ARTICLE : Rebounding Toward Prior High With Earnings News Due - 8/22/2024 | View all notes | Set NEW NOTE alert | Company Profile | SEC News | Chart | Request a new note | ||||||||
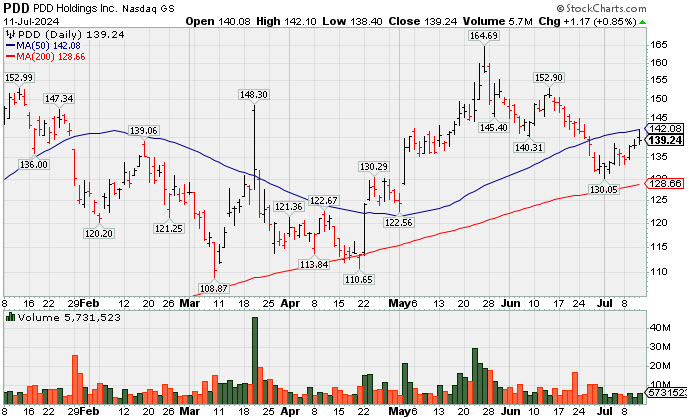
Sputtering Below 50-Day Moving Average Line - Thursday, July 11, 2024
PDD Holdings (PDD +$1.17 or +0.85% to $139.24) posted a 3rd consecutive small gain with below average volume, sputtering below its 50-day moving average (DMA) line which may act as resistance. A rebound above the 50 DMA line ($142) is needed for its outlook to improve. Its 200 DMA line ($128.66) defines important near-term support.
PDD was last shown in this FSU section on 6/17/24 under the headline "Still Sputtering Below Pivot Point After Negating Breakout". It has a highest possible Earnings Per Share Rating of 99. Quarterly comparisons through Mar '24 showed encouraging sales revenues and greatly improved earnings versus the year-ago periods with growth rate acceleration. After years of losses, it had a profitable FY '21-23 helping it better match the fundamental annual earnings (A criteria) guidelines of the fact-based investment system.
The number of top-rated funds owning its shares rose from 1,487 in Jun '23 to 1,888 in Jun '24, a reassuring sign concerning the I criteria. Its current Up/Down Volume Ratio of 1.2 is an unbiased indication its shares have been under accumulation over the past 50 days. It has a B Timelinesss Rating and a B Sponsorship Rating.
| Symbol/Exchange Company Name Industry Group | PRICE | CHANGE | Day High | Volume (% DAV) (% 50 day avg vol) | 52 Wk Hi | Featured Date | Price Featured | Pivot Featured |
| Max Buy | ||||||||
TransDigm Group Aerospace/Defense | $1,255.64 | -17.04 -1.34% | $1,267.96 | 297,754 50 DAV is 243,000 | $1,369.58 -8.32% | 4/12/2024 | $1,224.21 | PP = $1,246.32 |
| MB = $1,308.64 | ||||||||
| Most Recent Note - 7/10/2024 5:10:50 PM G - Still lingering below its 50 DMA line ($1,304). A rebound above the 50 DMA line is needed to help its outlook improve. Fundamentals remain strong. See the latest FSU analysis for more details and a new annotated graph. >>> FEATURED STOCK ARTICLE : Lingering Below 50-Day Moving Average But Only -7% Off High - 7/10/2024 | View all notes | Set NEW NOTE alert | Company Profile | SEC News | Chart | Request a new note | ||||||||
U.S. Lime & Minerals Bldg-Cement/Concrt/Ag | $372.63 | +8.84 2.43% | $377.83 | 50,559 50 DAV is 23,000 | $378.78 -1.62% | 6/18/2024 | $356.30 | PP = $378.88 |
| MB = $397.82 | ||||||||
Y - Gapped up today challenging its all-time high. Found support while consolidating above its 50 DMA line ($351). Color code was changed to yellow with new pivot point cited based on its 5/15/24 high plus 10 cents. Subsequent gains above the pivot point backed by at least +40% above average volume may trigger a new (or add-on) technical buy signal. >>> FEATURED STOCK ARTICLE : in Striking Distance of All-Time High After Volume-Driven Gains - 6/28/2024 | View all notes | Set NEW NOTE alert | Company Profile | SEC News | Chart | Request a new note | ||||||||
Celestica Elec-Contract Mfg | $59.48 | -1.99 -3.24% | $61.94 | 1,946,542 50 DAV is 2,143,000 | $62.09 -4.20% | 7/6/2024 | $57.62 | PP = $61.16 |
| MB = $64.22 | ||||||||
| Most Recent Note - 7/10/2024 2:22:15 PM Y - Hitting a new all-time high with today''s 3rd consecutive gain. A gain backed by at least +40% above average volume and a close above the new pivot point cited based on its 5/28/24 high plus 10 cents may trigger a proper technical buy signal. Important support is at prior highs in the $51 area and its 50 DMA line. >>> FEATURED STOCK ARTICLE : Consolidating Above Prior Highs in an Orderly Fashion - 6/27/2024 | View all notes | Set NEW NOTE alert | Company Profile | SEC News | Chart | Request a new note | ||||||||
e.l.f. Beauty Cosmetics/Personal Care | $208.92 | +9.46 4.74% | $210.85 | 1,123,677 50 DAV is 1,541,000 | $221.83 -5.82% | 6/18/2024 | $212.40 | PP = $221.93 |
| MB = $233.03 | ||||||||
Y - Posted a big gain today with below-average volume. Color code was changed to yellow with new pivot point cited based on its 3/04/24 high plus 10 cents. Subsequent gains above the pivot point backed by at least +40% above average volume may trigger a new (or add-on) technical buy signal. Its 50 DMA line ($185) defines important near-term support to watch. >>> FEATURED STOCK ARTICLE : Perched Within Striking Distance of All-Time High - 6/20/2024 | View all notes | Set NEW NOTE alert | Company Profile | SEC News | Chart | Request a new note | ||||||||
PDD Holdings ADR Retail-Internet | $139.24 | +1.17 0.85% | $142.10 | 6,342,340 50 DAV is 9,139,000 | $164.69 -15.45% | 5/24/2024 | $161.85 | PP = $153.09 |
| MB = $160.74 | ||||||||
G - Posted a 3rd consecutive small gain today with light volume, still lingering below its 50 DMA line ($142). A rebound above the 50 DMA line is needed for its outlook to improve. Its 200 DMA line ($128) defines important near-term support. See the latest FSU analysis for more details and a new annotated graph. >>> FEATURED STOCK ARTICLE : Sputtering Below 50-Day Moving Average Line - 7/11/2024 | View all notes | Set NEW NOTE alert | Company Profile | SEC News | Chart | Request a new note | ||||||||
| Symbol/Exchange Company Name Industry Group | PRICE | CHANGE | Day High | Volume (% DAV) (% 50 day avg vol) | 52 Wk Hi | Featured Date | Price Featured | Pivot Featured |
| Max Buy | ||||||||
CrowdStrike Holdings Computer Sftwr-Security | $370.43 | -4.02 -1.07% | $379.78 | 3,085,292 50 DAV is 5,109,000 | $398.33 -7.00% | 5/28/2024 | $351.47 | PP = $365.10 |
| MB = $383.36 | ||||||||
| Most Recent Note - 7/9/2024 10:42:15 PM G - Color code is changed to green after it touched a new high today above its "max buy" level but reversed into the red. Prior highs in the $358-365 area define initial support to watch above its 50 DMA line ($350). Fundamentals remain strong. >>> FEATURED STOCK ARTICLE : Encountered Distributional Pressure Hovering Near All-Time High - 6/21/2024 | View all notes | Set NEW NOTE alert | Company Profile | SEC News | Chart | Request a new note | ||||||||
Novo Nordisk ADR Medical-Ethical Drugs | $139.79 | -2.95 -2.07% | $142.53 | 3,821,583 50 DAV is 3,892,000 | $148.15 -5.64% | 6/7/2024 | $143.06 | PP = $138.38 |
| MB = $145.30 | ||||||||
Y - Pulled back today with near-average volume. Consolidating above prior highs in the $138 area which define initial support to watch above its 50 DMA line ($137). Fundamentals remain strong. >>> FEATURED STOCK ARTICLE : Perched Near All-Time High Following Recent Gap Up With Volume - 7/1/2024 | View all notes | Set NEW NOTE alert | Company Profile | SEC News | Chart | Request a new note | ||||||||
Granite Construction Bldg-Heavy Construction | $62.73 | +2.26 3.74% | $63.16 | 1,671,746 50 DAV is 557,000 | $65.08 -3.61% | 6/11/2024 | $59.76 | PP = $64.33 |
| MB = $67.55 | ||||||||
Y - Rebounded above its 50 DMA line ($61.17) with today''s 2nd consecutive volume-driven gain helping its outlook improve and its color code is changed to yellow. >>> FEATURED STOCK ARTICLE : Granite Testing Support at 50-Day Moving Average - 7/2/2024 | View all notes | Set NEW NOTE alert | Company Profile | SEC News | Chart | Request a new note | ||||||||
Datadog Inc Computer Sftwr-Enterprse | $127.19 | +0.90 0.71% | $129.71 | 4,209,379 50 DAV is 4,184,500 | $138.61 -8.24% | 7/9/2024 | $126.92 | PP = $138.71 |
| MB = $145.65 | ||||||||
| Most Recent Note - 7/9/2024 10:43:37 PM Y - Suffered a loss today with above average volume, finishing weak after highlighted in yellow in the earlier mid-day report with pivot point cited based on its 2/13/24 high plus 10 cents. Consolidating above its 50 DMA line and perched within striking distance of its 52-week high. Reported Mar ''24 quarterly earnings +91% on +27% sales revenues versus the year-ago period its 4th consecutive quarterly comparison well above the +25% minimum earnings guideline (C criteria). Its annual earnings (A criteria) history has been strong since completing its $27 IPO on 9/19/19. See the latest FSU analysis for more details and a new annotated graph. >>> FEATURED STOCK ARTICLE : Consolidating Within Close Range of 52-Week High - 7/9/2024 | View all notes | Set NEW NOTE alert | Company Profile | SEC News | Chart | Request a new note | ||||||||
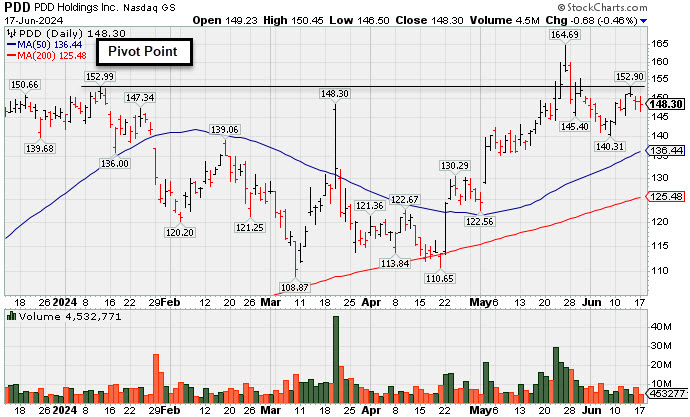
Still Sputtering Below Pivot Point After Negating Breakout - Monday, June 17, 2024
PDD Holdings (PDD -$0.68 or -0.46% to $148.30) pulled back today with below average volume. It raised concerns recently as it negated the breakout after clearing a 20-week base. Disciplined investors avoid big losses by selling any stock that falls more than 7-8% below their purchase price. It was last shown in this FSU section on 5/28/24 under the headline "Pulled Back Below Prior Highs Raising Concerns".
It has a highest possible Earnings Per Share Rating of 99. Quarterly comparisons through Mar '24 showed encouraging sales revenues and greatly improved earnings versus the year-ago periods with growth rate acceleration. After years of losses, it had a profitable FY '21-23 helping it better match the fundamental annual earnings (A criteria) guidelines of the fact-based investment system.
The number of top-rated funds owning its shares rose from 1,487 in Jun '23 to 1,862 in Mar '24, a reassuring sign concerning the I criteria. Its current Up/Down Volume Ratio of 1.5 is an unbiased indication its shares have been under accumulation over the past 50 days. It has an A Timelinesss Rating and a B Sponsorship Rating.
Chart courtesy of www.stockcharts.com
| Symbol/Exchange Company Name Industry Group | PRICE | CHANGE | Day High | Volume (% DAV) (% 50 day avg vol) | 52 Wk Hi | Featured Date | Price Featured | Pivot Featured |
| Max Buy | ||||||||
TransDigm Group Aerospace/Defense | $1,318.91 | +24.15 1.87% | $1,328.20 | 162,446 50 DAV is 209,000 | $1,369.58 -3.70% | 4/12/2024 | $1,224.21 | PP = $1,246.32 |
| MB = $1,308.64 | ||||||||
G - Quietly consolidating above its "max buy" level. Its 50 DMA line ($1,283) defines near-term support to watch. Fundamentals remain strong. >>> FEATURED STOCK ARTICLE : Transdigm Consolidating Above 50-Day Moving Average - 6/12/2024 | View all notes | Set NEW NOTE alert | Company Profile | SEC News | Chart | Request a new note | ||||||||
U.S. Lime & Minerals Bldg-Cement/Concrt/Ag | $354.59 | +12.28 3.59% | $354.74 | 30,072 50 DAV is 24,000 | $378.78 -6.39% | 2/9/2024 | $254.68 | PP = $265.09 |
| MB = $278.34 | ||||||||
G - Rebounding toward the prior high with higher volume behind today''s gain. Recently found prompt support near its 50 DMA line ($332). It has not formed a sound base. Fundamentals remain strong. >>> FEATURED STOCK ARTICLE : Streak of Losses Testing 50-Day Moving Average Line - 6/6/2024 | View all notes | Set NEW NOTE alert | Company Profile | SEC News | Chart | Request a new note | ||||||||
Celestica Elec-Contract Mfg | $57.02 | +1.31 2.35% | $57.47 | 1,952,264 50 DAV is 2,371,000 | $61.06 -6.62% | 5/15/2024 | $51.52 | PP = $51.22 |
| MB = $53.78 | ||||||||
G - Wedging higher after finding support near prior highs in the $51 area. Its 50 DMA line ($49.77) defines additional near-term support to watch on pullbacks. >>> FEATURED STOCK ARTICLE : Steady Pullback to Below "Max Buy" Level Following Rally - 6/4/2024 | View all notes | Set NEW NOTE alert | Company Profile | SEC News | Chart | Request a new note | ||||||||
Deckers Outdoor Apparel-Shoes and Rel Mfg | $1,017.49 | -6.26 -0.61% | $1,037.05 | 350,489 50 DAV is 360,000 | $1,106.89 -8.08% | 5/24/2024 | $1,010.60 | PP = $956.27 |
| MB = $1,004.08 | ||||||||
| Most Recent Note - 6/13/2024 4:36:56 PM G - Consolidating near its all-time high, extended from the prior base. Prior highs in the $956 area define initial support to watch on pullbacks. >>> FEATURED STOCK ARTICLE : Deckers Consolidating Near High - 6/13/2024 | View all notes | Set NEW NOTE alert | Company Profile | SEC News | Chart | Request a new note | ||||||||
e.l.f. Beauty Cosmetics/Personal Care | $195.41 | +2.78 1.44% | $198.01 | 689,718 50 DAV is 1,607,000 | $221.83 -11.91% | 5/24/2024 | $193.79 | PP = $182.73 |
| MB = $191.87 | ||||||||
G - Hovering near recent highs. Its 50 DMA line ($173) defines important near-term support to watch. >>> FEATURED STOCK ARTICLE : Down on Lighter Volume After Breakout From "Double Bottom" Base - 5/29/2024 | View all notes | Set NEW NOTE alert | Company Profile | SEC News | Chart | Request a new note | ||||||||
| Symbol/Exchange Company Name Industry Group | PRICE | CHANGE | Day High | Volume (% DAV) (% 50 day avg vol) | 52 Wk Hi | Featured Date | Price Featured | Pivot Featured |
| Max Buy | ||||||||
PDD Holdings ADR Retail-Internet | $148.30 | -0.68 -0.46% | $150.45 | 4,512,247 50 DAV is 9,410,000 | $164.69 -9.95% | 5/24/2024 | $161.85 | PP = $153.09 |
| MB = $160.74 | ||||||||
Y - Pulled back today with below average. Raised concerns recently as it negated the breakout after clearing a 20-week base. Disciplined investors avoid big losses by selling any stock that falls more than 7-8% below their purchase price. See the latest FSU analysis for more details and a new annotated graph. >>> FEATURED STOCK ARTICLE : Still Sputtering Below Pivot Point After Negating Breakout - 6/17/2024 | View all notes | Set NEW NOTE alert | Company Profile | SEC News | Chart | Request a new note | ||||||||
CrowdStrike Holdings Computer Sftwr-Security | $390.43 | +5.00 1.30% | $394.64 | 4,549,308 50 DAV is 3,507,000 | $390.71 -0.07% | 5/28/2024 | $351.47 | PP = $365.10 |
| MB = $383.36 | ||||||||
| Most Recent Note - 6/13/2024 4:35:53 PM Y - Color code is changed to yellow after pulling back just below its "max buy" level today with near average volume following 4 consecutive volume-driven gains for new all-time highs. Its 50 DMA line ($323) defines near-term support to watch. Bullish action came after it reported Apr '24 quarterly earnings +63% on +33% sales revenues versus the year-ago period, continuing its strong earnings track record. >>> FEATURED STOCK ARTICLE : Volume-Driven Loss Triggered Technical Sell Signal - 5/30/2024 | View all notes | Set NEW NOTE alert | Company Profile | SEC News | Chart | Request a new note | ||||||||
Novo Nordisk ADR Medical-Ethical Drugs | $140.37 | -2.13 -1.49% | $142.13 | 3,098,407 50 DAV is 3,725,000 | $144.50 -2.86% | 6/7/2024 | $143.06 | PP = $138.38 |
| MB = $145.30 | ||||||||
Y - Pulled back today with light volume. Recently wedged to new all-time highs with gains lacking great volume conviction. Color code was changed to yellow with pivot point cited based on its 3/07/24 high. To clinch a proper technical buy signal gains above the pivot point must be backed by at least +40% above-average volume. Fundamentals remain strong. >>> FEATURED STOCK ARTICLE : Wedging Into New High Ground - 6/7/2024 | View all notes | Set NEW NOTE alert | Company Profile | SEC News | Chart | Request a new note | ||||||||
Granite Construction Bldg-Heavy Construction | $61.97 | -0.32 -0.51% | $62.46 | 187,962 50 DAV is 436,000 | $64.33 -3.67% | 6/11/2024 | $59.76 | PP = $64.33 |
| MB = $67.55 | ||||||||
| Most Recent Note - 6/12/2024 5:34:03 PM Y - Gapped up today for a 3rd consecutive volume-driven gain. Color code was changed to yellow when highlighted on the earlier mid-day report as it was noted that a valid secondary buy point exists up to +5% above the recent high after finding support at its 10 WMA line following a prior breakout. Reported improved earnings in the Jun, Sep, Dec '23, and Mar '24 quarters versus the year ago periods. Annual earnings growth has been strong and steady. See the latest FSU analysis for more details and an annotated graph. >>> FEATURED STOCK ARTICLE : Granite Construction Found Support at 10-Week Moving Average - 6/11/2024 | View all notes | Set NEW NOTE alert | Company Profile | SEC News | Chart | Request a new note | ||||||||
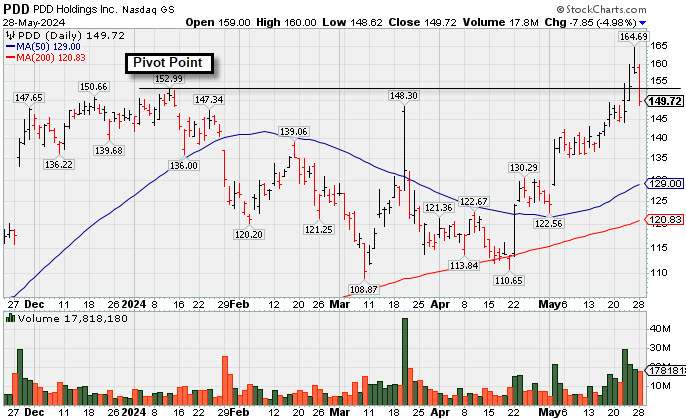
Pulled Back Below Prior Highs Raising Concerns - Tuesday, May 28, 2024
PDD Holdings (PDD $7.85 or -4.98% to $149.72) retreated abruptly today with a volume-driven loss undercutting the prior high raising concerns. It was highlighted in yellow in the 5/24/24 mid-day report with pivot point cited based on its 1/11/24 high plus 10 cents (read here). The Retail-Internet firm rallied to new 52-week highs with 3 consecutive volume-driven gains clearing a 20-week base during which it found prompt support at its 200 DMA line.
It has a highest possible Earnings Per Share Rating of 99. Quarterly comparisons through Mar '24 showed encouraging sales revenues and greatly improved earnings versus the year-ago periods with growth rate acceleration. After years of losses, it had a profitable FY '21-23 helping it better match the fundamental annual earnings (A criteria) guidelines of the fact-based investment system.
The number of top-rated funds owning its shares rose from 1,487 in Jun '23 to 1,855 in Mar '24, a reassuring sign concerning the I criteria. Its current Up/Down Volume Ratio of 1.7 is an unbiased indication its shares have been under accumulation over the past 50 days. It has an A Timelinesss Rating and a B Sponsorship Rating.
Chart courtesy of www.stockcharts.com