There are 3 more featured stock write-ups on since to 1/6/2025
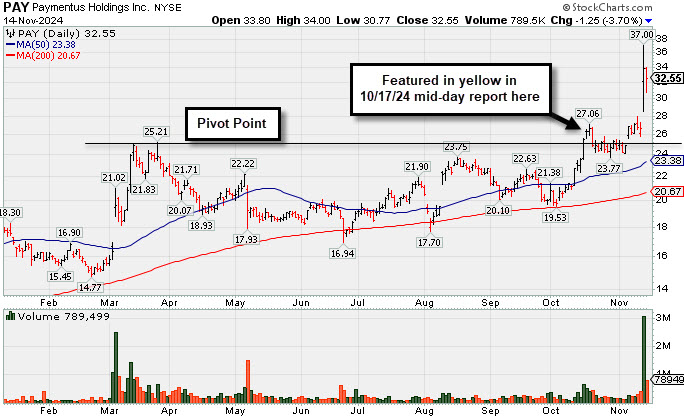
Extended From Prior Base After Considerable Spike Higher - Thursday, November 14, 2024
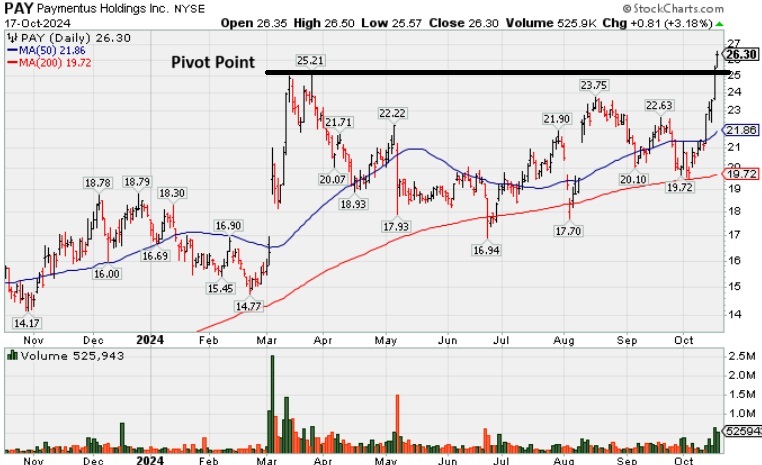
PAY found support near prior highs in the $24-25 area during the recent consolidation after it was highlighted in yellow with new pivot point cited based on its 3/21/24 high plus 10 cents in the 10/17/24 mid-day report (read here). It was shown greater detail in this FSU section on 10/17/24 with an annotated graph under the headline, "Paymentus Featured Breaking Out With Volume Driven Gains". It was noted that it broke out above the August '24 high on the prior session and continued higher with a 6th consecutive volume-driven gain. It has rallied impressively from support at its 200 DMA line ($20) since dropped from the Featured Stocks list on 5/07/24.
Paymentus Featured Breaking Out With Volume Driven Gains - Thursday, October 17, 2024
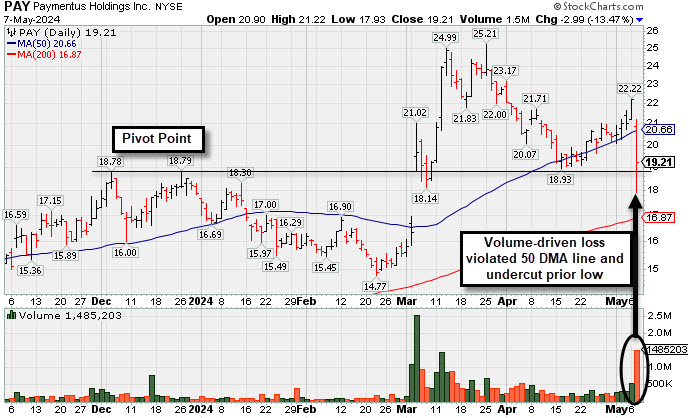
Damaging Volume-Driven Loss After Earnings News - Tuesday, May 7, 2024
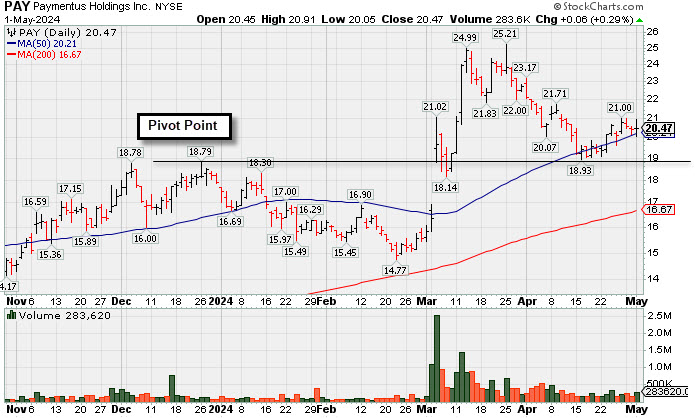
Finding Support Near Prior Highs and 50-Day Moving Average - Wednesday, May 1, 2024
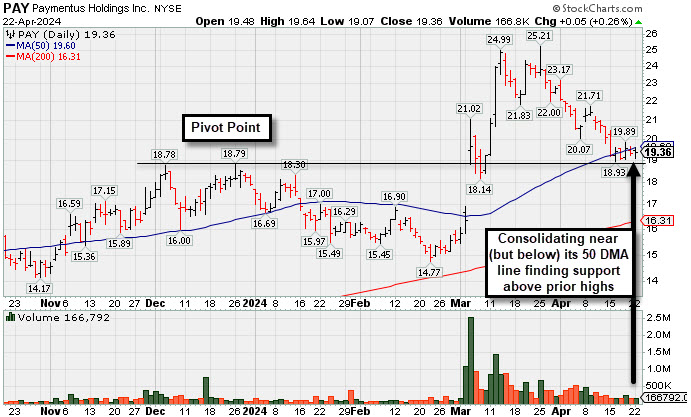
Prior Highs Define Important Near-Term Support - Monday, April 22, 2024
| Symbol/Exchange Company Name Industry Group | PRICE | CHANGE | Day High | Volume (% DAV) (% 50 day avg vol) | 52 Wk Hi | Featured Date | Price Featured | Pivot Featured |
| Max Buy | ||||||||
Novo Nordisk ADR Medical-Ethical Drugs | $125.26 | +2.55 2.08% | $126.25 | 3,798,340 50 DAV is 4,839,000 | $138.28 -9.42% | 3/1/2024 | $124.23 | PP = $124.97 |
| MB = $131.22 | ||||||||
G - Consolidating just below its 50 DMA line ($126) which may now act as resistance. A rebound above the 50 DMA line is needed for its outlook to improve. >>> FEATURED STOCK ARTICLE : Volume Cools While Consolidating Above 50-Day Moving Average Line - 4/3/2024 | View all notes | Set NEW NOTE alert | Company Profile | SEC News | Chart | Request a new note | ||||||||
Axon Enterprise Security/Sfty | $293.80 | +0.20 0.07% | $296.88 | 513,484 50 DAV is 519,000 | $329.87 -10.93% | 4/5/2024 | $309.90 | PP = $325.73 |
| MB = $342.02 | ||||||||
| Most Recent Note - 4/17/2024 3:43:19 PM Y - Testing its 50 DMA line ($298.68) today after 3 consecutive losses. Color code was changed to yellow with new pivot point cited based on its 3/04/24 high plus 10 cents. A gain above the pivot point backed by at least +40% above average volume is needed to trigger a proper technical buy signal. Fundamentals remain strong. >>> FEATURED STOCK ARTICLE : Volume Totals Cooling While Building a New Base - 4/8/2024 | View all notes | Set NEW NOTE alert | Company Profile | SEC News | Chart | Request a new note | ||||||||
TransDigm Group Aerospace/Defense | $1,200.93 | +13.23 1.11% | $1,213.66 | 147,923 50 DAV is 203,000 | $1,248.39 -3.80% | 4/12/2024 | $1,224.21 | PP = $1,246.32 |
| MB = $1,308.64 | ||||||||
| Most Recent Note - 4/17/2024 4:03:56 PM Y - Color code is changed to yellow after holding its ground in a tight range near its all-time high. New pivot point was cited based on its 4/04/24 high plus 10 cents. Subsequent gains above the pivot point backed by at least +40% above average volume are needed to trigger a proper new technical buy signal. Its 50 DMA line ($1,187) defines near-term support to watch. >>> FEATURED STOCK ARTICLE : Volume Totals Cooling While Perched Near High - 4/9/2024 | View all notes | Set NEW NOTE alert | Company Profile | SEC News | Chart | Request a new note | ||||||||
Paccar Trucks and Parts-Hvy Duty | $112.58 | +1.39 1.25% | $113.69 | 2,021,362 50 DAV is 2,248,000 | $125.50 -10.29% | 1/23/2024 | $100.35 | PP = $98.57 |
| MB = $103.50 | ||||||||
| Most Recent Note - 4/19/2024 12:06:30 PM G - Violated its 50 DMA line ($115) this week triggering a technical sell signal and it is on track today for a 6th consecutive loss. A prompt rebound above the 50 DMA line is needed for its outlook to improve. Fundamentals remain strong. >>> FEATURED STOCK ARTICLE : Pulling Back From High and Slumping Toward 50-Day Moving Average - 4/12/2024 | View all notes | Set NEW NOTE alert | Company Profile | SEC News | Chart | Request a new note | ||||||||
Hubbell Electrical-Power/Equipmt | $390.56 | +2.53 0.65% | $393.68 | 391,009 50 DAV is 401,000 | $429.61 -9.09% | 1/30/2024 | $343.26 | PP = $336.83 |
| MB = $353.67 | ||||||||
| Most Recent Note - 4/19/2024 6:40:48 PM G - Closed below its 50 DMA line ($390) with a loss today on near-average volume raising concerns. Slumped for 8 losses in the span of 10 sessions after a noted "negative reversal" at its all-time high on 4/04/24. See the latest FSU analysis for more details and a new annotated graph. >>> FEATURED STOCK ARTICLE : Closed Just Below 50-Day Moving Average With Quiet Loss - 4/19/2024 | View all notes | Set NEW NOTE alert | Company Profile | SEC News | Chart | Request a new note | ||||||||
| Symbol/Exchange Company Name Industry Group | PRICE | CHANGE | Day High | Volume (% DAV) (% 50 day avg vol) | 52 Wk Hi | Featured Date | Price Featured | Pivot Featured |
| Max Buy | ||||||||
U.S. Lime & Minerals Bldg-Cement/Concrt/Ag | $300.36 | +3.60 1.21% | $303.08 | 18,428 50 DAV is 23,000 | $308.00 -2.48% | 2/9/2024 | $254.68 | PP = $265.09 |
| MB = $278.34 | ||||||||
| Most Recent Note - 4/17/2024 4:04:26 PM G - Still hovering in a tight range in recent weeks near its all-time high, stubbornly holding its ground despite encountering some distributional pressure. Its 50 DMA line ($279) defines near-term support to watch. >>> FEATURED STOCK ARTICLE : Gain With Light Volume for Best Ever Close - 4/5/2024 | View all notes | Set NEW NOTE alert | Company Profile | SEC News | Chart | Request a new note | ||||||||
Paymentus Holdings Finance-CrdtCard/PmtPr | $19.36 | +0.05 0.26% | $19.64 | 166,792 50 DAV is 391,000 | $25.21 -23.21% | 3/5/2024 | $19.97 | PP = $18.89 |
| MB = $19.83 | ||||||||
G - Still lingering near its 50 DMA line ($19.60) which defines important near-term support above prior highs in the $18 range. More damaging losses would raise greater concerns. See the latest FSU analysis for more details and a new annotated graph. >>> FEATURED STOCK ARTICLE : Prior Highs Define Important Near-Term Support - 4/22/2024 | View all notes | Set NEW NOTE alert | Company Profile | SEC News | Chart | Request a new note | ||||||||
HubSpot Comp Sftwr-Spec Enterprs | $633.04 | +1.80 0.29% | $641.55 | 511,528 50 DAV is 541,000 | $693.85 -8.76% | 4/4/2024 | $686.66 | PP = $660.10 |
| MB = $693.11 | ||||||||
| Most Recent Note - 4/19/2024 6:42:23 PM Y - Pulled back today testing its 50 DMA line ($625) with a loss on +52% above-average volume. Stalled after highlighted yellow in the 4/04/24 mid-day report with pivot point cited based on its 2/09/24 high plus 10 cents. Initial support is at its prior highs and its 50 DMA line ($626). Fundamentals remain strong. Faces some resistance due to old overhead supply up to the $866 level. >>> FEATURED STOCK ARTICLE : Encountered Distributional Pressure and Finished Below Pivot Point - 4/4/2024 | View all notes | Set NEW NOTE alert | Company Profile | SEC News | Chart | Request a new note | ||||||||
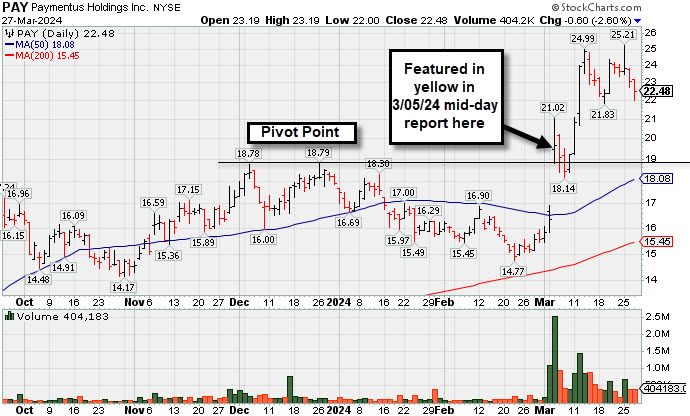
Consolidating After Powerful Breakout and Volume-Driven Gains - Wednesday, March 27, 2024
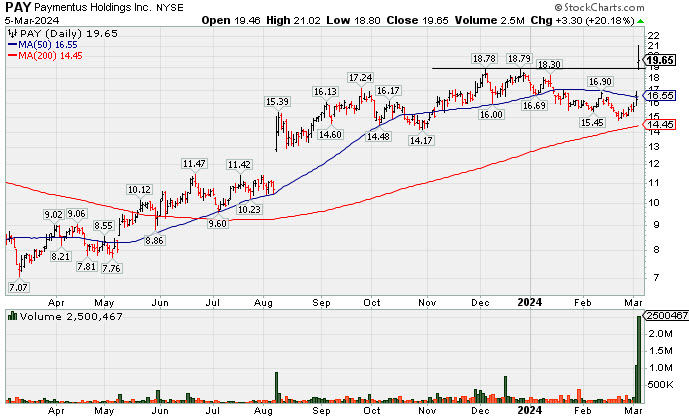
Big Gap Up Gain Triggered Technical Buy Signal - Tuesday, March 5, 2024
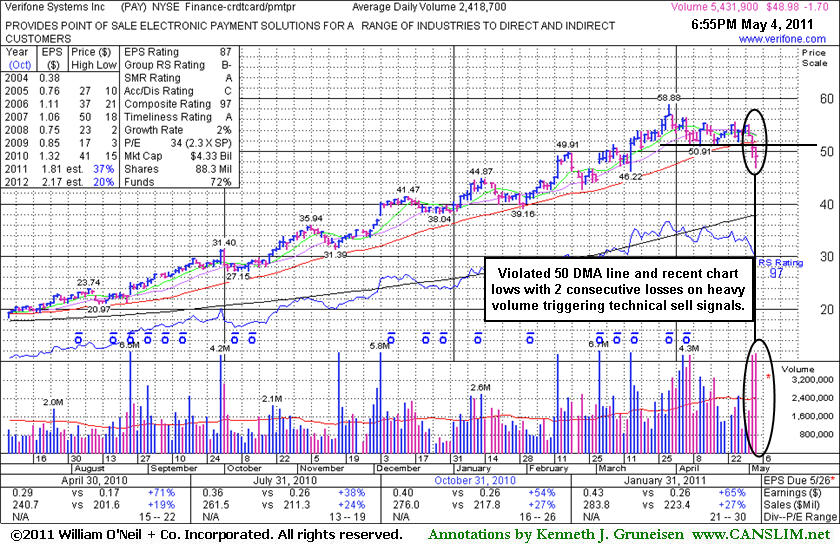
Damaging Losses Triggered Technical Sell Signals - Wednesday, May 04, 2011
Verifone Systems Inc (PAY -$1.70 or -3.35% to $48.98) was down considerably again today with heavy volume. A violation of its 50-day moving average (DMA) line and prior chart lows on 5/03/11 with a damaging loss on above average volume raised concerns and triggered technical sell signals. It recently formed a short flat base, considered a riskier "late-stage" base, but following the deterioration its color code was changed to green. The "Ken's Mailbag" Q&A in the 4/29/11 After Market Update included more details about late-stage bases (read here).
Since its last appearance on 4/04/11 in this FSU section with detailed analysis and an annotated graph under the headline, "Volume Without Progress Indicates Distributional Pressure", its 50 DMA line was repeatedly noted as chart support to watch. A prompt rebound above its 50 DMA would help its outlook, however it may be a while before another sound base forms, and in the interim disciplined investors might look at other fresh breakouts as better buy candidates.
The number of top-rated funds owning its shares rose from 380 in March '10 to 623 in March '11, a nice reassurance concerning the I criteria. It traded up as much as +142.3% from its price when it was featured on 8/25/10 in yellow at $24.30 in the mid-day report (read here) while then rising from a cup-with-handle base. The downward turn in FY '08 annual earnings (A criteria) was previously noted as a concern, yet its recent bullish action and accelerating sales revenues and earnings growth in recent quarterly comparisons provided reassuring signs. Additionally, leadership (new highs) from other electronic payment-related firms has recently provided reassurances with respect to the L criteria of the fact-based system, however the Finance - Credit Card Payment Processing group currently has a mediocre Group RS rating of 62.
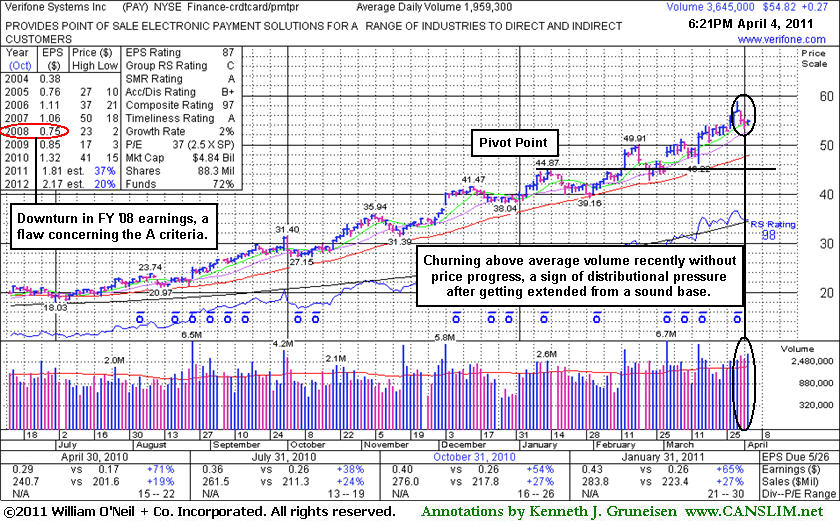
Volume Without Progress Indicates Distributional Pressure - Monday, April 04, 2011
Verifone Systems Inc (PAY +$0.27 or +0.49% to $54.82) is perched near its all-time high, holding its ground. However, high volume without meaningful price progress in recent sessions is a sign that it has been enduring some distributional pressure. It has been repeatedly noted - "No resistance remains due to overhead supply, but it is extended from a sound base pattern. Its 50 DMA line defines chart support to watch." It has shown mostly healthy action since its last appearance on 3/02/11 in this FSU section with detailed analysis and an annotated graph under the headline, "Gap Up Gain Followed Another Strong Earnings Report" after reporting earnings +65% on +27% sales revenues for the quarter ended January 31, 2011 versus the year-ago period.
The number of top-rated funds owning its shares rose from 380 in March '10 to 591 in December 2010, a nice reassurance concerning the I criteria. It has traded up as much as +142.3% from its price when it was featured on 8/25/10 in yellow at $24.30 in the mid-day report (read here) while then rising from a cup-with-handle base.
The downward turn in FY '08 annual earnings (A criteria) was previously noted as a concern, yet its recent bullish action and accelerating sales revenues and earnings growth in recent quarterly comparisons provided reassuring signs. Additionally, leadership (new highs) from other electronic payment-related firms has recently provided reassurances with respect to the L criteria of the fact-based system, however the Finance - Credit Card Payment Processing group currently has a mediocre Group RS rating of 37. It may be a while before another sound base forms or any secondary buy point develops, so in the interim, disciplined investors might look at other fresh breakouts as better buy candidates.
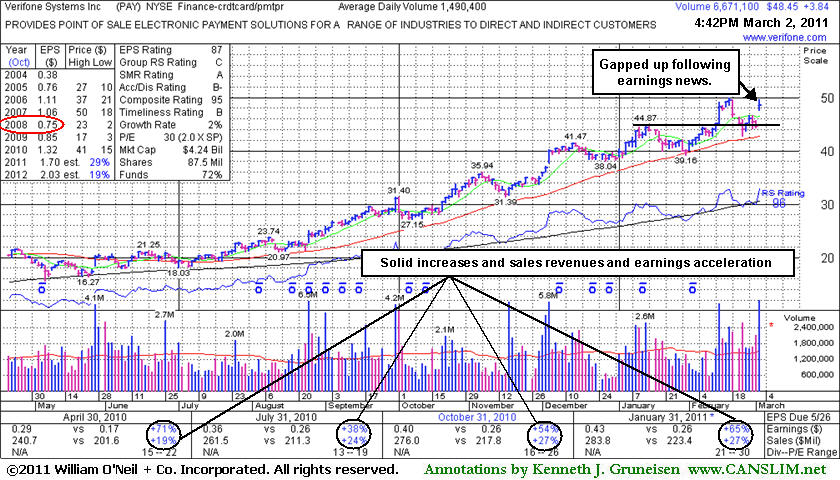
Gap Up Gain Followed Another Strong Earnings Report - Wednesday, March 02, 2011
Verifone Systems Inc (PAY +$3.84 or +8.61% to $48.45) gapped up today after reporting earnings +65% on +27% sales revenues for the quarter ended January 31, 2011 versus the year-ago period. Its color code was changed to green after again getting extended from a sound base. Since its last appearance on 1/27/11 in this FSU section with detailed analysis and an annotated graph under the headline "Ascending Base Pattern Formed After +84% Rally" it found prompt support at its 50-day moving average (DMA) line. Then it blasted higher on 2/14/11 with heavy volume triggering a technical buy signal, but it quickly got extended beyond its "max buy" level. During its subsequent consolidation its color code had been changed to yellow while it found support near its prior highs and well above 50 DMA line.
The number of top-rated funds owning its shares rose from 380 in March '10 to 565 in December 2010, a nice reassurance concerning the I criteria. It has traded up +105.4% from its price when it was featured on 8/25/10 in yellow at $24.30 in that day's mid-day report (read here) while then rising from a cup-with-handle base.
The downward turn in FY '08 annual earnings (A criteria) was previously noted as a concern, yet its recent bullish action and accelerating sales revenues and earnings growth in recent quarterly comparisons provided reassuring signs. Additionally, leadership (new highs) from other electronic payment-related firms has recently provided reassurances with respect to the L criteria of the fact-based system, even though the Finance - Credit Card Payment Processing group currently has a mediocre Group RS rating of 40.
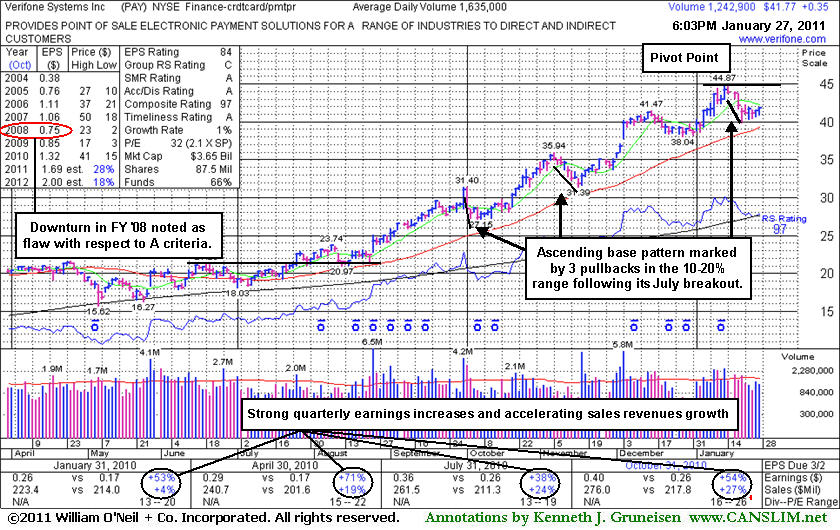
Ascending Base Pattern Formed After +84% Rally - Thursday, January 27, 2011
Verifone Systems Inc (PAY +$0.35 or +0.85% to $41.77) is now consolidating -7% off its 52-week high. It has formed a new "ascending base" pattern since breaking out in July. Its 50-day moving average (DMA) line defines important near-term chart support to watch. Its color code was changed to yellow while a new pivot point was cited based on its 52-week high plus ten cents. Subsequent gains with heavy volume may trigger a new (or add-on) technical buy signal.
Disciplined investors would avoid the temptation to get in "early" and watch for compelling proof of fresh institutional buying demand driving it to new highs. The number of top-rated funds owning its shares rose from 380 in March '10 to 500 in December 2010, a nice reassurance concerning the I criteria. It has traded up +84.65% from its price when it was featured on 8/25/10 in yellow at $24.30 in that day's mid-day report (read here) while then rising from a cup-with-handle base.
The downward turn in FY '08 annual earnings (A criteria) was previously noted as a concern, yet its recent bullish action and accelerating sales revenues growth in recent quarterly comparisons provided reassuring signs. Additionally. Leadership (new highs) from other electronic payment-related firms has recently provided reassurances with respect to the L criteria of the fact-based system, even though the Finance - Credit Card Payment Processing group currently has a mediocre Group RS rating of 40.
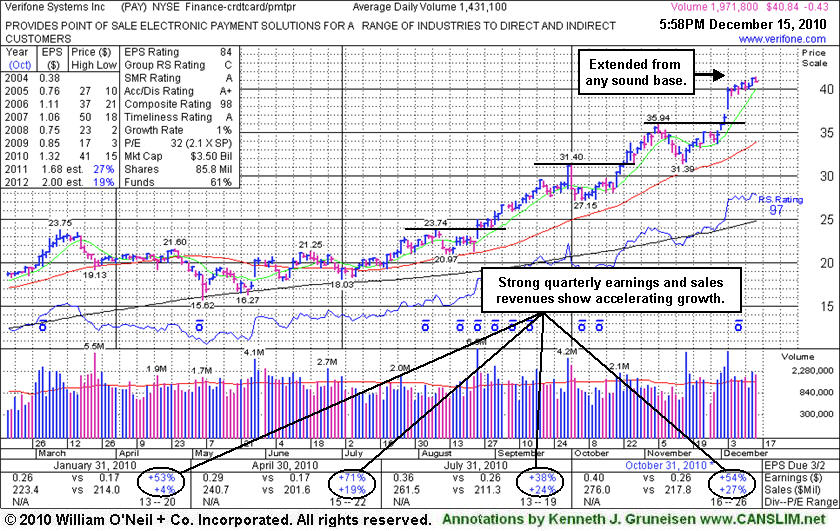
Rose +70% Since August Cup-With-Handle Breakout - Wednesday, December 15, 2010
Verifone Systems Inc (PAY -$0.43 or -1.04% to $40.84) has been getting extended from a sound base. Its prior high in the $36 area defines initial chart support to watch above its 50-day moving average (DMA) line. Disciplined investors would avoid chasing it and watch for a new base to eventually develop. It has traded up +70.6% from its price when it was featured on 8/25/10 in yellow at $24.30 in that day's mid-day report (read here) while then rising from a cup-with-handle base.
The downward turn in FY '08 annual earnings (A criteria) was noted as a concern, yet its recent bullish action and accelerating sales revenues growth in recent quarterly comparisons provided reassuring signs. It found support well above its 50 DMA line and continued higher since its last appearance in this FSU section was on 10/25/10 under the headline 'Strong Performance Since Returning to Featured Stocks List".
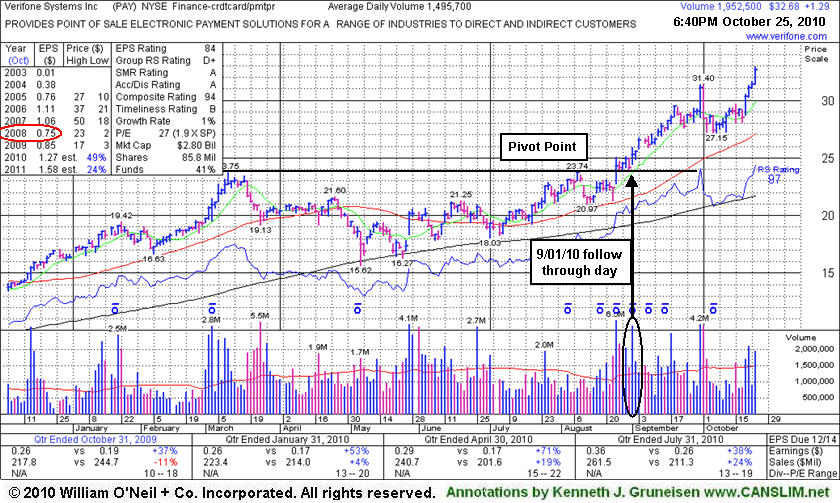
Strong Performance Since Returning to Featured Stocks List - Monday, October 25, 2010
Verifone Systems Inc (PAY +$1.29 or +4.11% to $32.68) hit a new 52-week high today, and volume totals have been above average behind 3 of its 4 consecutive gains. It is extended from a sound base pattern, so disciplined investors would avoid chasing it and watch for a secondary buy point to eventually develop. Its 50-day moving average (DMA) line and recent lows near $27 define chart support. It is up +34.5% from its price when it was featured on 8/25/10 as it blasted higher following better than expected results and was noted in that day's mid-day report (read here) while then rising from a cup-with-handle base.
The downward turn in annual earnings (A criteria, see red circle) was noted as a concern, yet its recent bullish action and accelerating sales revenues growth in recent quarterly comparisons provided reassuring signs. Its last appearance in this FSU section was on 8/30/10 under the headline "Payment Solutions Firm Overcame Previous Setback" as we observed - "It has rebounded impressively and is now clear of overhead supply after a powerful technical breakout with 6 times average volume, however the M criteria is now arguing against new buying efforts until a new follow-through day occurs from at least one of the major averages." The follow-through day arrived on September 1st (read here), confirming the new rally.
The next earlier appearance in this FSU section was a follow-up story that was published on 12/18/08 with an annotated graph under the headline "Patience Did Not Pay; Fundamental Flaws Prompted Technical Gap Down" - that illustrated its decline after it had earlier been dropped from the Featured Stocks page! Keep in mind that stocks that are dropped from the Featured Stocks list have typically triggered multiple sell signals that were previously noted as raising concerns. In the event that any dropped stock rebounds and matches favorably with the investment system guidelines it may eventually be noted as it returns to the Featured Stocks list.
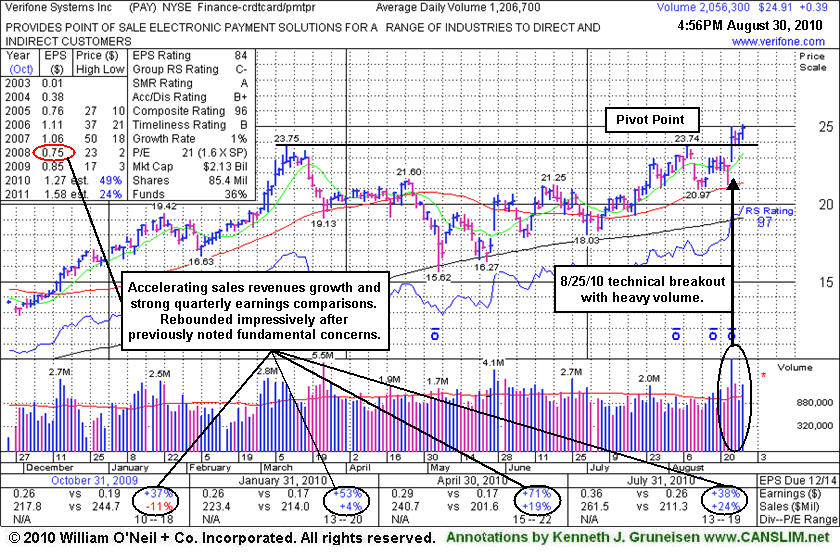
Payment Solutions Firm Overcame Previous Setback - Monday, August 30, 2010
Verifone Systems Inc (PAY +$0.39 or +1.59% to $24.91) hit another new 52-week high today and its color code was changed to green after inching above its "max buy" level. It blasted higher on 8/25/10 following better than expected results and was noted in that day's mid-day report (read here) while then rising from a cup-with-handle base. The downward turn in annual earnings (A criteria, see red circle) is a concern, yet its recent bullish action and accelerating sales revenues growth in recent quarterly comparisons are reassuring signs it has overcome the previous setback.
Its prior appearance in this FSU section was a follow-up story published on 12/18/08 with an annotated graph under the headline "Patience Did Not Pay; Fundamental Flaws Prompted Technical Gap Down" that illustrated its decline after it had earlier been dropped from the Featured Stocks page. It was noted in the 8/25/10 mid-day report - "Long ago, based on disappointing fundamental news and very weak technical action, it was dropped from the Featured Stocks list on 12/3/2007 as it gapped down for a considerable loss after the company said it would restate its earnings for the past three quarters, with the added warning that revelations of deeper problems may follow. It has rebounded impressively and is now clear of overhead supply after a powerful technical breakout with 6 times average volume, however the M criteria is now arguing against new buying efforts until a new follow-through day occurs from at least one of the major averages."
Patience Did Not Pay; Fundamental Flaws Prompted Technical Gap Down - Thursday, December 18, 2008
In recent weeks we have taken the opportunity to use this section to revisit some of the previously featured stocks that were dropped some time ago based on technical weakness and fundamental concerns. Studying what happened afterwards should hopefully allow investors to get a better understanding of the importance of having a sell discipline. Limiting losses while they are small is critically important to your success, and this investment system's rule is to always sell a losing stock after it falls more than 7-8% from your buy price. These well-known, high-profile companies serve now as perfect examples that will hopefully allow investors in the future to recognize the warning signs and technical sell signals so they will know when it is time to lock in profits or minimize losses per the investment system's sell rules.
Verifone Holdings Inc (PAY +$0.52 or +11.61% to $5.03) posted a big gain today, but it now faces a tremendous amount of resistance due to overhead supply, making it unlikely to be a market leader in the near term. Serious concerns were raised and noted in CANSLIM.net's 12/03/07 After Market Update (read here) as PAY was one of those unfortunate examples where investors are blindsided. It had gapped down for a considerable loss after the company said it would restate its earnings for the prior three quarters, with the added warning that revelations of deeper problems may follow. Based on the disappointing fundamental news and very weak technical action, it was noted while dropped from the Featured Stocks list. It has traded as much as -91.14% lower since its close on the day it was dropped from the Featured Stocks list.
PAY was first featured at $24.89 on Friday, December 2, 2005 in the CANSLIM.net Mid Day Breakouts Report (read here). However, during 2005 it went through a tough correction below its 50 & 200 DMA lines. After a technical breakout late in the session on 9/25/07, it gapped up and extended its gains, and it was featured once again in yellow in the CANSLIM.net Mid Day Breakouts Report on 9/26/07 (read here). After the damaging gap down, those who may have decided to ride it out as "long term investors" made a huge mistake by ignoring the technical and fundamental warnings that were very clear.
C A N S L I M | StockTalk | News | Chart | SEC | Zacks Reports | ![]()
![]()
![]()
View all notes | Alert me of new notes | CANSLIM.net Company Profile
Technical Breakout To All Time Highs - Wednesday, September 26, 2007
Group action plays a very important role, and experienced investors learn that they can increase their odds of picking a great winner by always focusing their buying efforts in the market's leading groups. The "L" criteria tells us to choose leading companies in leading industry groups, thus it is suggested that investors choose from the top quartile of the 197 Industry Groups (listed in the paper most days on page B4). As is the case in today's example, leadership from other strong stocks in the group can also help to satisfy the "L" criteria.
VeriFone Holdings Inc. (PAY +$2.30 or +5.03% to $43.46) gapped into new high territory today for a second consecutive gain on monstrous volume. The healthy action prompted this high-ranked leader to be featured in yellow in today's CANSLIM.net Mid Day Breakouts Report (read here) with a new $40.10 pivot point and $42.11 maximum buy price. The note read, "Y - It gapped up and is extending the gains after a technical breakout late in the session on 9/25/07. Sales and earnings have been up strong, satisfying the C and A criteria. It may be possible to accumulate shares on a pullback under its max buy price." It is encouraging to see the company earn a healthy Earnings Per Share (EPS) rating of 98 and an admirable Relative Strength (RS) rating of 84. The company has managed to increase its earnings by well above the +25% guideline in the past four quarterly comparisons versus the year earlier, easily satisfying the "C" criteria. PAY resides in the Financial Services- misc group which is currently ranked 89th of out the 197 Industry Groups covered in the paper, placing outside the top quartile, however there are other strong stocks in the group including Checkfree Corporation (CKFR), and Intercontinentalexchange (ICE), that help satisfy the "L" criteria.
This stock was first featured on Friday, December 2nd, 2005 in the CANSLIM.net Mid Day Breakouts Report (read here) at $24.89 as it gapped open after reporting solid quarterly earnings. Then, this stock spent the next few weeks edging higher, but its consolidation grew a bit worrisome in early February as losses on high volume led to a 50 DMA violation. It proved resilient enough at that time to stay near its 50 DMA though, and it eventually gapped higher on March 3rd, 2006 with considerable gains on massive volume. Then, on April 10, 2006 it blasted to yet another new all-time high close with gains on above average volume while it announced the acquisition of a key competitor. It had traded up +34.83% from the price when first featured, but since that time it has failed to make more headway. As the major averages ran into trouble this stock was also dragged lower. After reporting only an +18% earnings increase in the quarter ended April 30th, 2006 its EPS rating subsequently fell to a mediocre 57 rank on the 1-99 scale. Shortly thereafter, this former leader pierced its 50 day moving average line and it also sliced through an important upward trendline, both of which were earlier sell signals noted. That action was discussed on Tuesday July 18, 2006 in the CANSLIM.net After Market Report (read here). The stock spent the next year building a huge base. Its recent healthy action brings this strong leader back into play.
C A N S L I M | StockTalk | News | Chart | ![]() Stock Checkup |
Stock Checkup | ![]() IBD Chart | SEC | Zacks Reports
IBD Chart | SEC | Zacks Reports

View all notes | Alert me of new notes | CANSLIM.net Company Profile
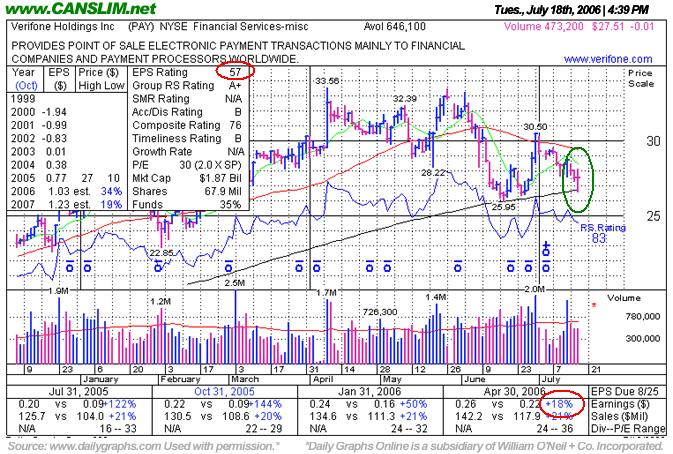
Fundamental Shortcomings Prompt Concern; 200 DMA Line Support Tested Again - Tuesday, July 18, 2006
A very important technical tool that savvy investors have learned to incorporate in their technical analysis is the 200-day moving average (DMA) line. The 200 DMA line plays a pivotal role relative to a stock's price. If the price of a stock is above its 200 DMA then odds are that its 200 DMA will act as longer term support. Conversely, if the price is below its 200 DMA then the moving average acts as resistance. Obviously, if a technical breakdown or violation takes place on heavy volume it is a more serious concern. Sometimes quiet violations are repaired quickly, without a lot of additional losses. However, the key moving averages are always an important line to watch.
VeriFone Holdings Inc. (PAY -$0.01 or -0.04% to $27.51) declined on below average volume today but found support near its 200 DMA and reversed to close off its session's low. The stock was first featured on Friday, December 2nd, 2005 in the CANSLIM.net Mid Day Breakouts Report (read here) at $24.89 as it gapped open after reporting solid quarterly earnings. Then, this stock spent the next few weeks edging higher, but its consolidation grew a bit worrisome in early February as losses on high volume led to a 50 DMA violation. It proved resilient enough at that time to stay near its 50 DMA though, and it eventually gapped higher on March 3rd, 2006 with considerable gains on massive volume. Then, on April 10, 2006 it blasted to yet another new all-time high close with gains on above average volume while it announced the acquisition of a key competitor. It had traded up +34.83% from the price when first featured, but since that time it has failed to make more headway. As the major averages ran into trouble this stock was also dragged lower. After reporting only an +18% earnings increase in the quarter ended April 30th, 2006 its EPS rating subsequently fell to a mediocre 57 rank on the 1-99 scale. CAN SLIM(R) guidelines tell investors to choose companies with at least a +25% increase in earnings and an 80+ EPS rank. Shortly thereafter, this former leader pierced its 50 day moving average line and it also sliced through an important upward trendline, both of which were earlier sell signals noted. The stock also met prompt resistance at its 50 DMA line on the latest rally attempt, and now it is fighting to stay above its longer-term 200 DMA line. If that level is breached then that would be another sell signal, and odds would start favoring that the stock is headed for even lower lows. Meaningful gains back above the 50 DMA and its recent chart high ($30.50) would greatly improve the stock's outlook, however the company's present fundamental shortcomings still make it a questionable buy candidate.
C A N S L I M | StockTalk | News | Chart | SEC | Zacks Reports
View all notes | Alert me of new notes | CANSLIM.net Company Profile
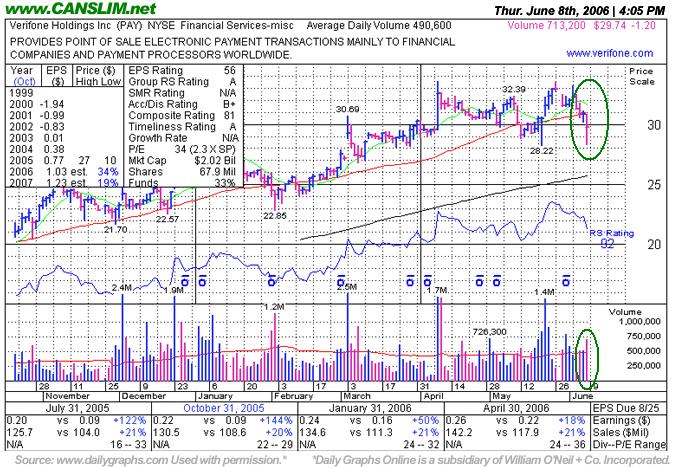
Defense is Important in Stocks When They and the Market Averages Show Shortcomings - Thursday, June 08, 2006
It is not uncommon for leading stocks to pull back after breaking out. Ideally, volume is lighter when the stock retraces back toward a chart support area such as prior chart highs, an upward trend line, or a key moving average such as the 50-day moving average or 200-day moving average. Violations of those technical support levels are a concern, and they are a much greater concern when they occur on higher than average volume. It is especially worrisome when the volume on the down day exceeds the above average volume which had accompanied the prior gains.
VeriFone Holdings Inc. (PAY -$1.06 or -3.43% to $29.88) improved from earlier lows but still closed lower today on above average volume as it sliced through its 50 day moving average (DMA) line. The stock was first featured on Friday, December 2nd, 2005 in the CANSLIM.net Mid Day Breakouts Report (read here) at $24.89 as it gapped open after reporting solid quarterly earnings. Then, this stock spent the next few weeks edging higher, but its consolidation grew a bit worrisome in early February as losses on high volume led to a 50 DMA violation. It proved resilient enough at that time to stay near its 50 DMA though, and it eventually gapped higher on March 3rd, 2006 with considerable gains on massive volume. Then, on April 10, 2006 it blasted to yet another new all-time high close with gains on above average volume while it announced the aquisition of a key competitor, and it had traded up +34.83% from the price when first featured. It has basically moved sideways since, and it has again and again dipped under its 50 DMA, however it has been finding some resolve in the $28-29 range which corresponds with important chart support.
A glance at a weekly chart shows that PAY is currently in a longer-term uptrend that extends back to April 2005. However, arguing for stronger defense is the recent violation of its 50 DMA coupled with the bearish action across the major averages, the "M" in CAN SLIM(R). While a longer term upward trend is still intact, a break under the recent chart low of $28.22 would be yet another clear technical sell signal. It should also be noted that this company's EPS rank fell under the 80+ guideline after its latest financial report showed only a +18% earnings increase, shy of the +25% minimum guideline. This shortcoming was pointed out as a concern in CANSLIM.net's notes from May 24th onward. It even rallied to a new high close on May 25th, but volume was suspiciously absent that day, which adds emphasis to the fact that breakouts need to have meaningful volume to justify buying them.
C A N S L I M | StockTalk | News | Chart | SEC | Zacks Reports
View all notes | Alert me of new notes | CANSLIM.net Company Profile |
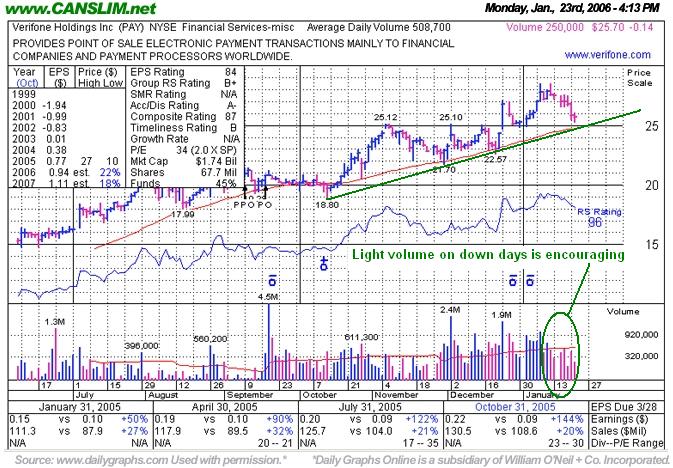
Another Leader Near a Test of Upward Trend Line - Monday, January 23, 2006
VeriFone Holdings Inc. (PAY -$0.14 or -0.54% to $25.70) ended in the middle of its range on below average volume today. This issue came public in May 2005 at $10.00 a share. Since then, this issue has been steadily advancing. PAY was recently featured on December 2nd, 2005 in the CANSLIM.net's Mid-Day Breakouts Report as it gapped higher on nearly 4 times average turnover (read here). Over the past several months, this issue has developed an upward trendline with the lower boundary coinciding with its 50 DMA line. This makes the $25 range a critical chart support level, especially due to the fact that level was a resistance level in November-December '05. The stock's recent losses have come on only average or less than average volume, however it would be considered a technical sell signal if this support level were breached.
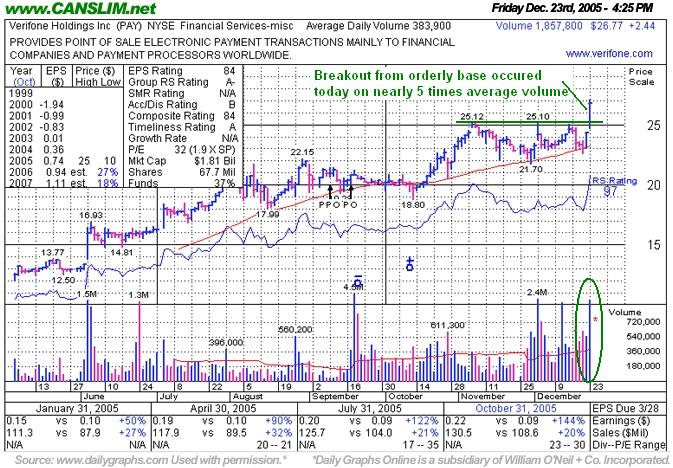
Ideal Candidate Breaks Out Today - Friday, December 23, 2005
Leading stocks that are highlighted in CANSLIM.net's Mid-Day BreakOuts Report are often setting up to potentially breakout of a solid base if they have not already cleared their pivot point and triggered a technical buy signal. Relevant factors are noted in the report which can give members a decent starting point, and it is a prudent time for CAN SLIM(TM) oriented investors to do their own research and perhaps place that issue on their watch list. After doing the necessary backup research, discipined investors sit prepared to act if and when the stock triggers a technical buy signal (breaks above its pivot point on more than +50% average turnover). In the event the stock fails to trigger a technical buy signal and its price declines, then it will simply be removed from the watch list.
VeriFone Holdings Inc. (PAY +$2.54 or +8.66% to $26.79) was featured on December 2nd, 2005 in the CANSLIM.net Mid-Day Breakouts Report (read here) as it gapped up and was approaching its pivot point. The stock spent the next three weeks basing until it exploded out of its base today, Friday, December 23rd, 2005 with a gap up and considerable gain on massive volume. CANSLIM.net members with patience and discipline had this stock on their watch list and were ready to act as it blasted above its pivot point today on volume well above the minimum guideline of +50% above average volume, trading nearly five times its average daily volume total. Caution quickly becomes warranted, however, as the stock's rapid rise led it to close the session more than +5% above the pivot point or beyond "max buy" price.