Bank Recently Sputtering Below its 50-Day Moving Average - Wednesday, October 10, 2018
Old Second Bancorp Inc (OSBC -$0.13 or -0.86% to $15.01) has recently been sputtering below its 50-day moving average (DMA) line ($15.34). A rebound above the 50 DMA line is needed for its outlook to improve. Prior lows and its 200 DMA line define additional near-term support. Its Relative Strength Rating is 78, below the 80+ minimum guideline for buy candidates.
OSBC met stubborn resistance after hitting a new high on 7/26/18 with a big volume-driven gain. Fundamentals remain strong.
OSBC was last shown in this FSU section on 8/23/18 with an annotated graph under the headline, "Bank Perched Less Than -5% Off Record High". It was highlighted in yellow with pivot point cited based on prior highs plus 10 cents in the 5/21/18 mid-day report (read here).
Fundamentals remain strong after it reported Jun '18 quarterly earnings +71% on +23% sales revenues.marking its 6th consecutive quarterly comparison with earnings above the +25% minimum guideline (C criteria). Annual earnings history has been a good match with the fact-based investment system's guidelines (A criteria).
The number of top-rated funds owning its shares rose from 166 in Jun '17 to 185 in Jun '18, a reassuring sign concerning the I criteria. Its current Up/Down Volume Ratio of 1.2 is an unbiased indication its shares have been under slight accumulation over the past 50 days. There are only 28.6 million shares (S criteria) in the public float, which can contribute to greater price volatility in the event of institutional buying or selling. Leadership in other Bank stocks is a reassuring sign concerning the L criteria.
Charts courtesy of www.stockcharts.com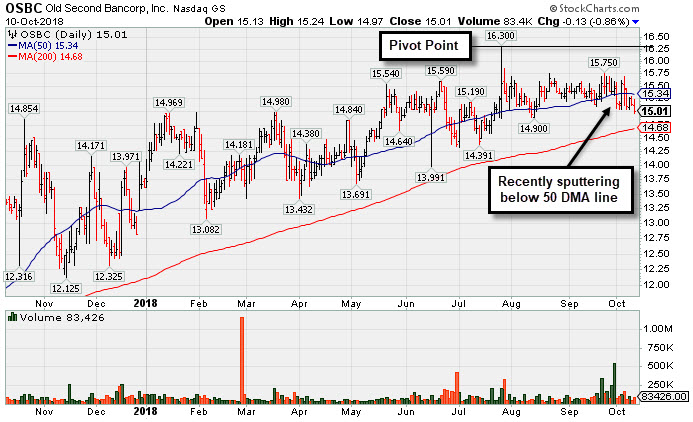
Bank Perched Less Than -5% Off Record High - Thursday, August 23, 2018
Old Second Bancorp Inc (OSBC -$0.10 or -0.64% to $15.55) is consolidating above its 50-day moving average (DMA) line ($15.10) while the prior low ($14) and 200 DMA line define additional near-term support. It met stubborn resistance after hitting a new high on 7/26/18 with a big volume-driven gain. Its Relative Strength Rating has slumped to 78, below the 80+ minimum guideline for buy candidates, however, it remains perched only -4.6% off its all-time high with very little resistance remaining due to overhead supply.
OSBC was last shown in this FSU section on 7/09/18 with an annotated graph under the headline, "Consolidating Above 50-Day Moving Average". It was highlighted in yellow with pivot point cited based on prior highs plus 10 cents in the 5/21/18 mid-day report (read here). It hit a new 52-week high with a big gain backed by +60% above average volume triggering a technical buy signal. It found support above its 200 DMA line during its long and orderly consolidation.
Fundamentals remain strong after it reported Jun '18 quarterly earnings +71% on +23% sales revenues.marking its 6th consecutive quarterly comparison with earnings above the +25% minimum guideline (C criteria). Annual earnings history has been a good match with the fact-based investment system's guidelines (A criteria).
The number of top-rated funds owning its shares rose from 166 in Jun '17 to 183 in Jun '18, a reassuring sign concerning the I criteria. Its current Up/Down Volume Ratio of 0.9 is an unbiased indication its shares have been under slight distributional pressure over the past 50 days. There are only 28.6 million shares (S criteria) in the public float, which can contribute to greater price volatility in the event of institutional buying or selling. Leadership in other Bank stocks is a reassuring sign concerning the L criteria.
Charts courtesy of www.stockcharts.com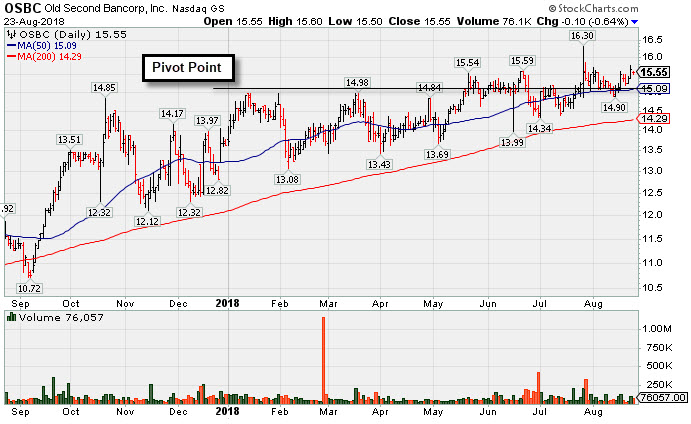
Consolidating Above 50-Day Moving Average - Monday, July 9, 2018
Old Second Bancorp Inc (OSBC +$0.15 or +1.00% to $15.10) volume was higher behind today's gain but totals have been light while recently consolidating near its 50-day moving average (DMA) line ($14.87). Its prior low ($14) and 200 DMA line define the next important support level.
It stalled after last shown in this FSU section on 5/21/18 with an annotated graph under the headline, "Hit New High Today After Orderly Consolidation". It was highlighted in yellow with pivot point cited based on prior highs plus 10 cents in the earlier mid-day report (read here). It hit a new 52-week high with a big gain backed by +60% above average volume triggering a technical buy signal. It found support above its 200 DMA line during its long and orderly consolidation.
Fundamentals remain strong. Recently it reported earnings +69% on +15% sales revenues for the Mar '18 quarter, marking its 5th consecutive quarterly comparison with earnings above the +25% minimum guideline (C criteria). Annual earnings history has been a good match with the fact-based investment system's guidelines (A criteria).
The number of top-rated funds owning its shares rose from 166 in Jun '17 to 178 in Mar '18, a reassuring sign concerning the I criteria. Its current Up/Down Volume Ratio of 0.8 is an unbiased indication its shares have been under distributional pressure over the past 50 days. There are only 28.6 million shares (S criteria) in the public float, which can contribute to greater price volatility in the event of institutional buying or selling. Leadership in other Bank stocks is a reassuring sign concerning the L criteria.
Charts courtesy of www.stockcharts.com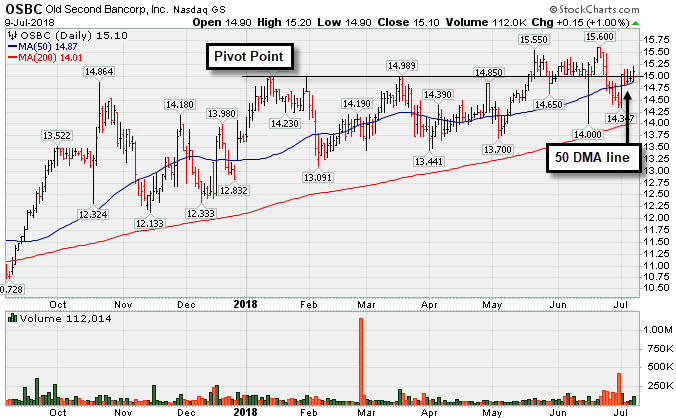
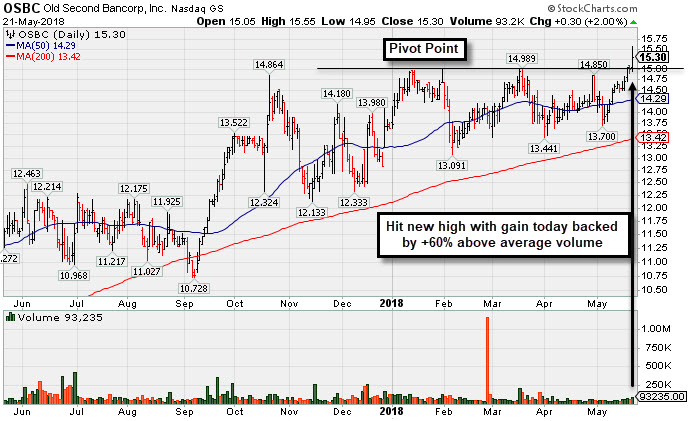
Hit New High Today After Orderly Consolidation - Monday, May 21, 2018
Old Second Bancorp Inc (OSBC +$0.30 or +2.00% to $15.30) was highlighted in yellow with pivot point cited based on prior highs plus 10 cents in the earlier mid-day report (read here). It hit a new 52-week high with today's big gain backed by +60% above average volume triggering a technical buy signal. It found support above its 200 DMA line during its long and orderly consolidation.
Recently it reported earnings +69% on +15% sales revenues for the Mar '18 quarter, marking its 5th consecutive quarterly comparison with earnings above the +25% minimum guideline (C criteria). Annual earnings history has been a good match with the fact-based investment system's guidelines (A criteria).
The number of top-rated funds owning its shares rose from 166 in Jun '17 to 175 in Mar '18, a reassuring sign concerning the I criteria. Its current Up/Down Volume Ratio of 1.3 is an unbiased indication its shares have been under modest accumulation over the past 50 days. There are only 28.5 million shares (S criteria) in the public float, which can contribute to greater price volatility in the event of institutional buying or selling. Leadership in other Bank stocks is a reassuring sign concerning the L criteria. .
Charts courtesy of www.stockcharts.com