There are no featured stock write-ups on NVEE proir to 2/17/2025
 Upgrade your membership to see all of the expert analysis we have published on NVEE now!
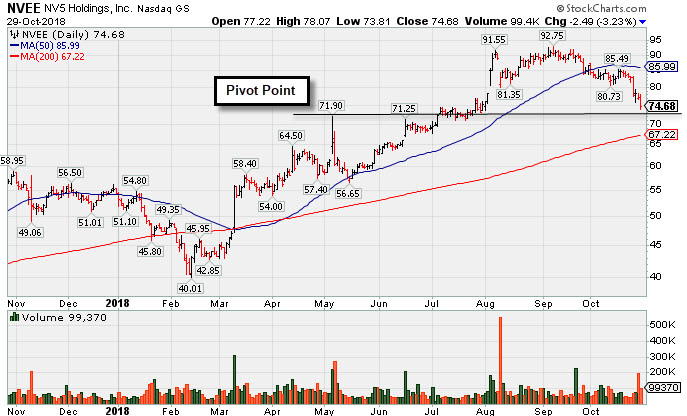
Slumped Further With Losses Backed by Above Average Volume - Monday, October 29, 2018
N V 5 Global Inc (NVEE -$2.49 or -3.23% to $74.68) churned above average volume again today as it suffered another damaging loss. It will be dropped from the Featured Stocks list tonight. A rebound above the 50-day moving average (DMA) line ($85.99) is needed for its outlook to improve.
NVEE priced a new Public Offering on 8/09/18. Such offerings often hinder near-term price progress, yet they tend to attract greater institutional ownership interest. It was last shown in this FSU section on 10/08/18 with an annotated graph under the headline, "Recently Slumped Below 50-Day Moving Average Line". It was highlighted in yellow with new pivot point cited based on its 10/31/17 high plus 10 cents in the 4/09/18 mid-day report (read here).
Recently it reported earnings +63% on +24% sales revenues for the Jun '18 quarter, continuing its strong earnings track record with the 5th quarter in a row above the +25% minimum earnings guideline (C criteria) of the fact-based investment system. Its strong annual earnings (A criteria) history was previously noted.
This Hollywood, FL based Commercial Services / Consulting firm completed new Public Offerings on 5/22/15 and on 5/13/16. Today there still are only 12.6 million shares outstanding (S criteria), which can contribute to greater price volatility in the event of institutional buying or selling. The number of top-rated funds owning its shares rose from 186 in Jun '17 to to 242 in Sep '18, a reassuring sign concerning the I criteria.
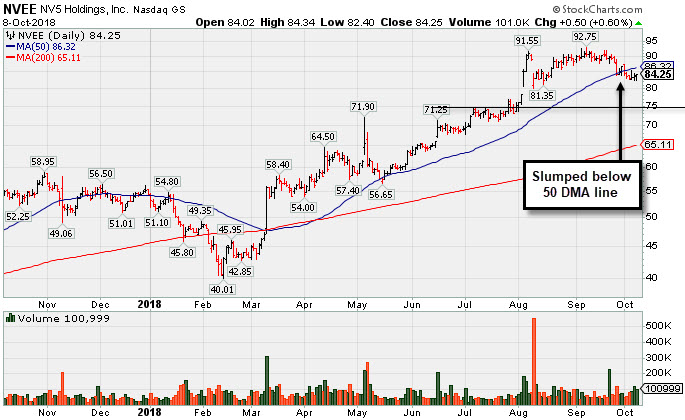
Recently Slumped Below 50-Day Moving Average Line - Monday, October 8, 2018
N V 5 Global Inc (NVEE +$0.50 or +0.60% to $84.25) has been recently sputtering below its 50-day moving average (DMA) line ($86.32). Only a prompt rebound above the 50 DMA line would help its outlook improve. Prior highs in the $74 area define near-term support to watch. It still remains perched only -9.2% off its all-time high.
NVEE priced a new Public Offering on 8/09/18 Such offerings often hinder near-term price progress, yet they tend to attract greater institutional ownership interest. It was last shown in this FSU section on 8/21/18 with an annotated graph under the headline, "Remains Perched Near All-Time High Following Offering". It was highlighted in yellow with new pivot point cited based on its 10/31/17 high plus 10 cents in the 4/09/18 mid-day report (read here).
Recently it reported earnings +63% on +24% sales revenues for the Jun '18 quarter, continuing its strong earnings track record with the 5th quarter in a row above the +25% minimum earnings guideline (C criteria) of the fact-based investment system. Its strong annual earnings (A criteria) history was previously noted.
This Hollywood, FL based Commercial Services / Consulting firm completed new Public Offerings on 5/22/15 and on 5/13/16. Today there still are only 12.6 million shares outstanding (S criteria), which can contribute to greater price volatility in the event of institutional buying or selling. The number of top-rated funds owning its shares rose from 186 in Jun '17 to to 237 in Jun '18, a reassuring sign concerning the I criteria.
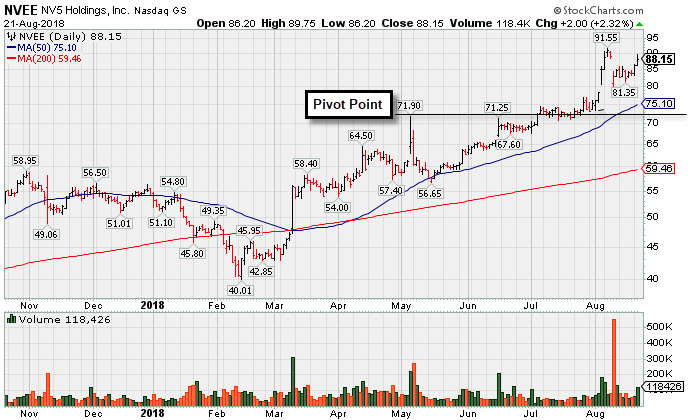
Remains Perched Near All-Time High Following Offering - Tuesday, August 21, 2018
N V 5 Global Inc (NVEE +$2.00 or +2.32% to $88.15) still remains perched near its all-time high. It priced a new Public Offering and gapped down on 8/09/18, yet it remains well above its 50-day moving average (DMA) line ($75.10) and prior highs in the $71 area which define near-term support to watch. Such offerings often hinder near-term price progress, yet they tend to attract greater institutional ownership interest.
It has shown moistly bullish action since last shown in this FSU section on 6/28/18 with an annotated graph under the headline, "Holding its Ground in Tight Range Near All-Time High "
. It was highlighted in yellow with new pivot point cited based on its 10/31/17 high plus 10 cents in the 4/09/18 mid-day report (read here).
Recently it reported earnings +63% on +24% sales revenues for the Jun '18 quarter, continuing its strong earnings track record with the 5th quarter in a row above the +25% minimum earnings guideline (C criteria) of the fact-based investment system. Its strong annual earnings (A criteria) history was previously noted.
This Hollywood, FL based Commercial Services / Consulting firm completed new Public Offerings on 5/22/15 and on 5/13/16. Today there still are only 12.3 million shares outstanding (S criteria), which can contribute to greater price volatility in the event of institutional buying or selling. The number of top-rated funds owning its shares rose from 186 in Jun '17 to to 221 in Jun '18, a reassuring sign concerning the I criteria.
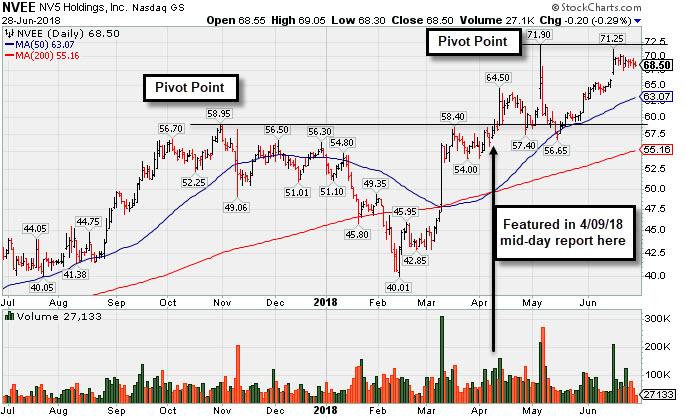
Holding its Ground in Tight Range Near All-Time High - Thursday, June 28, 2018
N V 5 Global Inc (NVEE -$0.20 or -0.29% to $68.50) is still holding its ground in a tight range perched near its all-time high. Confirming gains above the new pivot point cited must be backed by at least +40% above average volume to trigger a proper new (or add-on) technical buy signal. Its 50-day moving average (DMA) line ($63.07) defines near-term support above the prior low ($56.65 on 5/15/18). It was last shown in this FSU section on 5/11/18 with an annotated graph under the headline, "Encountered Distributional Pressure After Hitting New High". It was highlighted in yellow with new pivot point cited based on its 10/31/17 high plus 10 cents in the 4/09/18 mid-day report (read here).
Recently it reported earnings +51% on +48% sales revenues for the Mar '18 quarter, continuing its strong earnings track record witrh the 4th quarter in a row above the +25% minimum earnings guideline (C criteria) of the fact-based investment system. Its strong annual earnings (A criteria) history was previously noted.
This Hollywood, FL based Commercial Services / Consulting firm completed new Public Offerings on 5/22/15 and on 5/13/16, and none since. There are only 11 million shares outstanding (S criteria), which can contribute to greater price volatility in the event of institutional buying or selling. The number of top-rated funds owning its shares rose from 186 in Jun '17 to to 213 in Mar '18, a reassuring sign concerning the I criteria.
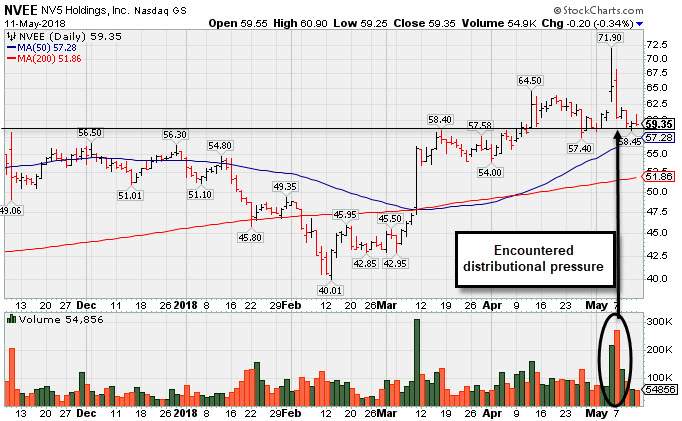
Encountered Distributional Pressure After Hitting New High - Friday, May 11, 2018
N V 5 Global Inc (NVEE -$0.20 or -0.34% to $59.35) encountered distributional pressure recently, pulling back near prior highs defining initial support in the $58-59 area. Its 50-day moving average (DMA) line ($57.28) defines important ner-term support to watch on pullbacks.
Recently it reported earnings +51% on +48% sales revenues for the Mar '18 quarter, continuing its strong earnings track record witrh the 4th quarter in a row above the +25% minimum earnings guideline (C criteria) of the fact-based investment system. Its strong annual earnings (A criteria) history was previously noted.. NVEE was last shown in this FSU section on 4/09/18 with an annotated graph under the headline, "Perched Near High After 3 Strong Quarterly Comparisons". It was highlighted in yellow with new pivot point cited based on its 10/31/17 high plus 10 cents in the earlier mid-day report (read here).
This Hollywood, FL based Commercial Services / Consulting firm completed new Public Offerings on 5/22/15 and on 5/13/16, and none since. There are only 11 million shares outstanding (S criteria), which can contribute to greater price volatility in the event of institutional buying or selling. The number of top-rated funds owning its shares rose from 186 in Jun '17 to to 206 in Mar '18, a reassuring sign concerning the I criteria.
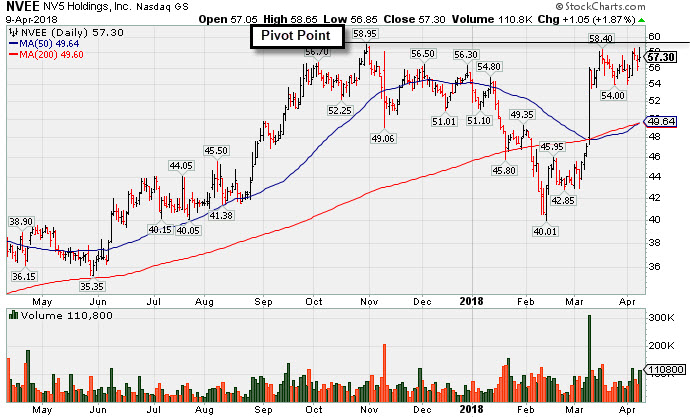
Perched Near High After 3 Strong Quarterly Comparisons - Monday, April 9, 2018
N V 5 Global Inc (NVEE +$1.05 or +1.87% to $57.30) was highlighted in yellow with new pivot point cited based on its 10/31/17 high plus 10 cents in the earlier mid-day report (read here). Subsequent gains for a new all-time high backed by at least +40% above average volume may trigger a technical buy signal. Disciplined investors know that the M criteria argues against any new buying efforts unless a rally has been confirmed.
This Hollywood, FL based Commercial Services / Consulting firm reported earnings +83% on +49% sales revenues for the Dec '17 quarter, its 3rd strong quarter in a row above the +25% minimum earnings guideline (C criteria)of the fact-based investment system. Its strong annual earnings (A criteria) history was previously noted.
It completed new Public Offerings on 5/22/15 and on 5/13/16, and none since. There are only 10.8 million shares outstanding (S criteria), which can contribute to greater price volatility in the event of institutional buying or selling.
The number of top-rated funds owning its shares rose from 188 in Jun '17 to to 206 in Mar '18, a reassuring sign concerning the I criteria. NVEE was first highlighted with a pivot point based on its 12/02/15 high in the 3/14/16 mid-day report (read here) and then finished strong and triggered a technical buy signal while rising from an 8-month double bottom base with +142% above average volume.
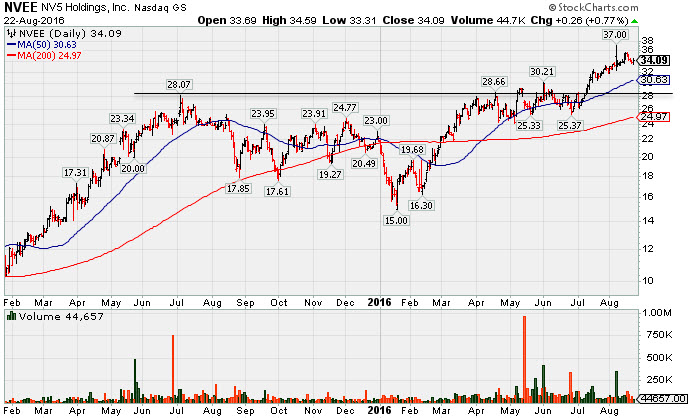
Technically Strong Despite Fundamental Concerns - Monday, August 22, 2016
N V 5 Global Inc (NVEE +$0.26 or +0.77% to $34.09) remains perched near all-time highs after recently wedging higher. Its 50-day moving average (DMA) line and prior highs define important near-term support where violations would raise concerns and trigger technical sell signals. Recently it reported earnings +23% on +62% sales revenues, below the +25% minimum earnings guideline (C criteria), raising concerns. Prior quarterly earnings comparisons had been mostly above the +25% minimum guideline (C criteria) of the fact-based investment system. Its strong annual earnings (A criteria) history was noted.
NVEE was last shown in this FSU section on 7/18/16 with an annotated graph under the headline, "Winning Streak Leaves Leader Extended From Prior Base Pattern". No resistance due to overhead supply, but it is extended more than +5% above its prior high or pivot point. Disciplined investors avoid chasing extended stocks. It completed a new Public Offering on 5/13/16. Members were cautioned - "Such offerings often hinder near-term price progress yet help companies to attract more institutional owners (I criteria). Remember that any stock that was previously sold can be bought again when strength returns."
The number of top-rated funds owning its shares rose from 13 in Mar '15 to to 140 in Jun '16, a reassuring sign concerning the I criteria. It completed a new Public Offering on 5/22/15. NVEE was first highlighted with a pivot point based on its 12/02/15 high in the 3/14/16 mid-day report (read here) and then finished strong and triggered a technical buy signal while rising from an 8-month double bottom base with +142% above average volume.
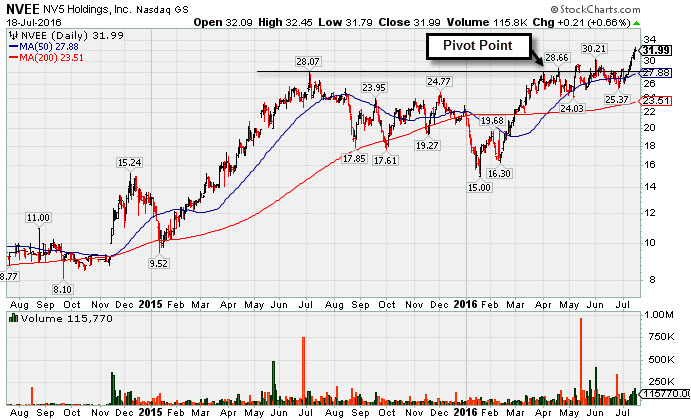
Winning Streak Leaves Leader Extended From Prior Base Pattern - Monday, July 18, 2016
N V 5 Global Inc (NVEE +$0.21 or +0.66% to $31.99) is perched at a new all-time high with above average volume behind its 10th gain in an impressive streak of gains into new high territory. No resistance due to overhead supply, but it is extended more than +5% above its prior high or pivot point. Disciplined investors avoid chasing extended stocks. Its 50-day moving average (DMA) line ($27.88) and recent lows in the $24-25 area define near-term support to watch.
NVEE was last shown in this FSU section on 6/30/16 with an annotated graph under the headline, "Perched Near Highs After Rebound Above 50-Day Average". It completed a new Public Offering on 5/13/16. Members were cautioned - "Such offerings often hinder near-term price progress yet help companies to attract more institutional owners (I criteria). Remember that any stock that was previously sold can be bought again when strength returns."
The high-ranked Commercial Services - Consulting firm will announce its financial results for the second quarter ended June 30, 2016 on Thursday, August 4, 2016, following the close of the markets. It reported earnings +39% on +54% sales revenues for the Mar '16 quarter, continuing its strong earnings track record. It reported earnings +32% on +47% sales revenues for the Dec '15 quarter and prior quarterly earnings comparisons have been mostly above the +25% minimum guideline (C criteria). Its strong annual earnings (A criteria) history helps it match the fundamental guidelines of the fact-based investment system.
The number of top-rated funds owning its shares rose from 13 in Mar '15 to to 130 in Jun '16, a reassuring sign concerning the I criteria. It completed a new Public Offering on 5/22/15. NVEE was first highlighted with a pivot point based on its 12/02/15 high in the 3/14/16 mid-day report (read here) and then finished strong and triggered a technical buy signal while rising from an 8-month double bottom base with +142% above average volume.
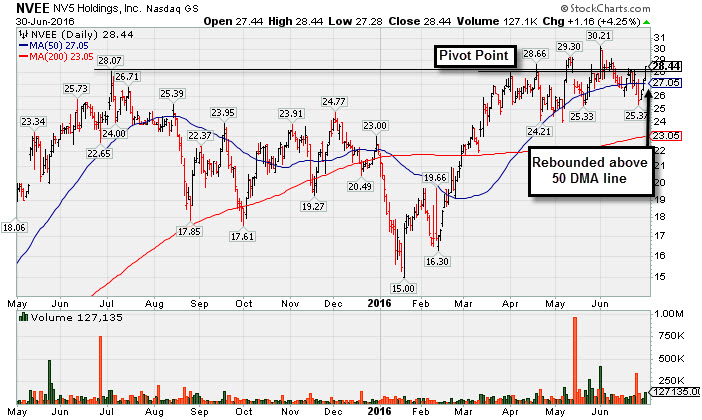
Perched Near Highs After Rebound Above 50-Day Average - Thursday, June 30, 2016
N V 5 Global Inc (NVEE +$1.16 or +4.25% to $28.44) has rebounded above its 50-day moving average (DMA) line and now faces little resistance due to overhead supply. On any pullbacks the recent lows in the $24 area define the important support to watch.
NVEE was last shown in this FSU section on 5/31/16 with an annotated graph under the headline, "Consolidating Near Highs After Completing New Public Offering". It completed a new Public Offering on 5/13/16. Members were cautioned - "Such offerings often hinder near-term price progress yet help companies to attract more institutional owners (I criteria). Remember that any stock that was previously sold can be bought again when strength returns."
The high-ranked Commercial Services - Consulting firm reported earnings +39% on +54% sales revenues for the Mar '16 quarter, continuing its strong earnings track record. It reported earnings +32% on +47% sales revenues for the Dec '15 quarter and prior quarterly earnings comparisons have been mostly above the +25% minimum guideline (C criteria). Its strong annual earnings (A criteria) history helps it match the fundamental guidelines of the fact-based investment system. The number of top-rated funds owning its shares rose from 13 in Mar '15 to to 124 in Mar '16, a reassuring sign concerning the I criteria. It completed a new Public Offering on 5/22/15.
It was first highlighted with a pivot point based on its 12/02/15 high in the 3/14/16 mid-day report (read here) and then finished strong and triggered a technical buy signal while rising from an 8-month double bottom base with +142% above average volume.
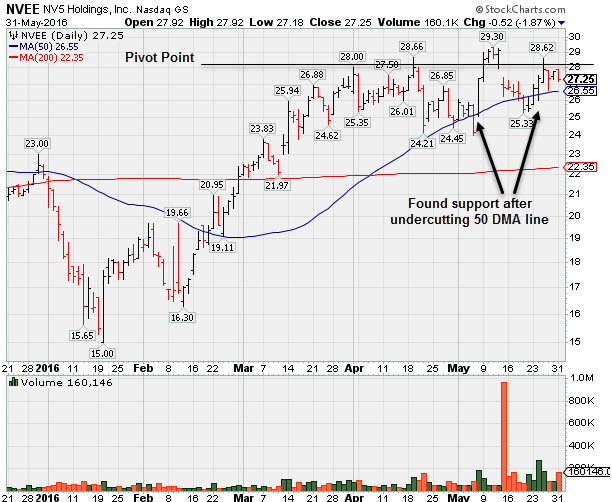
Consolidating Near Highs After Completing New Public Offering - Tuesday, May 31, 2016
N V 5 Global Inc (NVEE -$0.52 or -1.87% to $27.25) fell with higher volume, encountered more distributional pressure today while consolidating above its 50-day moving average (DMA) line. It remains perched within striking distance of its 52-week high. It completed a new Public Offering on 5/13/16. Members were cautioned - "Such offerings often hinder near-term price progress yet help companies to attract more institutional owners (I criteria)." Remember that any stock that was previously sold can be bought again when strength returns.
NVEE was last shown in this FSU section on 5/10/16 with an annotated graph under the headline, "Less Volume Behind Gain For Another New High". It found prompt support after violating its 50-day moving average (DMA) line on 5/05/16 triggering a sell signal and raising concerns. It encountered distributional pressure after barely reaching new 52-week and all-time highs, then the prompt rebound above the 50 DMA line came after reporting earnings +39% on +54% sales revenues for the Mar '16 quarter, continuing its strong earnings track record.
The high-ranked Commercial Services - Consulting firm was first highlighted with a pivot point based on its 12/02/15 high in the 3/14/16 mid-day report (read here) and then finished strong and triggered a technical buy signal while rising from an 8-month double bottom base with +142% above average volume.
It completed a new Public Offering on 5/22/15. They reported earnings +32% on +47% sales revenues for the Dec '15 quarter. Prior quarterly earnings comparisons have been mostly above the +25% minimum guideline (C criteria), and its strong annual earnings (A criteria) history helps it match the fundamental guidelines of the fact-based investment system. The number of top-rated funds owning its shares rose from 13 in Mar '15 to to 123 in Mar '16, a reassuring sign concerning the I criteria.
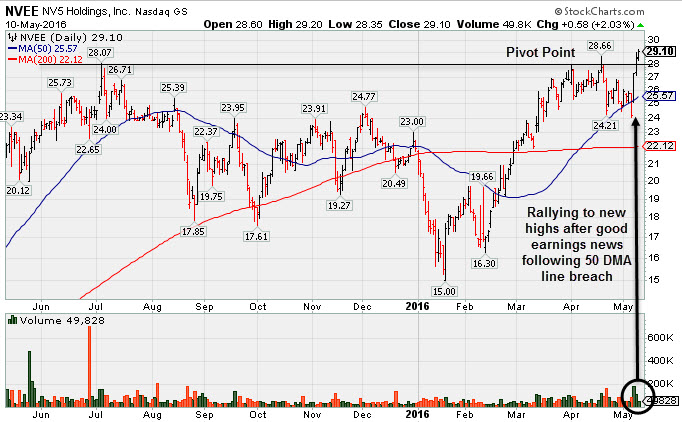
Less Volume Behind Gain For Another New High - Tuesday, May 10, 2016
N V 5 Global Inc (NVEE +$0.58 or +2.03% to $29.10) had lighter volume today after 2 prior volume-driven gains helped it rallying for new 52-week highs. It found prompt support after violating its 50-day moving average (DMA) line triggering a sell signal and raising concerns last week. It encountered distributional pressure after barely reaching new 52-week and all-time highs, then the prompt rebound above the 50 DMA line came after reporting earnings +39% on +54% sales revenues for the Mar '16 quarter, continuing its strong earnings track record.
Remember that any stock that was previously sold can be bought again when strength returns. NVEE was last shown in this FSU section on 4/20/16 with an annotated graph under the headline, "Met Resistance When Poised to Breakout From Longer Base Pattern". Its color code was changed to yellow with a new pivot point cited based on its 4/01/16 high plus 10 cents. It was noted - "A convincing close above the pivot point in new all-time high territory may signal the beginning of a meaningful advance."
The high-ranked Commercial Services - Consulting firm was first highlighted with a pivot point based on its 12/02/15 high in the 3/14/16 mid-day report (read here) and then finished strong and triggered a technical buy signal while rising from an 8-month double bottom base with +142% above average volume.
It completed a new Public Offering on 5/22/15. They reported earnings +32% on +47% sales revenues for the Dec '15 quarter. Prior quarterly earnings comparisons have been mostly above the +25% minimum guideline (C criteria), and its strong annual earnings (A criteria) history helps it match the fundamental guidelines of the fact-based investment system. The number of top-rated funds owning its shares rose from 13 in Mar '15 to to 122 in Mar '16. Its current Up/Down Volume Ratio of 1.7 is an unbiased sign of institutional buying demand over the past 50 days, another reassuring sign concerning the I criteria.
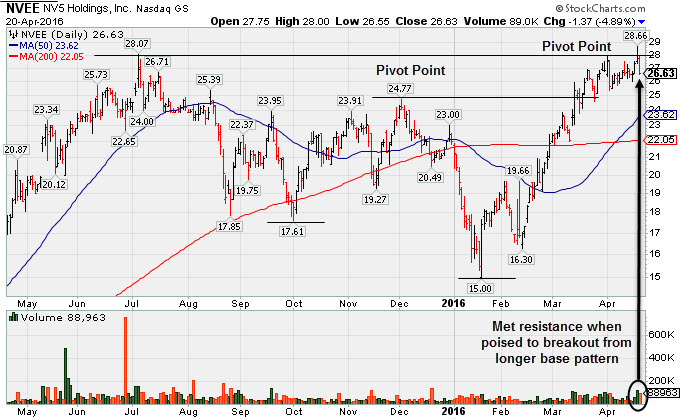
Met Resistance When Poised to Breakout From Longer Base Pattern - Wednesday, April 20, 2016
N V 5 Global Inc (NVEE -$1.37 or -4.89% to $26.63) fell today with nearly twice its average volume behind the loss, contrasting with bullish gains from the major averages. It encountered distributional pressure after reaching new 52-week and all-time highs with a volume-driven gain on the prior session. Its color code was changed to yellow with a new pivot point cited based on its 4/01/16 high plus 10 cents. It was noted - "A convincing close above the pivot point in new all-time high territory may signal the beginning of a meaningful advance."
The high-ranked Commercial Services - Consulting firm stubbornly held its ground yet it made limited progress from from the previously cited "double bottom" base pattern. It was first highlighted with a pivot point based on its 12/02/15 high in the 3/14/16 mid-day report (read here) and then finished strong and triggered a technical buy signal while rising from an 8-month double bottom base with +142% above average volume.
It completed a new Public Offering on 5/22/15. They reported earnings +32% on +47% sales revenues for the Dec '15 quarter. Prior quarterly earnings comparisons have been mostly above the +25% minimum guideline (C criteria), and its strong annual earnings (A criteria) history helps it match the fundamental guidelines of the fact-based investment system. The number of top-rated funds owning its shares rose from 13 in Mar '15 to to 122 in Mar '16. Its current Up/Down Volume Ratio of 2.4 is an unbiased sign of institutional buying demand over the past 50 days, another reassuring sign concerning the I criteria.
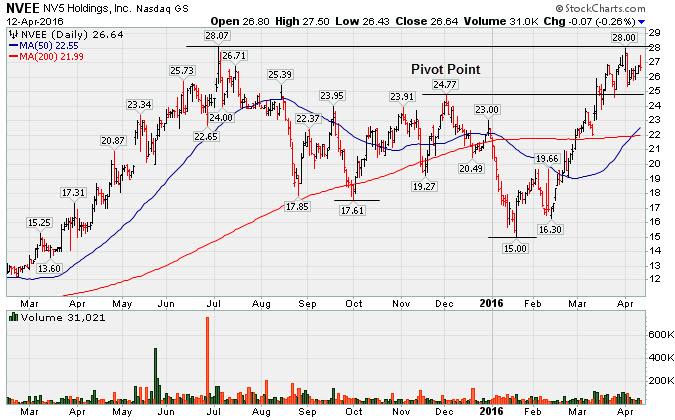
Perched Near 52-Week High Following Recent Breakout - Tuesday, April 12, 2016
N V 5 Global Inc (NVEE -$0.07 or -0.26% to $26.64) erased an early gain today and finished at the session low for a small loss on lighter volume. It is perched within striking distance of a new 52-week and all-time high. It has been consolidating near its "max buy" level after rising from the previously cited base pattern.
It was last shown in this FSU section on 3/23/16 with an annotated graph under the headline, "Pullback Had Light Volume After Getting Extended From Prior Base", retreating back below its "max buy" level. It was highlighted with a pivot point based on its 12/02/15 high in the 3/14/16 mid-day report (read here) and then finished strong and triggered a technical buy signal while rising from an 8-month double bottom base with +142% above average volume.
Subsequent volume-driven gains into new high territory may signal that more serious institutional buying demand is still lurking and could mark the beginning of another substantial leg up in price, however, a new pivot point has not been cited.It completed a new Public Offering on 5/22/15. Reported earnings +32% on +47% sales revenues for the Dec '15 quarter. Prior quarterly earnings comparisons have been mostly above the +25% minimum guideline (C criteria), and its strong annual earnings (A criteria) history helps it match the fundamental guidelines of the fact-based investment system. The number of top-rated funds owning its shares rose from 13 in Mar '15 to to 121 in Mar '16. Its current Up/Down Volume Ratio of 1.9 is an unbiased sign of institutional buying demand over the past 50 days, another reassuring sign concerning the I criteria.
Charts courtesy www.stockcharts.com
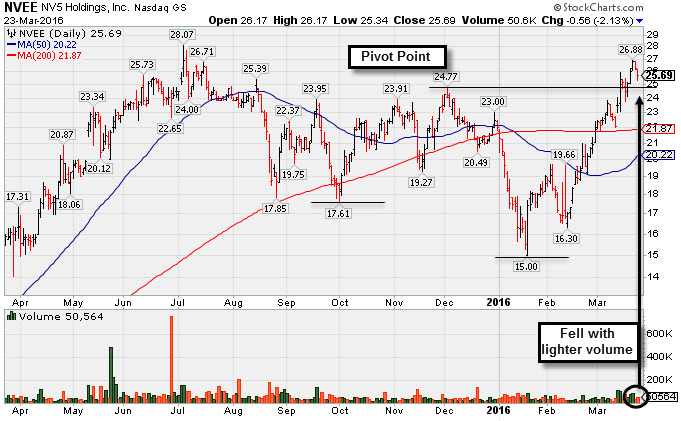
Pullback Had Light Volume After Getting Extended From Prior Base - Wednesday, March 23, 2016
N V 5 Global Inc (NVEE -$0.56 or -2.13% to $25.69) pulled back with lighter volume and its color code was changed to yellow after retreating back below its "max buy" level. It was highlighted with a pivot point based on its 12/02/15 high in the 3/14/16 mid-day report (read here) and then finished strong and triggered a technical buy signal while rising from an 8-month double bottom base with +142% above average volume. Subsequent volume-driven gains into new high territory may signal that more serious institutional buying demand is still lurking and could mark the beginning of another substantial leg up in price. However, disciplined investors avoid chasing stocks more than +5% above their prior high or pivot point.
It completed a new Public Offering on 5/22/15. Reported earnings +32% on +47% sales revenues for the Dec '15 quarter. Prior quarterly earnings comparisons have been mostly above the +25% minimum guideline (C criteria), and its strong annual earnings (A criteria) history helps it match the fundamental guidelines of the fact-based investment system. The number of top-rated funds owning its shares rose from 13 in Mar '15 to to 119 in Dec '15, a reassuring sign concerning the I criteria.
Charts courtesy www.stockcharts.com
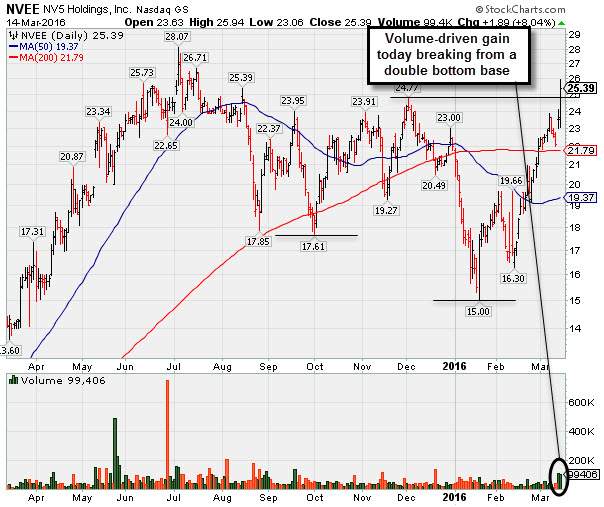
Finished Strong After Highlighted in Mid-Day Report - Monday, March 14, 2016
N V 5 Global Inc (NVEE +$1.89 or +8.04% to $25.39) finished strong and triggered a technical buy signal while rising from an 8-month double bottom base with +142% above average volume. It was highlighted in yellow with pivot point cited based on its 12/02/15 high in the earlier mid-day report (read here). It completed a new Public Offering on 5/22/15. Reported earnings +32% on +47% sales revenues for the Dec '15 quarter. Prior quarterly earnings comparisons have been mostly above the +25% minimum guideline (C criteria), and its strong annual earnings (A criteria) history helps it match the fundamental guidelines of the fact-based investment system.
The number of top-rated funds owning its shares rose from 13 in Mar '15 to to 119 in Dec '15, a reassuring sign concerning the I criteria. Subsequent volume-driven gains into new high territory may signal that more serious institutional buying demand is still lurking and could mark the beginning of another substantial leg up in price.