Technical Breakdown Followed By Weaker Fundamentals - Friday, November 13, 2009
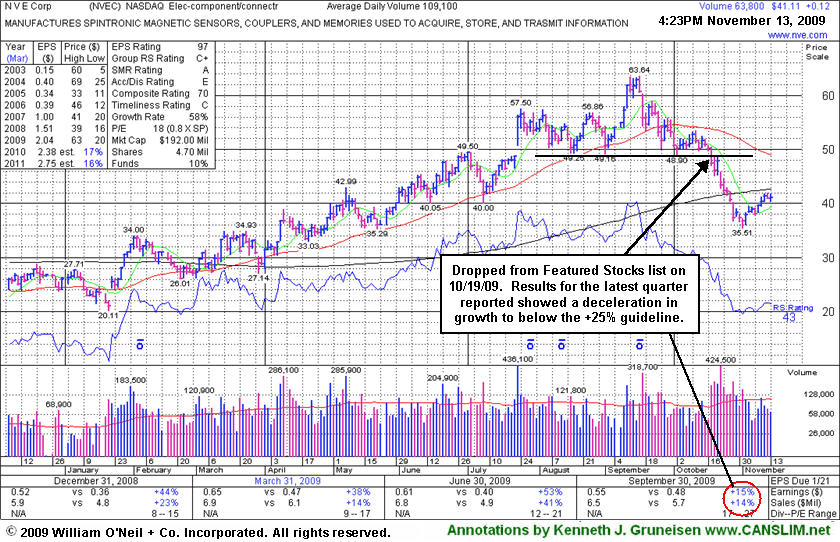
NVE Corp (NVEC +$0.12 or +0.29% to $41.11) is not currently included on the CANSLIM.net Featured Stocks list, however it could be constructive to look at it again for any lessons that can be learned. It was dropped on October 19th after triggering technical sell signals which were summarized with an annotated graph under the headline, "Weak Technical Action Is A Worrisome Sign". At that time we observed, "The weak technical action is a worrisome sign, even though NVEC still has maintained a good quarterly and annual earnings growth history (C & A criteria)." However, since that time you can see that the comparison for the quarter ended September 30, 2009 showed increases below the +25% guideline. This demonstrates how, as so often is the case, technical action in a stock is commonly followed by fundamental news that sheds light after the fact on the stock's behavior.
The high-ranked leader in the Electronics - Components/Connectors group had traded up as much as +88% after first being featured in yellow at $33.85 on 3/13/09 in the mid-day report (read here).
Weak Technical Action Is A Worrisome Sign - Monday, October 19, 2009
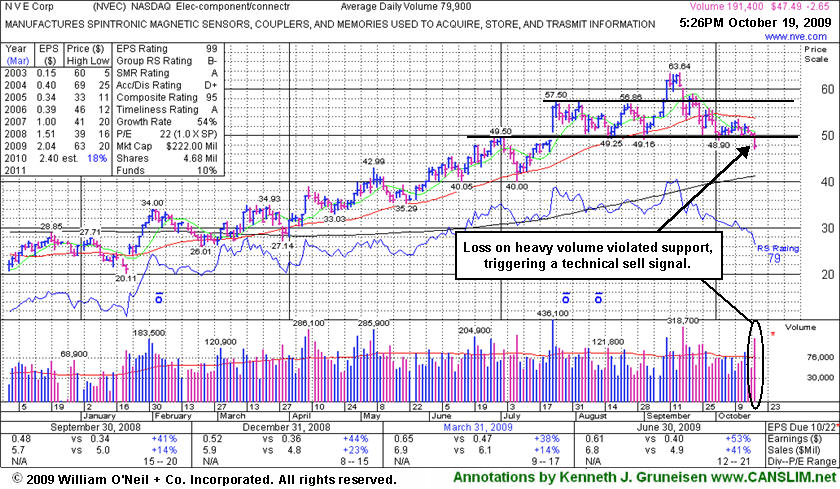
NVE Corp (NVEC -$2.65 or -5.58% to $47.49) suffered a considerable loss today on more than 2 times average volume as it violated prior chart lows in the $49 area triggered a technical sell signal. Based on the poor technical action it will be dropped from the Featured Stocks list tonight. The high-ranked leader in the Electronics - Components/Connectors group had traded up as much as +88% after first being featured in yellow at $33.85 on 3/13/09 in the mid-day report (read here). However, on 9/16/09 it appeared in this section under the headline, "Negative Reversal, Yet Still Above Max Buy Level." That negative reversal was followed by a gap down loss on heavy volume that negated its latest breakout. This makes a good example for study of how negative reversals can signal a change in trend. Not long afterward, it was noted when closes under its 50-day moving average (DMA) line raised concerns and triggered a technical sell signal. That was followed by additional analysis on 9/30/09 in this section under the headline "Negative Reversal Followed By Distributional Action."
The weak technical action is a worrisome sign, even though NVEC still has maintained a good quarterly and annual earnings growth history (C & A criteria). It even showed acceleration in the latest report for the quarter ended June 30, 2009. In that period sales revenues were up +41% and earnings were up +53%, even bigger percentage increases than prior solid (+25% or better) earnings comparisons, which is a very encouraging characteristic commonly seen in the market's biggest winners. It would need to rally above its 50 DMA line again for its outlook to improve.
Negative Reversal Followed By Distributional Action - Wednesday, September 30, 2009
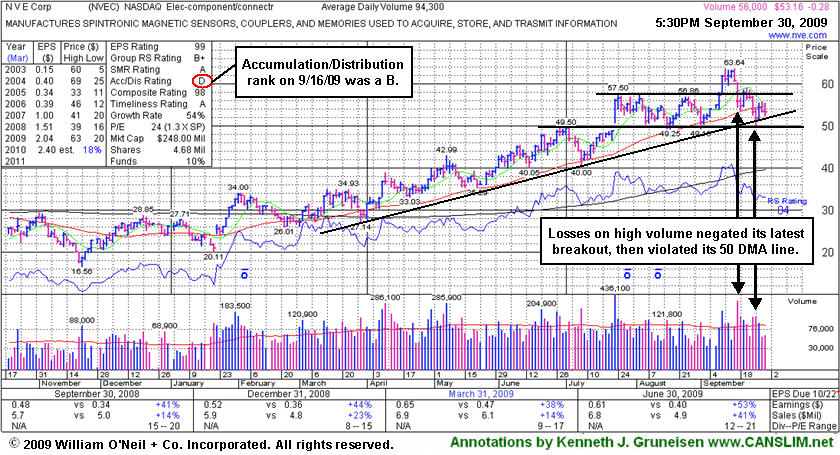
NVE Corp (NVEC -$0.28 or -0.52% to $53.16) is a high-ranked leader in the Electronics - Components/Connectors group. It ended with a small loss today on lighter volume, slumping further below its 50-day moving average (DMA) line which has now acted as a resistance level. Despite some encouraging signs of support arriving near its upward trendline and above prior chart lows in the $49 area, after recent distributional pressure it needs more time to form a new sound base. Meanwhile, further deterioration would trigger additional worrisome sell signals. It was noted when closes under its 50 DMA line for the first time since March raised concerns and triggered a technical sell signal. Its Accumulation/Distribution rank is down to a D now, having fallen from a B on 9/16/09 when it last appeared in this section under the headline, "Negative Reversal, Yet Still Above Max Buy Level." That negative reversal was followed by the gap down loss on heavy volume that negated its latest breakout. This makes a good example for study of how negative reversals can signal a change in trend.
Keep in mind its small supply (the S criteria) of only 4.68 million shares outstanding which can contribute to greater than usual volatility. Be mindful of its still rather minuscule sales revenues. These concerns heighten the need for great discipline in trading (buying AND selling). NVEC was first featured in yellow at $33.85 in the Friday, March 13, 2009 Mid-Day Breakouts Report (read here). This high-ranked Electronics - Components industry group leader has a good quarterly and annual earnings growth history (C & A criteria) and even showed acceleration in the latest report for the quarter ended June 30, 2009. In that period sales revenues were up +41% and earnings were up +53%, even bigger percentage increases than prior solid (+25% or better) earnings comparisons. That is what we call earnings growth acceleration, and it is a very encouraging characteristic commonly seen in the market's biggest winners.
Negative Reversal, Yet Still Above Max Buy Level - Wednesday, September 16, 2009
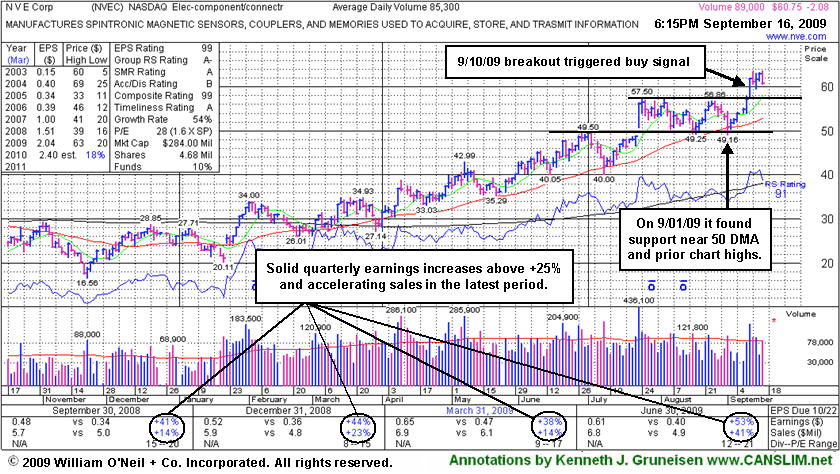
NVE Corp's (NVEC -$2.08 or -3.31% to $60.75) touched a new 52-week high today and then negatively reversed for a loss on average volume. It quickly got extended from its latest sound base, and it remains above its "max buy" level after having cleared its latest pivot point. It has a very small supply of only 4.68 million shares outstanding (the S criteria) which can contribute to greater than usual volatility. Be mindful of its still rather minuscule sales revenues. These concerns heighten the need for great discipline in trading (buying AND selling). It has shown bullish action since its last appearance in this FSU section on 9/01/09 which included an annotated graphs and analysis under the headline "Critical Chart Support Levels Tested Again While Market Weakens." The broader market's (the M criteria) improved strength was most certainly was a factor, as 3 out of 4 stocks typically move in sync with the major averages.
Prior chart highs are important support to watch now, and any deterioration leading to a close back into its prior base would negate the stock's latest bullish technical breakout raising concerns. Throughout its ongoing advance, NVEC has found support near its 50-day moving average (DMA) line (the red line). NVEC was first featured in yellow at $33.85 in the Friday, March 13, 2009 Mid-Day Breakouts Report (read here). This high-ranked Electronics - Components industry group leader has a good quarterly and annual earnings growth history (C & A criteria) and even showed acceleration in the latest report for the quarter ended June 30, 2009. In that period sales revenues were up +41% and earnings were up +53%, even bigger percentage increases than prior solid (+25% or better) earnings comparisons. That is what we call earnings growth acceleration, and it is a very encouraging characteristic commonly seen in the market's biggest winners.
Critical Chart Support Levels Tested Again While Market Weakens - Tuesday, September 01, 2009
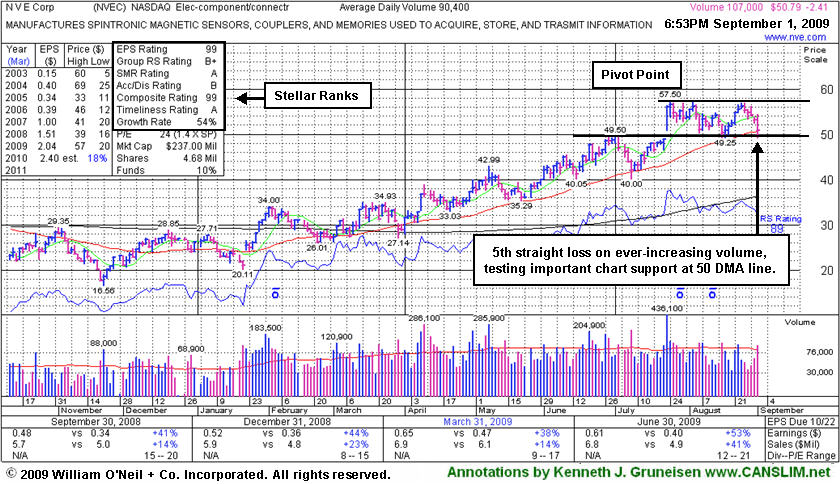
NVE Corp's (NVEC -$2.41 or -4.53% to $50.79) loss today on higher volume was its 5th consecutive decline. It is again trading near important support at its 50-day moving average (DMA) line and prior chart highs. Its color code was changed to green this week based on its weak action and failure to produce gains above its latest pivot point. In fact, today's intra-day low briefly undercut its 8/18/09 low which coincides with its last appearance in this FSU section under the headline, "Consolidation Near Important Support Levels" (read here). Throughout its ongoing advance, NVEC has found support near its 50 DMA line. Caution is warranted now, as eventually a more substantial correction is bound to come, and broader market conditions (the M criteria) appear to be weakening.
NVEC traded up as much as +69.87% since it was first featured in yellow at $33.85 in the Friday, March 13, 2009 Mid-Day Breakouts Report (read here). This high-ranked Electronics - Components leader has a good quarterly and annual earnings growth history (C & A criteria). However, it has failed to make additional progress since it was featured in the 7/23/09 Mid-Day BreakOuts Report (read here) after it gapped up for a considerable gain on heavy volume following news of stronger sales revenues (+41%) and solid earnings increases for the quarter ended June 30, 2009. The technical action was described as a "breakaway gap" from a valid ascending base. It has a very small supply of only 4.68 million shares outstanding. This is another good reason to be especially disciplined about proper entries and exits. A small supply is generally considered a good sign with respect to the S criteria, yet could contribute to great volatility in the event of institutional accumulation or distribution.
Consolidation Near Important Support Levels - Tuesday, August 18, 2009
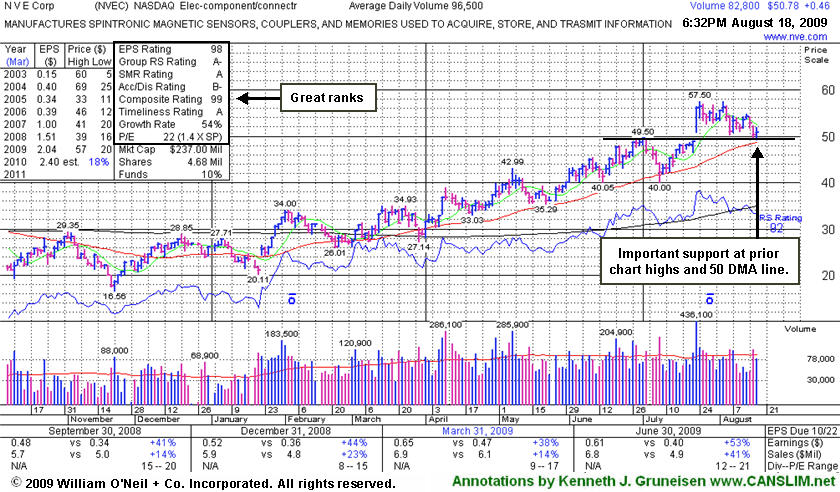
NVE Corp (NVEC +$0.46 or +0.91% to $50.78) has been consolidating in an orderly fashion toward prior highs and the stock's 50-day moving average (DMA) line (now $48.66) - important support levels. Throughout its ongoing advance, NVEC has found support near its 50 DMA line. Caution is warranted now, as eventually a more substantial correction is bound to come, and broader market conditions (the M criteria) appear to be weakening. NVEC has traded up as much as +69.87% since it was first featured in yellow at $33.85 in the Friday, March 13, 2009 Mid-Day Breakouts Report (read here). It was featured in the 7/23/09 Mid-Day BreakOuts Report (read here) after it gapped up for a considerable gain on heavy volume following news of stronger sales revenues (+41%) and solid earnings increases for the quarter ended June 30, 2009. The technical action was described as a "breakaway gap" from a valid ascending base.
It has a very small supply of only 4.68 million shares outstanding. This is another good reason to be especially disciplined about proper entries and exits. A small supply is generally considered a good sign with respect to the S criteria, yet could contribute to great volatility in the event of institutional accumulation or distribution. This high-ranked Electronics - Components leader has a good quarterly and annual earnings growth history (C & A criteria).
Caution and Discipline Required After Recent Small Cap Breakout - Monday, August 03, 2009
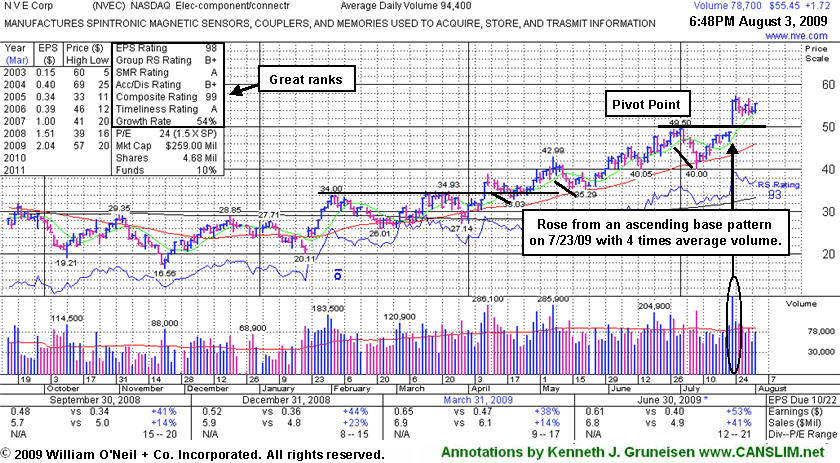
NVE Corp (NVEC +$1.72 or +3.20% to $55.45) has been consolidating in a tight range on lighter volume since its 7/23/09 breakout on 4 times average volume. It is extended from an ideal buy point by more than +5%, so disciplined investors would avoid chasing it or making potentially reckless buys. Patience can sometimes allow disciplined investors to accumulate shares on pullbacks toward prior highs and a stock's 50-day moving average (DMA) line -important support levels. For investors who miss the opportunity to buy when a stock initially breaks out, a stock's first pullback to its 50 DMA line can often be considered an ideal secondary buy point. However, the risk of a more serious correction and violation of the 50 DMA line increases with each subsequent pullback to the stock's 50 DMA line. By now, NVEC has found support near that important short-term average line a few times, so the risk of a more substantial consolidation is even greater.
Throughout its ongoing advance, NVEC has found support near its 50 DMA line. Caution is warranted now, as eventually a more substantial correction is bound to come. NVEC has traded up as much as +69.87% since it was first featured in yellow at $33.85 in the Friday, March 13, 2009 Mid-Day Breakouts Report (read here). It was featured in the 7/23/09 Mid-Day BreakOuts Report (read here) after it gapped up for a considerable gain on heavy volume following news of stronger sales revenues (+41%) and solid earnings increases for the quarter ended June 30, 2009. The technical action was described as a "breakaway gap" from a valid ascending base.
It has a very small supply of only 4.68 million shares outstanding. This is another good reason to be especially disciplined about proper entries and exits. A small supply is generally considered a good sign with respect to the S criteria, yet could contribute to great volatility in the event of institutional accumulation or distribution. This high-ranked Electronics - Components leader has a good quarterly and annual earnings growth history (C & A criteria).
Small Revenues and Small Supply Of Shares - Reasons For Extra Caution - Friday, July 17, 2009
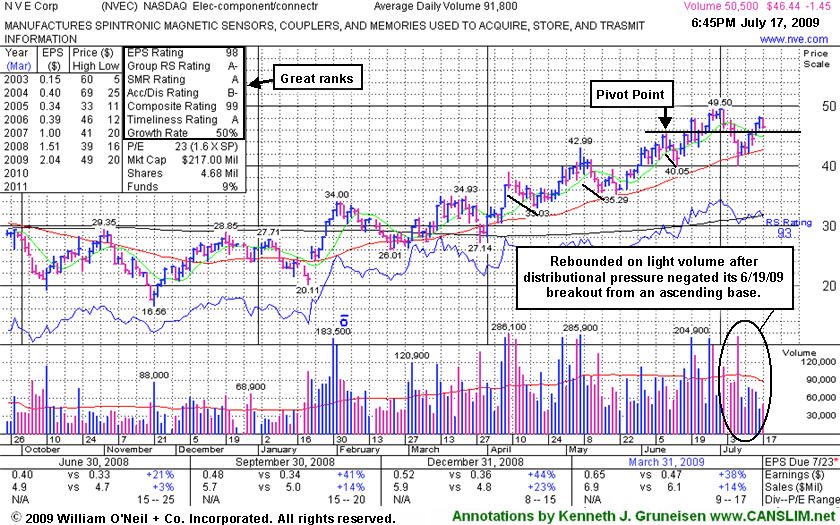
NVE Corp (NVEC -$1.45 or -3.03% to $46.44) is perched near its 52-week high after light volume gains this week helped it rally from support near its 50-day moving average (DMA) line - important support to watch, where a violation would raise concerns and trigger a technical sell signal. Its color code was changed to yellow based its resilience near its 50 DMA after its 6/19/09 breakout from an "ascending base" type pattern with volume more than 2 times average was negated. However, it needs more time to consolidate and form a sound base, especially since it briefly sank below its latest pivot point by more than -7% after its breakout.
It has a very small supply of only 4.67 million shares outstanding. This is another good reason to be especially disciplined about proper entries and exits. A small supply is generally considered a good sign with respect to the S criteria, yet could contribute to great volatility in the event of institutional accumulation or distribution. NVEC has traded up as much as +46.23% since it was first featured in yellow at $33.85 in the Friday, March 13, 2009 Mid-Day Breakouts Report (read here).
Earnings per share rose +38% in the period ended March 31, 2009 versus the year ago quarter, yet sales were up just +14% and, as previously noted, the company's sales revenues thus far have been rather minuscule. At less than $7 million per quarter in each of the past 8 quarters, sales have growing at a mostly lackluster pace percentage-wise. Companies reporting more substantial sales revenues generally make more reliable buy candidates, while companies with little "meat on the bone" can be particularly vulnerable to bad stumbles, fundamentally and technically. Nonetheless, this high-ranked Electronics - Components leader has a good quarterly and annual earnings growth history (C & A criteria).
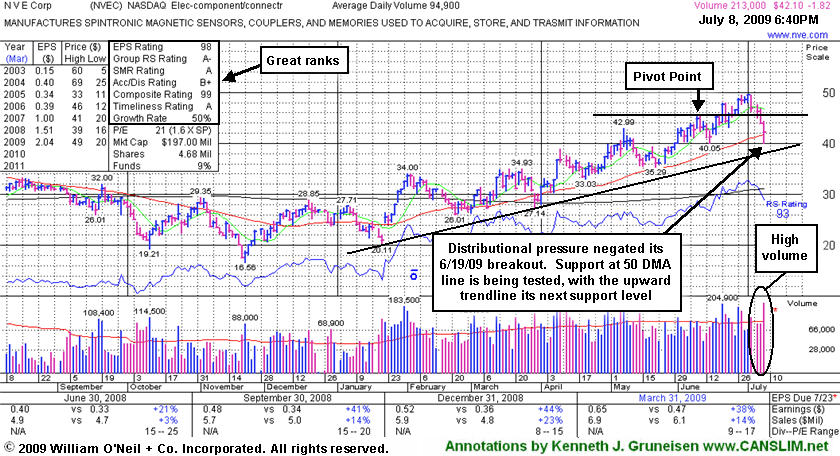
Distributional Pressure Leaves Stock Near Important Support - Wednesday, July 08, 2009
NVE Corp (NVEC -$1.82 or -4.14% to $42.10) suffered a large loss today with above average volume, indicating distributional pressure as its fourth consecutive loss pressured it under its pivot point. It is testing its 50-day moving average (DMA) line, an important area to watch above a multi-month upward trendline that is the next important support level. Its color code was changed to green based deterioration, as its latest breakout has been completely negated. Its 6/19/09 gain with volume more than 2 times average had helped it rise from an "ascending base" type pattern to a new 52-week high and multi-year high, triggering its latest technical buy signal. It has a very small supply of only 4.67 million shares outstanding. A small supply is generally considered a good sign with respect to the S criteria, yet could contribute to great volatility in the event of institutional accumulation or distribution. NVEC has traded up as much as +41.51% since it was first featured in yellow at $33.85 in the Friday, March 13, 2009 Mid-Day Breakouts Report (read here).
Earnings per share rose +38% in the period ended March 31, 2009 versus the year ago quarter, yet sales were up just +14% and, as previously noted, the company's sales revenues thus far have been rather minuscule. At less than $7 million per quarter in each of the past 8 quarters, sales have growing at a mostly lackluster pace percentage-wise. Companies reporting more substantial sales revenues generally make more reliable buy candidates, while companies with little "meat on the bone" can be particularly vulnerable to bad stumbles, fundamentally and technically. Nonetheless, this high-ranked Electronics - Components leader has a good quarterly and annual earnings growth history (C & A criteria).
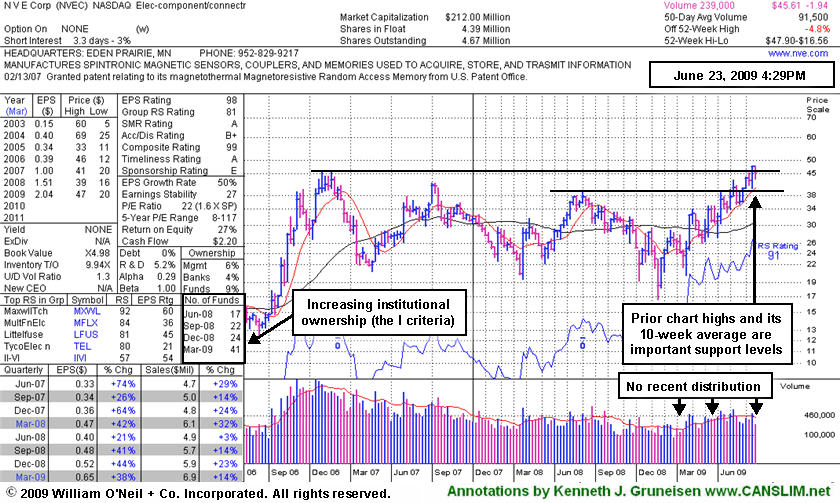
High-Ranked Leader Consolidating Near Latest Pivot Point - Tuesday, June 23, 2009
NVE Corp (NVEC +$1.28 or +2.86% to $45.61) made a positive reversal today to end the session near its pivot point. Weak action promptly negated a large part of its 6/19/09 gain with volume more than 2 times average which helped it rise from an "ascending base" type pattern to a new 52-week high and multi-year high, triggering its latest technical buy signal. Its color code was changed to yellow with new pivot point and max buy prices noted in the 6/19 mid-day report (read here). The weekly chart below illustrates how it found support above its 10-week average line (the red line) in recent months, which is an encouraging sign. Its 10-week average line is an important support level to watch now, which coincides with prior chart highs in the $39 area. It has a very small supply of only 4.67 million shares outstanding. A small supply is generally considered a good sign with respect to the S criteria, yet could contribute to great volatility in the event of institutional accumulation or distribution. NVEC has traded up as much as +41.51% since it was first featured in yellow at $33.85 in the Friday, March 13, 2009 Mid-Day Breakouts Report (read here).
Earnings per share rose +38% in the period ended March 31, 2009 versus the year ago quarter, yet sales were up just +14% and, as previously noted, the company's sales revenues thus far have been rather minuscule. At less than $7 million per quarter in each of the past 8 quarters, sales have growing at a mostly lackluster pace percentage-wise. Companies reporting more substantial sales revenues generally make more reliable buy candidates, while companies with little "meat on the bone" can be particularly vulnerable to bad stumbles, fundamentally and technically. Nonetheless, this high-ranked Electronics - Components leader has a good quarterly and annual earnings growth history (C & A criteria). No resistance remains due to overhead supply.
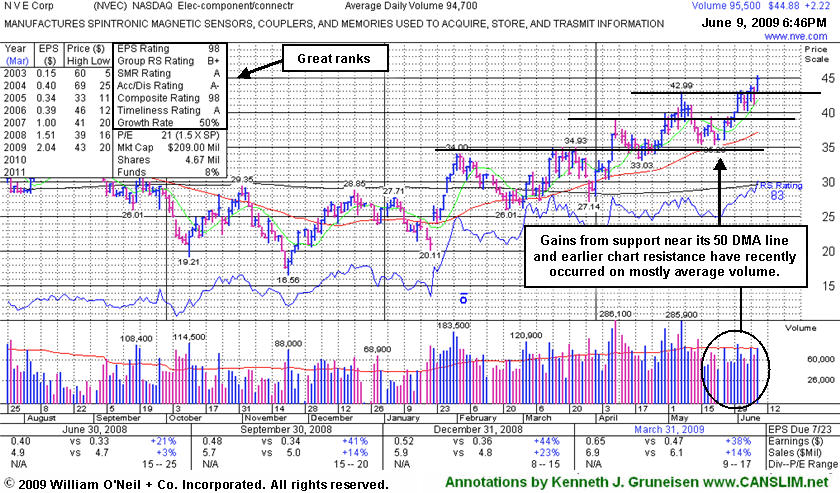
No Recent Base For Leader Hitting New 52-Week Highs - Tuesday, June 09, 2009
NVE Corp (NVEC +$2.22 or +5.20% to $44.88) has encountered no distributional pressure in recent weeks while gains on near average volume have boosted it to new 52-week highs. It is extended from a sound base now, making it a riskier choice for followers of the investment system. Usually a sound base needs to be formed over a period of at least 5-weeks minimum. Advanced chart patterns can occasionally offer valid entry points in a shorter span, but these brief consolidations must occur in a very tight trading range. During its most recent consolidation, NVEC dipped almost -18% from its $42.99 high. Thus, it would not be considered a "three weeks tight" type of pattern.
After any stock is bought, the system's sell rules kick in if it falls more than 7-8%, prompting investors to limit losses before they might become more devastating. This strict discipline may be especially important because of the very small supply of shares outstanding in this specific company. A small supply of shares is generally considered a good sign with respect to the S criteria, yet could contribute to great volatility in the event of institutional accumulation or distribution. NVEC has traded up as much as +33.85% since it was first featured in yellow at $33.85 in the Friday, March 13, 2009 Mid-Day Breakouts Report (read here).
Its 50-day moving average line is an important support level to watch now. Earnings per share rose +38% in the period ended March 31, 2009 versus the year ago quarter, yet sales were up just +14% and, as previously noted, the company's sales revenues thus far have been rather minuscule. At less than $7 million per quarter in each of the past 8 quarters, sales have growing at a mostly lackluster pace percentage-wise. Companies reporting more substantial sales revenues generally make more reliable buy candidates, while companies with little "meat on the bone" can be particularly vulnerable to bad stumbles, fundamentally and technically. Nonetheless, this high-ranked Electronics - Components leader has a good quarterly and annual earnings growth history (C & A criteria), and recent quarters showed sales revenues accelerating. No resistance remains due to overhead supply.
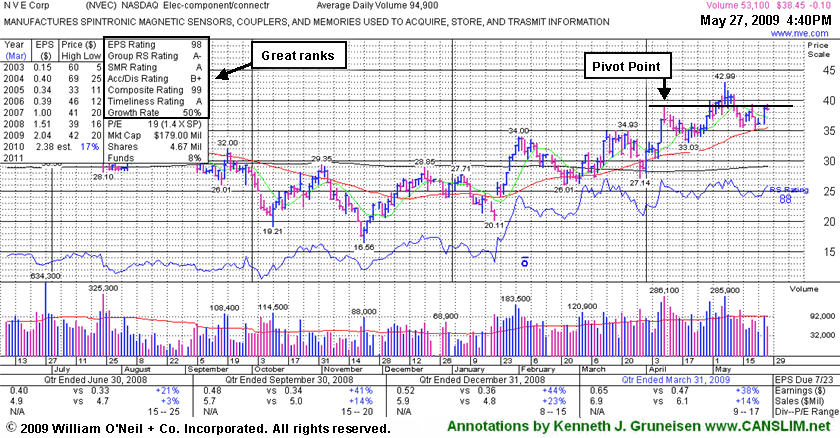
50-Day Average Is Important Support Now - Wednesday, May 27, 2009
NVE Corp (NVEC -$0.10 or -0.26% to $38.45) stalled following a 5/07/09 gap up and new 52-week high, and it has slumped under its pivot point. Typically healthy stocks do not fall more than 7% below their pivot points. Remember, after any stock is bought, if it falls more than 7-8%, the systems sell rules kick in, prompting investors to limit losses before they might become more devastating. This strict discipline may be especially important because of the very small supply of shares outstanding in the company, which is considered good with respect to the S criteria, yet could contribute to great volatility in the event of institutional accumulation or distribution. NVEC has traded up as much as +27.00% since it was first featured in yellow in the Friday, March 13, 2009 Mid-Day Breakouts Report (read here).
The gain with volume lifting it above its 4/09/09 high of $38.91 essentially met the guidelines to trigger a bullish technical buy signal. However, disciplined investors looking at that as a proper first time buy point or an add-on point might be concerned by its inability to make further headway. Its 50-day moving average line is an important support level to watch now. Meanwhile, confirming gains on high volume for new high closes would be a welcome and reassuring sign of institutional buying demand.
Earnings per share rose +38% over the year ago period, yet sales were up just +14% and still rather minuscule. As also previously noted, the company's sales revenues thus far have been rather minuscule at less than $7 million per quarter in each of the past 8 quarters, yet growing at a strong pace percentage-wise. Companies reporting more substantial sales revenues generally make more reliable buy candidates, while companies with little "meat on the bone" can be particularly vulnerable to bad stumbles, fundamentally and technically. Nonetheless, this high-ranked Electronics - Components leader has a good quarterly and annual earnings growth history (C & A criteria), and recent quarters showed sales revenues accelerating. Little resistance remains due to overhead supply.
C A N S L I M | StockTalk | News | Chart | SEC | Zacks Reports | ![]()
![]()
![]()
View all notes | Alert me of new notes | CANSLIM.net Company Profile
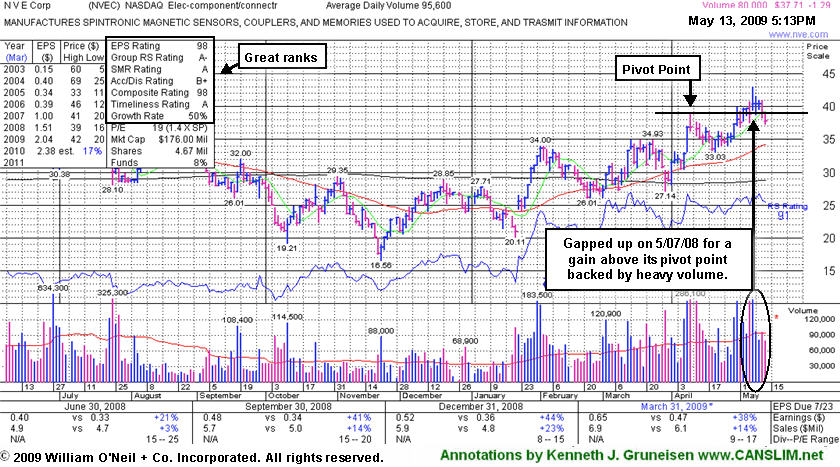
Small Electronics Firm Closed Back Under Pivot Point - Wednesday, May 13, 2009
NVE Corp (NVEC -$1.29 or -3.31% to $37.71) stalled following a 5/07/09 gap up and new 52-week high, and it slumped under its pivot point with a loss on lighter volume today. Little resistance remains due to overhead supply. The gain with volume lifting it above its 4/09/09 high of $38.91 essentially met the guidelines to trigger another bullish technical buy signal. However, disciplined investors looking at that as a proper first time buy point or an add-on point might be concerned after weak closes in the middle to lower half of its intra-day trading range have been noted as recent indications of distributional pressure. Earnings per share rose +38% over the year ago period, yet sales were up just +14% and still rather minuscule.
A data-packed weekly graph was annotated to show its 10-month cup-with-handle type of chart pattern when it last appeared in the 4/30/09 Featured Stock Update section (read here). NVEC has traded up as much as +27.00% since it was first featured in yellow in the Friday, March 13, 2009 Mid-Day Breakouts Report (read here).
Typically, healthy stocks find support at their old resistance levels, so subsequent deterioration under NVEC's high closes (in early-April) would raise more serious concerns, especially if volume increases behind losses. Remember, after any stock is bought, if it falls more than 7-8%, the systems sell rules kick in, prompting investors to limit losses before they might become more devastating. This strict discipline may be especially important because of the very small supply of shares outstanding in the company, which is considered good with respect to the S criteria, yet could contribute to great volatility in the event of institutional accumulation or distribution. As also previously noted, the company's sales revenues thus far have been rather minuscule at less than $7 million per quarter in each of the past 8 quarters, yet growing at a strong pace percentage-wise. Companies reporting more substantial sales revenues generally make more reliable buy candidates, while companies with little "meat on the bone" can be particularly vulnerable to bad stumbles, fundamentally and technically. Nonetheless, this high-ranked Electronics - Components leader has a good quarterly and annual earnings growth history (C & A criteria), and recent quarters showed sales revenues accelerating.
C A N S L I M | StockTalk | News | Chart | SEC | Zacks Reports | ![]()
![]()
![]()
View all notes | Alert me of new notes | CANSLIM.net Company Profile
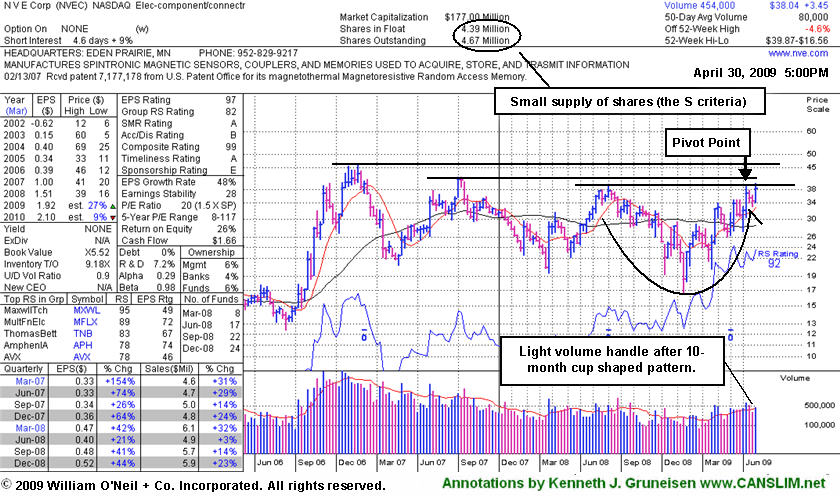
Little Resistance Remains After 10-Month Cup With Handle Pattern - Thursday, April 30, 2009
NVE Corp (NVEC +$0.73 or +1.96% to $38.04) has shown signs of more aggressive accumulation that smacks somewhat of institutional (the I criteria) buying demand in the past 2 sessions. The data-packed weekly graph annotated below shows a 10-month cup-with-handle type of chart pattern. Little resistance remains due to overhead supply. The recent 2-weeks of consolidation are a period during which volume totals dried up after its previously noted 4/08/09 technical breakout. Its color code has been changed to yellow again with a new pivot point and max buy level noted. Confirming gains with volume lifting it above its 4/09/09 high of $38.91 could trigger another bullish technical buy signal that may offer disciplined investors a proper first time buy point, or an add-on point. NVEC has traded up as much as +17.84% since it was first featured in yellow in the Friday, March 13, 2009 Mid-Day Breakouts Report (read here).
Typically, healthy stocks find support at their old resistance levels, so deterioration under NVEC's high closes (in early-April) would raise concerns, especially if volume increases behind losses. Remember, after any stock is bought, if it falls more than 7-8%, the systems sell rules kick in, prompting investors to limit losses before they might become more devastating. This strict discipline may be especially important because of the very small supply of shares outstanding in the company, which is considered good with respect to the S criteria, yet could contribute to great volatility in the event of institutional accumulation or distribution. As also previously noted, the company's sales revenues thus far have been rather minuscule at less than $7 million per quarter in each of the past 8 quarters, yet growing at a strong pace percentage-wise. Companies reporting more substantial sales revenues generally make more reliable buy candidates, while companies with little "meat on the bone" can be particularly vulnerable to bad stumbles, fundamentally and technically. Nonetheless, this high-ranked Electronics - Components leader has a good quarterly and annual earnings growth history (C & A criteria), and recent quarters showed sales revenues accelerating.
C A N S L I M | StockTalk | News | Chart | SEC | Zacks Reports | ![]()
![]()
![]()
View all notes | Alert me of new notes | CANSLIM.net Company Profile
Deterioration Into Prior Base Raises Concerns - Monday, April 20, 2009
NVE Corp's (NVEC -$1.84 or -5.21% to $33.50) deterioration into its prior base is cause for concern, as it has negated its recent breakout. It triggered a technical buy signal as it rose above its pivot point for a considerable gain on 4/08/09 backed by nearly 3 times its average daily volume total, which prompted it last appearance in this Featured Stock Update section under the headline "Breakout Above Pivot Point Backed By High Volume" (read here). Its breakout was a sign of more aggressive accumulation - proof of institutional (the I criteria) buying demand.
Typically, healthy stocks find support at their old resistance levels, so further deterioration would raise concerns, especially if volume increases behind losses. Investors may view this as an opportunity to accumulate shares on lighter volume pullbacks toward prior chart highs that are now an important support level to watch in the $34-35 area. After any stock is bought, if it falls more than 7-8%, the systems sell rules kick in, prompting investors to limit losses before they might become more devastating.
NVEC was first featured on Friday, March 13, 2009 in the CANSLIM.net Mid Day Breakouts Report (read here). It has demonstrated good quarterly and annual earnings growth (C & A criteria), and recent quarters showed sales revenues and earnings growth accelerating. This high-ranked electronic component maker has a small supply of shares outstanding, which is good concerning the S criteria, yet could contribute to great volatility in the event of institutional accumulation or distribution.
C A N S L I M | StockTalk | News | Chart | SEC | Zacks Reports | ![]()
![]()
![]()
View all notes | Alert me of new notes | CANSLIM.net Company Profile
Breakout Above Pivot Point Backed By High Volume - Wednesday, April 08, 2009
NVE Corp (NVEC +$3.95 or +12.94% to $36.77) triggered a technical buy signal as it rose above its pivot point for a considerable gain today backed by nearly 3 times its average daily volume total. Its 50 DMA rose above its 200 DMA line a couple of weeks ago, which was noted earlier as an encouraging technical improvement. Concerns were raised when it gapped down on 3/30/09 and violated its 50-day moving average (DMA) line, triggering a technical sell signal, however it promptly repaired that violation and found support near its 200 DMA line. Its last appearance in this Featured Stock Update section on 4/03/09 was under the headline "Prompt Repair of 50 DMA Violation Is Encouraging Sign Of Support" (read here).
Today's breakout was better than an ordinary sign of healthy support near a stock's short-term average. It was a sign of more aggressive accumulation - proof of institutional (the I criteria) buying demand. Keep in mind that the window for a proper entry is small, and it is best to avoid chasing a stock more than 5% above its pivot point. It has risen above its "max buy" level, so increased caution is suggested, meanwhile patient investors may have an opportunity to accumulate shares on lighter volume pullbacks toward prior chart highs that are now an important support level to watch in the $34-35 area.
NVEC was first featured on Friday, March 13, 2009 in the CANSLIM.net Mid Day Breakouts Report (read here). It has demonstrated good quarterly and annual earnings growth (C & A criteria), and recent quarters showed sales revenues and earnings growth accelerating. This high-ranked electronic component maker has a small supply of shares outstanding, which is good concerning the S criteria, yet could contribute to great volatility in the event of institutional accumulation or distribution. After any stock is bought, if it falls more than 7-8%, the systems sell rules kick in, prompting investors to limit losses before they might become more devastating.
C A N S L I M | StockTalk | News | Chart | SEC | Zacks Reports | ![]()
![]()
![]()
View all notes | Alert me of new notes | CANSLIM.net Company Profile
Prompt Repair of 50 DMA Violation Is Encouraging Sign Of Support - Friday, April 03, 2009
NVE Corp (NVEC +$0.18 or +0.57% to $32.00) promptly repaired a 50-day moving average (DMA) line violation after recently finding support near its 200 DMA line. Its 50 DMA rose above its 200 DMA line a couple of weeks ago, which is an encouraging technical improvement. Its color code was changed to yellow based on its resilience, however it has yet to trigger a proper technical buy signal with gains above its pivot point backed by more than +50% above average volume. Concerns were raised when it gapped down on 3/30/09 and violated its 50-day moving average (DMA) line, triggering a technical sell signal. Its last appearance in this Featured Stock Update section on 3/24/09 was under the headline "Technical Proof of Heavy Institutional Buying Demand Not Yet Shown" (read here).
NVEC was first featured on Friday, March 13, 2009 in the CANSLIM.net Mid Day Breakouts Report (read here). It has demonstrated good quarterly and annual earnings growth (C & A criteria), and recent quarters showed sales revenues and earnings growth accelerating. This high-ranked electronic component maker has a small supply of shares outstanding, which is good concerning the S criteria, yet could contribute to great volatility in the event of institutional accumulation or distribution. Disciplined investors resist the urge to get in "early" and patiently watch for proof of heavy institutional (the I criteria) buying demand driving a technical breakout that meets the investment system's guidelines. The window for a proper entry is small, and it is best to avoid chasing a stock more than 5% above its pivot point. After any stock is bought, if it falls more than 7-8%, the systems sell rules kick in, prompting investors to limit losses before they might become more devastating.
C A N S L I M | StockTalk | News | Chart | SEC | Zacks Reports | ![]()
![]()
![]()
View all notes | Alert me of new notes | CANSLIM.net Company Profile
Technical Proof of Heavy Institutional Buying Demand Not Yet Shown - Tuesday, March 24, 2009
NVE Corp (NVEC -$1.36 or -3.97% to $32.86) has yet to trigger a proper technical buy signal with gains above its pivot point backed by more than +50% above average volume, although it has come close since its last appearance on 3/13/09 under the headline "Disciplined Investors Watch For A Proper Entry Point" in this Featured Stock Update section (read here). It was first featured on Friday, March 13, 2009 in the CANSLIM.net Mid Day Breakouts Report (read here). It has demonstrated good quarterly and annual earnings growth (C & A criteria), and recent quarters showed sales revenues and earnings growth accelerating. This high-ranked electronic component maker has a small supply of shares outstanding, which is good concerning the S criteria, yet could contribute to great volatility in the event of institutional accumulation or distribution. Disciplined investors resist the urge to get in "early" and patiently watch for proof of heavy institutional (the I criteria) buying demand driving a technical breakout that meets the investment system's guidelines. The window for a proper entry is small, and it is best to avoid chasing a stock more than 5% above its pivot point. After any stock is bought, if it falls more than 7-8%, the systems sell rules kick in, prompting investors to limit losses before they might become more devastating.
C A N S L I M | StockTalk | News | Chart | SEC | Zacks Reports | ![]()
![]()
![]()
View all notes | Alert me of new notes | CANSLIM.net Company Profile
Disciplined Investors Watch For A Proper Entry Point - Friday, March 13, 2009
NVE Corp (NVEC +$0.64 or +1.93% to $33.87) has yet to trigger a technical buy signal with gains above its pivot point backed by more than +50% above average volume. It was first featured on Friday, March 13, 2009 in the CANSLIM.net Mid Day Breakouts Report (read here). It has demonstrated good quarterly and annual earnings growth (C & A criteria), and recent quarters showed sales revenues and earnings growth accelerating. This high-ranked electronic component maker has a small supply of shares outstanding, which is good concerning the S criteria, yet could contribute to great volatility in the event of institutional accumulation or distribution. Disciplined investors resist the urge to get in "early" and patiently watch for proof of heavy institutional (the I criteria) buying demand driving a technical breakout that meets the investment system's guidelines. The window for a proper entry is small, and it is best to avoid chasing a stock more than 5% above its pivot point. After any stock is bought, if it falls more than 7-8%, the systems sell rules kick in, prompting investors to limit losses before they might become more devastating.
C A N S L I M | StockTalk | News | Chart | SEC | Zacks Reports | ![]()
![]()
![]()
View all notes | Alert me of new notes | CANSLIM.net Company Profile