Electronic Systems Leader is Extended From Prior Base - Thursday, August 30, 2018
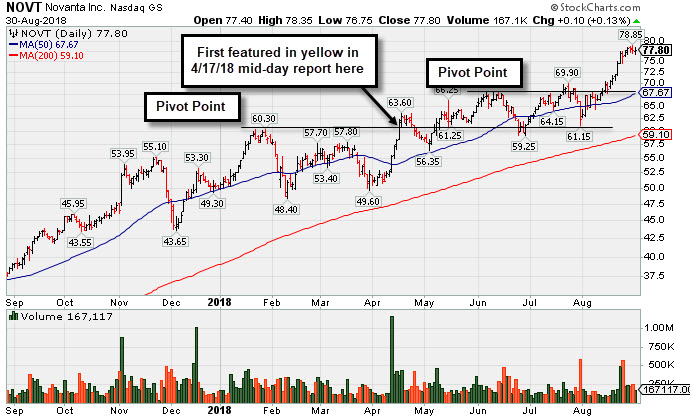
Novanta Inc (NOVT +$0.10 or +0.13% to $77.80) is perched near its 52-week high, very extended from the latest sound base pattern. Prior highs in the $68-69 area define initial support above the 50-day moving average (DMA) line ($67.67).NOVT was last shown with an annotated graph and additional details in the FSU analysis on 7/12/18 under the headline, " Gain Challenged 52-Week High and New Pivot Point". The high-ranked Electronics - Scientific/Measuring firm was highlighted in yellow with pivot point cited based on its 1/29/18 high plus 10 cents in the 4/17/18 mid-day report (read here).
The Jun '18 quarterly earnings increase of +24% versus the year ago period was one notch below the +25% minimum earnings guideline (C criteria), breaking the prior streak of 5 quarterly comparisons above the +25% threshold. Sales revenues growth has been strong. Its strong annual earnings (A criteria) history is a good match with the fact-based investment system's guidelines. It has earned a 94 Earnings Per Share Rating.
The number of top-rated funds owning its shares rose from 256 in Jun '17 to 347 in Jun '18, a reassuring sign concerning the I criteria. Its current Up/Down Volume Ratio of 1.1 is an unbiased indication its shares have been under only slight accumulation over the past 50 days. There are only 34.7 million shares outstanding (S criteria). It has earned a Timeliness Rating of A and Sponsorship rating of B.
Charts used courtesy of www.stockcharts.com


Gain Challenged 52-Week High and New Pivot Point - Thursday, July 12, 2018
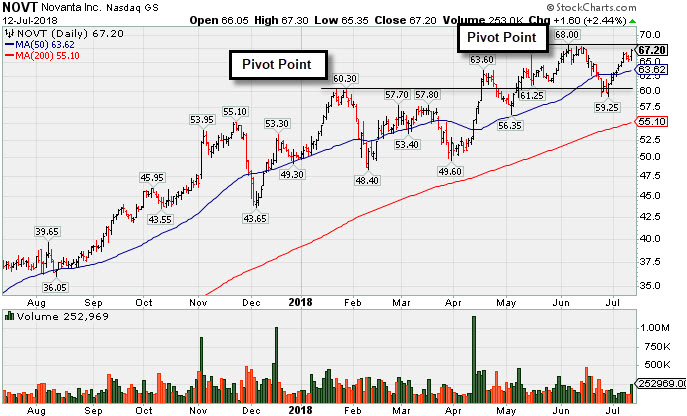
Novanta Inc (NOVT +$1.60 or 2.44% to $67.20) posted a solid gain today with above average volume. Its color code was changed to yellow with new pivot point cited based on its 6/06/18 high plus 10 cents. It is perched within close striking distance of its 52-week high. Subsequent volume-driven gains above the pivot point may trigger a new (or add-on) technical buy signal. The 50 DMA line ($63.62) and recent low ($59.25) define important near-term support.It was last shown with an annotated graph and additional details in the FSU analysis on 5/25/18 under the headline, "Quietly Hovering Near All-Time High". The high-ranked Electronics - Scientific/Measuring firm was highlighted in yellow with pivot point cited based on its 1/29/18 high plus 10 cents in the 4/17/18 mid-day report (read here).
The past 5 quarterly earnings comparisons were above the +25% minimum guideline (C criteria). Recently it reported earnings +52% on +35% sales revenues for the Mar '18 quarter. Sales revenues growth has been strong. Its strong annual earnings (A criteria) history is a good match with the fact-based investment system's guidelines. It has earned a 97 Earnings Per Share Rating.
The number of top-rated funds owning its shares rose from 256 in Jun '17 to 332 in Jun '18, a reassuring sign concerning the I criteria. Its current Up/Down Volume Ratio of 1.8 is an unbiased indication its shares have been under accumulation over the past 50 days. There are only 34.7 million shares outstanding (S criteria). It has earned a Timeliness Rating of A and Sponsorship rating of B.
Charts used courtesy of www.stockcharts.com


Quietly Hovering Near All-Time High - Friday, May 25, 2018
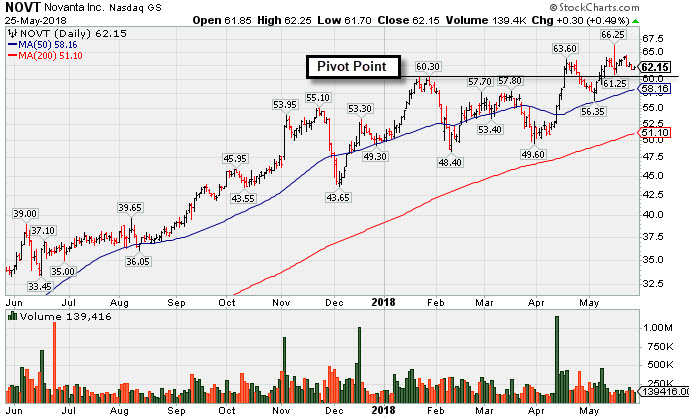
Novanta Inc (NOVT +$0.30 or +0.49% to $62.15) wedged slightly higher with gains lacking volume conviction following a noted "negative reversal" on 5/15/18 after hitting a new 52-week high. NOVT found support near prior highs in the $58 area and stayed above its 50-day moving average (DMA) line ($58.16) during the prior consolidation.The high-ranked Electronics - Scientific/Measuring firm was highlighted in yellow with pivot point cited based on its 1/29/18 high plus 10 cents in the 4/17/18 mid-day report (read here). It hit a new 52-week high with +66% above average volume behind its gain, rising above the pivot point and triggering a technical buy signal. An annotated graph and additional details were included in the FSU analysis on 4/17/18 under the headline, "Volume-Driven Gain Hit New All-Time High".
The past 5 quarterly earnings comparisons were above the +25% minimum guideline (C criteria). Recently it reported earnings +52% on +35% sales revenues for the Mar '18 quarter. Sales revenues growth has been strong. Its strong annual earnings (A criteria) history is a good match with the fact-based investment system's guidelines. It has earned a 97 Earnings Per Share Rating.
The number of top-rated funds owning its shares rose from 256 in Jun '17 to 330 in Mar '18, a reassuring sign concerning the I criteria. Its current Up/Down Volume Ratio of 1.9 is an unbiased indication its shares have been under accumulation over the past 50 days. There are only 34.7 million shares outstanding (S criteria). It has earned a Timeliness Rating of A and Sponsorship rating of B.
Charts used courtesy of www.stockcharts.com


Volume-Driven Gain Hit New All-Time High - Tuesday, April 17, 2018
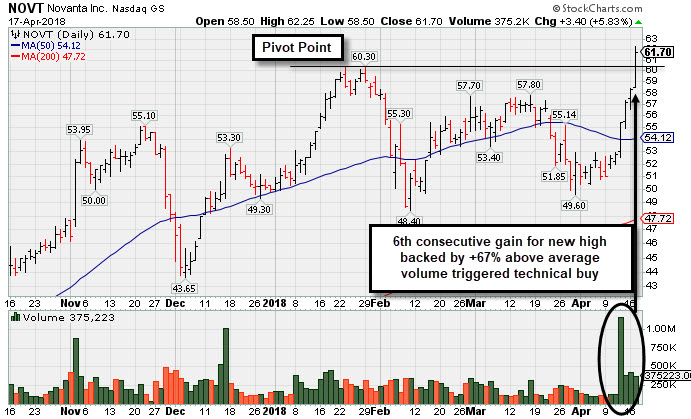
Novanta Inc (+$3.40 or +5.83% to $61.70) finished strong after highlighted in yellow with pivot point cited based on its 1/29/18 high plus 10 cents in the earlier mid-day report (read here). It hit a new 52-week high with +62% above average volume behind today's 6th consecutive gain, rising above the pivot point and triggering a technical buy signal.
Recently it reported earnings +26% on +49% sales revenues for the Dec '17 quarter. and 3 of the past 4 quarterly earnings comparisons were above the +25% minimum guideline (C criteria). Sales revenues growth has shown encouraging acceleration. Its strong annual earnings (A criteria) history is a good match with the fact-based investment system's guidelines. It has earned a 96 Earnings Per Share Rating.
The number of top-rated funds owning its shares rose from 256 in Jun '17 to 326 in Mar '18, a reassuring sign concerning the I criteria. Its current Up/Down Volume Ratio of 2.0 is an unbiased indication its shares have been under accumulation over the past 50 days. There are only 34.6 million shares outstanding (S criteria). It has earned a Timeliness Rating of A and Sponsorship rating of B.
Charts used courtesy of www.stockcharts.com

