Holding Ground Following Impressive Volume-Driven Gains - Thursday, October 12, 2017
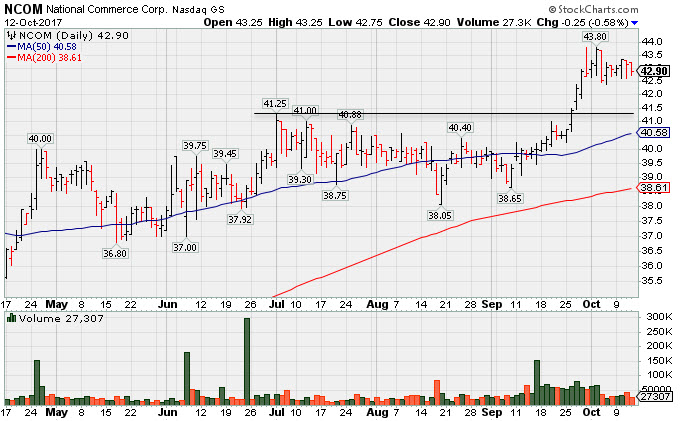
National Commerce Corp (NCOM -$0.30 or -0.70% to $42.85) has been stubbornly holding its ground at its 52-week high following an impressive spurt of volume-driven gains. Prior highs and its 50-day moving average (DMA) line ($40.58) define near-term support to watch on pullbacks. Its Relative Strength rating is currently 82, above the minimum guideline for buy candidates.Recently it reported Jun '17 earnings +23% on +45% sales revenues, below the +25% minimum earnings guideline (C criteria), raising fundamental concerns while ending its streak of 9 consecutive quarterly comparisons with earnings increasing above the +25% minimum guideline (C criteria). Still, it has a very high 98 Earnings Per Share Rating.
NCOM showed bullish action since last shown in this FSU section on 9/14/17 with an annotated graph under the headline, "Relative Strength Rating Fell Below 80+ Minimum Guideline". It was first highlighted in yellow in the 4/25/17 mid-day report with new pivot point cited based on its 1/27/17 high plus 10 cents (read here).
Currently, it has a Timeliness rating of A and a Sponsorship rating of A. The number of top-rated funds owning its shares rose from 94 in Jun '16 to 162 in Jun'17, a reassuring sign concerning the I criteria. Its current Up/Down Volume Ratio of 1.6 is an unbiased indication its shares have been under accumulation over the past 50 days. Its small supply of only 11.3 million shares (S criteria) in the public float can contribute to greater price volatility in the event of institutional buying or selling. The Bank holding company's annual earnings (A criteria) history has been strong. It is up from its $20 IPO on 3/19/15.
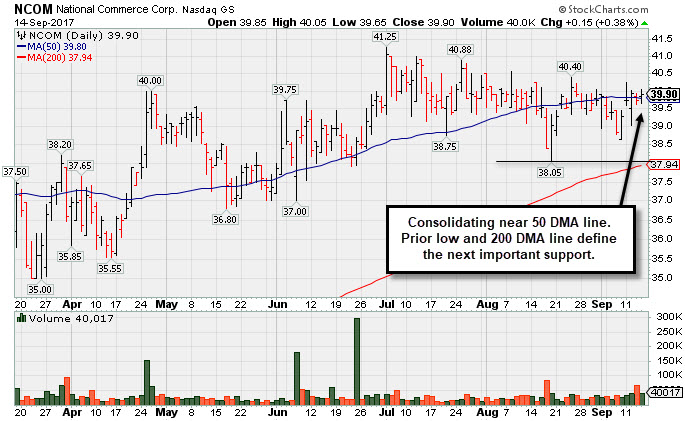
Relative Strength Rating Fell Below 80+ Minimum Guideline - Thursday, September 14, 2017
National Commerce Corp (NCOM +$0.15 or +0.38% to $39.90) has been consolidating in a tight range near its 50-day moving average (DMA) line ($39.80). Its Relative Strength rating is currently 75, below the minimum guideline for buy candidates. Recently reported Jun '17 earnings +23% on +45% sales revenues, below the +25% minimum earnings guideline (C criteria), raising fundamental concerns while ending its streak of 9 consecutive quarterly comparisons with earnings increasing above the +25% minimum guideline (C criteria).It was last shown in this FSU section on 8/16/17 with an annotated graph under the headline, "Consolidating Near 50-day Moving Average Line". It was first highlighted in yellow in the 4/25/17 mid-day report with new pivot point cited based on its 1/27/17 high plus 10 cents (read here).
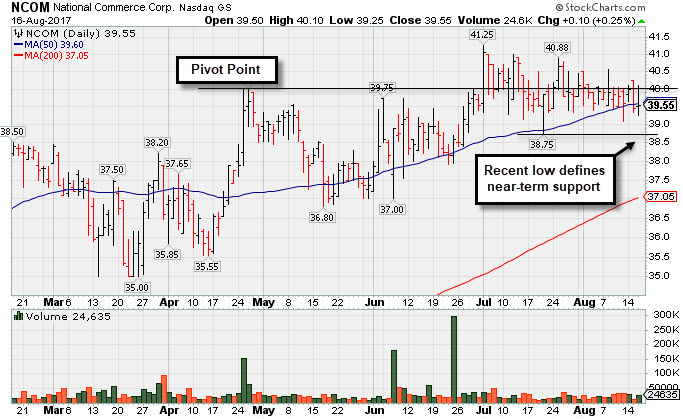
Consolidating Near 50-day Moving Average Line - Wednesday, August 16, 2017
National Commerce Corp (NCOM +$0.10 or +0.25% to $39.55) has been consolidating in a tight trading range near its 50-day moving average (DMA) line ($39.60). Subsequent damaging losses violating the recent low ($38.75 on 7/20/17) would raise greater concerns and trigger a technical sell signal. Recently it reported Jun '17 earnings +23% on +45% sales revenues, raising fundamental concerns, ending its streak of 9 consecutive quarterly comparisons with earnings increasing above the +25% minimum guideline (C criteria). It annual earnings (A criteria) history has been strong. It is up from its $20 IPO on 3/19/15.Gains above the pivot point should be backed by a minimum of +40% above average volume may trigger a proper technical buy signal.
It stalled after hitting a new 52-week high with a gain backed by only average volume when last shown in this FSU section on 7/10/17 with an annotated graph under the headline, "Recent Breakout Lacked Great Volume Conviction." It was first highlighted in yellow in the 4/25/17 mid-day report with new pivot point cited based on its 1/27/17 high plus 10 cents (read here).It has a Timeliness rating of B and a Sponsorship rating of B. The number of top-rated funds owning its shares rose from 94 in Jun '16 to 154 in Jun'17, a reassuring sign concerning the I criteria. Its current Up/Down Volume Ratio of 1.4 is an unbiased indication its shares have been under accumulation over the past 50 days. Its small supply of only 10.4 million shares (S criteria) can contribute to greater price volatility in the event of institutional buying or selling.
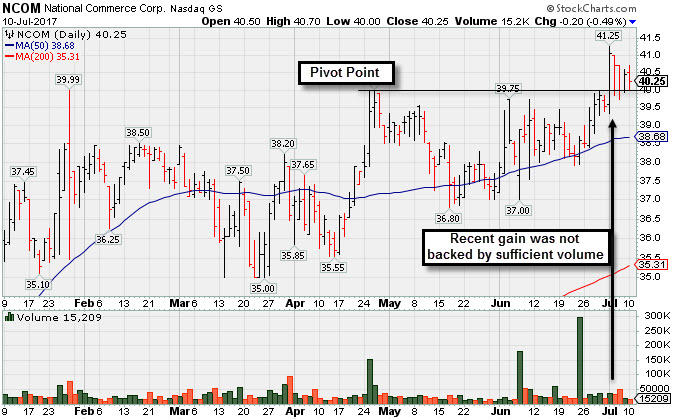
Recent Breakout Lacked Great Volume Conviction - Monday, July 10, 2017
National Commerce Corp (NCOM -$0.20 or -0.49% to $40.25) has been holding its ground since hitting a new 52-week high, triggering a technical buy signal with a gain backed by only average volume. Its 50-day moving average (DMA) line ($38.68) defines support above prior lows.
Gains above the pivot point should be backed by a minimum of +40% above average volume may trigger a proper technical buy signal.
It was last shown in this FSU section on 5/30/17 with an annotated graph under the headline, ""Sputtering Near 50-Day Moving Average After Stalling"". At that time it was trying to rally from an orderly base pattern. It finished strong after highlighted in yellow in the 4/25/17 mid-day report with new pivot point cited based on its 1/27/17 high plus 10 cents (read here).
It reported Mar '17 earnings +32% on +42% sales revenues extending its streak to 9 consecutive quarterly comparisons with earnings increasing above the +25% minimum guideline (C criteria). It annual earnings (A criteria) history has been strong. It is up from its $20 IPO on 3/19/15.
It has a Timeliness rating of A and a Sponsorship rating of B. The number of top-rated funds owning its shares rose from 94 in Jun '16 to 135 in Mar '17, a reassuring sign concerning the I criteria. Its current Up/Down Volume Ratio of 2.0 is an unbiased indication its shares have been under accumulation over the past 50 days. Its small supply of only 10.4 million shares (S criteria) can contribute to greater price volatility in the event of institutional buying or selling.
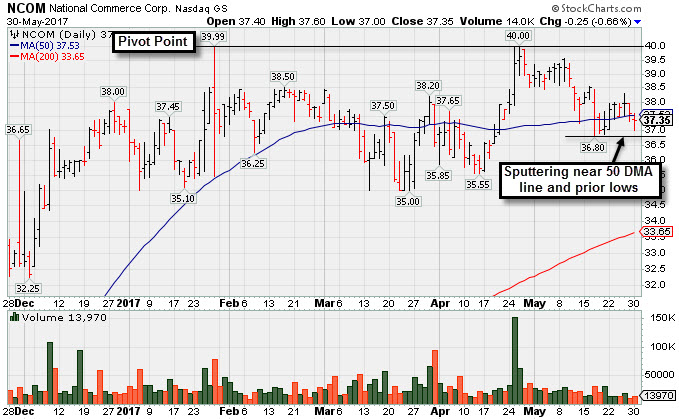
Sputtering Near 50-Day Moving Average After Stalling - Tuesday, May 30, 2017
National Commerce Corp (NCOM -$0.25 or -0.66% to $37.35) has been consolidating near recent its 50-day moving average (DMA) line ($37.53) and sputtering near recent lows. Prior lows in the $35 area define the next important chart support level to watch.
Subsequent gains above the pivot point backed by a minimum of +40% above average volume may trigger a technical buy signal. It stalled after topping the prior high by only a penny since last shown in this FSU section on 4/16/17 with an annotated graph under the headline, "Challenging 52-Week High With Volume-Driven Gains". At that time it was trying to rally from a 12-week flat base pattern. It finished strong after highlighted in yellow in the 4/25/17 mid-day report with new pivot point cited based on its 1/27/17 high plus 10 cents (read here).
It reported Mar '17 earnings +32% on +42% sales revenues extending its streak to 9 consecutive quarterly comparisons with earnings increasing above the +25% minimum guideline (C criteria). It annual earnings (A criteria) history has been strong. It is up from its $20 IPO on 3/19/15.
It has a Timeliness rating of B and a Sponsorship rating of B. The number of top-rated funds owning its shares rose from 94 in Jun '16 to 128 in Mar '17, a reassuring sign concerning the I criteria. Its current Up/Down Volume Ratio of 1.7 is an unbiased indication its shares have been under accumulation over the past 50 days. Its small supply of only 10.4 million shares (S criteria) can contribute to greater price volatility in the event of institutional buying or selling.
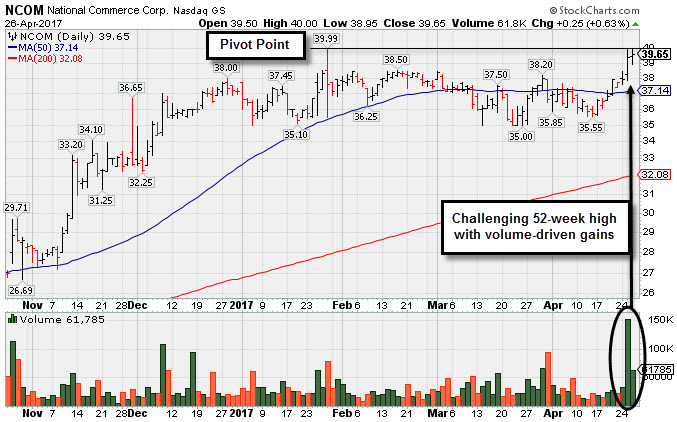
Challenging 52-Week High With Volume-Driven Gains - Wednesday, April 26, 2017
National Commerce Corp (NCOM +$0.25 or +0.63% to $39.65) hit a new 52-week high with today's 3rd consecutive gain, trying to rally from a 12-week flat base pattern. It finished strong after highlighted in yellow in the 4/25/17 mid-day report with new pivot point cited based on its 1/27/17 high plus 10 cents (read here). A gain above the pivot point backed by a minimum of +40% above average volume may trigger a technical buy signal.
It reported Mar '17 earnings +32% on +42% sales revenues extending its streak to 9 consecutive quarterly comparisons with earnings increasing above the +25% minimum guideline (C criteria). It annual earnings (A criteria) history has been strong. It is up from its $20 IPO on 3/19/15.
It has a Timeliness rating of A and a Sponsorship rating of A. The number of top-rated funds owning its shares rose from 94 in Jun '16 to 117 in Mar '17, a reassuring sign concerning the I criteria. Its current Up/Down Volume Ratio of 1.4 is an unbiased indication its shares have been under accumulation over the past 50 days. Its small supply of only 10.4 million shares (S criteria) can contribute to greater price volatility in the event of institutional buying or selling.
