Meeting Resistance Near Prior High - Tuesday, June 27, 2017
Macom Tech Solution Hldg (MTSI -$2.59 or -4.30% to $57.66) met resistance near the prior high and pulled back today following 2 consecutive gains backed by higher volume. Recent lows and its 50-day moving average (DMA) line define important support in the $54-55 area where violations would raise concerns and trigger technical sell signals.
The high-ranked Electronics - Semiconductor manufacturing firm was last shown in this FSU section on 5/16/17 with an annotated graph under the headline, "Big Breakout Gain With More Than 5 Times Average Volume". It was highlighted in yellow at $52.52 with new pivot point cited based on its 12/07/16 high plus 10 cents in the 5/16/17 mid-day report (read here). It rallied above prior highs with a considerable gain while volume was more than 5 times average, triggering a technical buy signal. Disciplined investors avoid chasing stocks more than +5% above their prior high or pivot point, and it quickly rallied and closed the session above its "max buy" level.
Most recently, it reported Mar '17 quarterly earnings +38% on +39% sales revenues, continuing its streak of earnings increases above the +25% minimum guideline (C criteria). Earnings rose +47% on +31% sales revenues for the Dec '16 quarter, . Recent years showed strong annual earnings (A criteria) increases after a slight downturn in FY '13 and '14.
It completed a new Public Offering on 2/05/15. The number of top-rated funds owning its shares rose from 351 in Jun '16 to 391 in Mar '17. The current Up/Down Volume Ratio is 1.0, a neutral reading concerning whether its shares have been under institutional accumulation over the past 50 days (I criteria). Its Timeliness Rating is B and Sponsorship Rating is C. Its small supply of only 36.8 million shares in the public float (S criteria) can contribute to greater price volatility in the event of institutional buying or selling.
Charts courtesy www.stockcharts.com

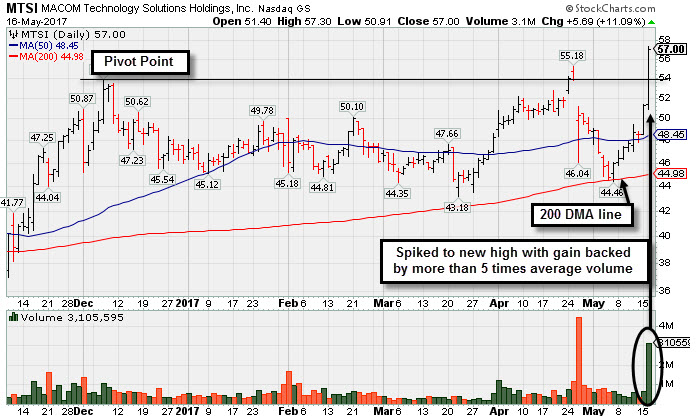
Big Breakout Gain With More Than 5 Times Average Volume - Tuesday, May 16, 2017
Macom Tech Solution Hldg (MTSI +$5.69 or +11.09% to $57.00) finished strong after highlighted in yellow with new pivot point cited based on its 12/07/16 high plus 10 cents in the earlier mid-day report (read here). It rallied above prior highs with a considerable gain while volume was more than 5 times average, triggering a technical buy signal. No resistance remains due to overhead supply. However, disciplined investors avoid chasing stocks more than +5% above their prior high or pivot point, and it quickly rallied and closed the session above its "max buy" level.
The high-ranked Electronics - Semiconductor manufacturing firm was last shown in this FSU section on 4/25/17 with an annotated graph under the headline, "Strong Earnings Report While Perched at All-Time High." Due to weak action it was noted and dropped from the Featured Stocks list on 5/03/17. It showed resilience since then, and after finding support at its 200-day moving average (DMA) line, rebounding above the 50 DMA line ($48.45) helped its outlook to improve.
Most recently, it reported Mar '17 quarterly earnings +38% on +39% sales revenues, continuing its streak of earnings increases above the +25% minimum guideline (C criteria). Earnings rose +47% on +31% sales revenues for the Dec '16 quarter, . Recent years showed strong annual earnings (A criteria) increases after a slight downturn in FY '13 and '14.
It completed a new Public Offering on 2/05/15. The number of top-rated funds owning its shares rose from 351 in Jun '16 to 386 in Mar '17. The current Up/Down Volume Ratio is 1.1, a nearly neutral reading concerning whether its shares have been under institutional accumulation over the past 50 days (I criteria). Its Timeliness Rating is B and Sponsorship Rating is C. Its small supply of only 26.8 million shares in the public float (S criteria) can contribute to greater price volatility in the event of institutional buying or selling.
Charts courtesy www.stockcharts.com
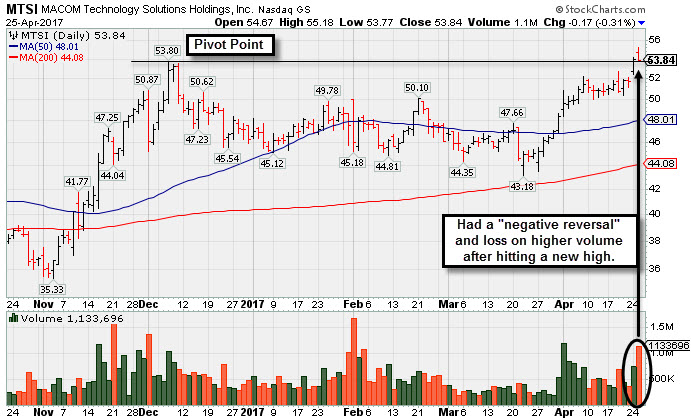
Strong Earnings Report While Perched at All-Time High - Tuesday, April 25, 2017
Macom Tech Solution Hldg (MTSI -$0.17 or -0.31% to $53.84) had a "negative reversal" and finished the session with a small loss on higher volume. It was highlighted in yellow with pivot point cited based on its 12/07/16 high plus 10 cents in the earlier mid-day report (read here). It hit a new 52-week high today and no resistance remains, but the action was indicative of distributional pressure. Subsequent volume-driven gains above the pivot point may trigger a proper technical buy signal.
Volume and volatility often increase near earnings news. It reported Mar '17 quarterly earnings +38% on +39% sales revenues after the close today, continuing its streak of earnings increases above the +25% minimum guideline (C criteria). Earnings rose +47% on +31% sales revenues for the Dec '16 quarter, . Recent years showed strong annual earnings (A criteria) increases after a slight downturn in FY '13 and '14.
It completed a new Public Offering on 2/05/15. The number of top-rated funds owning its shares rose from 351 in Jun '16 to 382 in Mar '17. The current Up/Down Volume Ratio is 2.0, a reassuring sign its shares have been under institutional accumulation over the past 50 days (I criteria). Its Timeliness Rating is A and Sponsorship Rating is C. Its small supply of only 26.6 million shares in the public float (S criteria) can contribute to greater price volatility in the event of institutional buying or selling.