There are no featured stock write-ups on MLR proir to 2/18/2025
 Upgrade your membership to see all of the expert analysis we have published on MLR now!
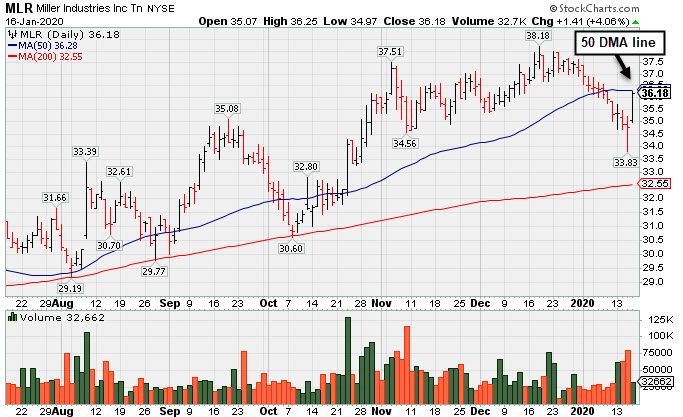
Rebound Near 50-Day Average But Concerns Remain - Thursday, January 16, 2020
Miller Industries Inc (MLR +$1.41 or +4.06% to $36.18) posted a big gain today with below average volume. It rebounded near its 50-day moving average (DMA) line ($36.36) which may act as resistance. Its current Relative Strength Rating of 76 is below the 80+ minimum guideline for buy candidates. It will be dropped from the Featured Stocks list tonight.
MLR has sputtered since reporting earnings which were below the fundamental guidelines of the fact-based investment system. It reported earnings -7% on +0% sales revenues for the Sep '19 quarter versus the year ago period, below the +25% minimum guideline (C criteria) raising fundamental concerns.
MLR's annual earnings history (A criteria) has been good. The very small supply of only 11.4 million shares outstanding (S criteria) can contribute to greater price volatility in the event of institutional buying or selling. It returned to the Featured Stocks list on 9/24/19 when highlighted in yellow in the mid-day report (read here). It was last shown in this FSU section on 12/27/19 with an annotated graph under the headline, "Towing/Recovery Equipment Firm Remains Perched Near Record High".
The number of top-rated funds owning its shares rose from 196 in Mar '18 to 251 in Dec '19, a reassuring sign concerning the I criteria. The current Up/Down Volume Ratio of 0.9 is an unbiased indication its shares have been under slight distributional pressure over the past 50 days. It has earned a C Timeliness rating and a D Sponsorship Rating.
Charts courtesy of www.stockcharts.com
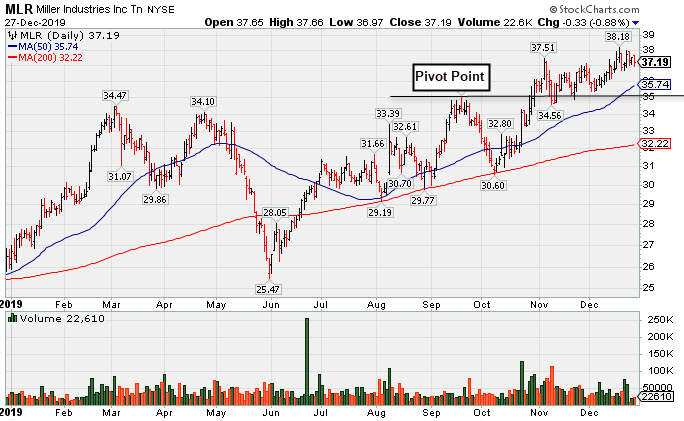
Towing/Recovery Equipment Firm Remains Perched Near Record High - Friday, December 27, 2019
Miller Industries Inc (MLR -$0.33 or -0.88% to $37.19) is still hovering near its 52-week high and just above its "max buy" level. Prior highs in the $35 area define initial support along with its 50-day moving average (DMA) line ($35.74).
MLR has shown resilience after recently reporting earnings which were below the fundamental guidelines of the fact-based investment system. It reported earnings -7% on +0% sales revenues for the Sep '19 quarter versus the year ago period, below the +25% minimum guideline (C criteria) raising fundamental concerns.
MLR's annual earnings history (A criteria) has been good. The very small supply of only 11.4 million shares outstanding (S criteria) can contribute to greater price volatility in the event of institutional buying or selling. It returned to the Featured Stocks list on 9/24/19 when highlighted in yellow in the mid-day report (read here). It was last shown in this FSU section on 12/04/19 with an annotated graph under the headline, "Miller Still Quietly Hovering Above Prior Highs"
The number of top-rated funds owning its shares rose from 196 in Mar '18 to 250 in Sep '19, a reassuring sign concerning the I criteria. The current Up/Down Volume Ratio of 1.4 is an unbiased indication its shares have been under accumulation over the past 50 days. It has earned a B Timeliness rating and a E Sponsorship Rating.
Charts courtesy of www.stockcharts.com
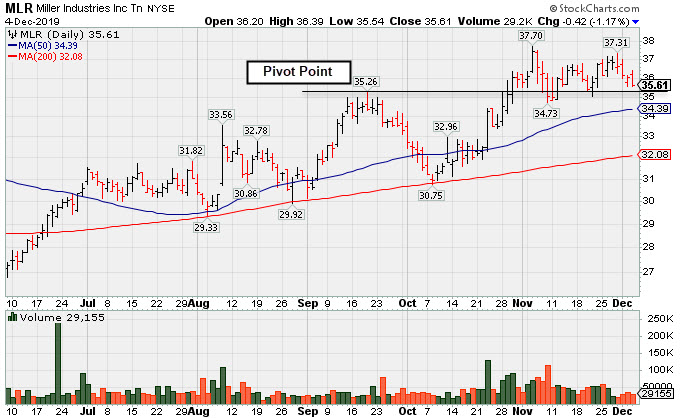
Miller Still Quietly Hovering Above Prior Highs - Wednesday, December 4, 2019
Miller Industries Inc (MLR -$0.42 or -1.17% to $35.61) pulled back today for a 4th consecutive loss with light volume, yet still remains perched near its 52-week high. Prior highs in the $35 area define initial support above its 50 DMA line ($34.39).
MLR has shown resilience after recently reporting earnings which were below the fundamental guidelines of the fact-based investment system. It reported earnings -7% on +0% sales revenues for the Sep '19 quarter versus the year ago period, below the +25% minimum guideline (C criteria) raising fundamental concerns.
MLR's annual earnings history (A criteria) has been good. The very small supply of only 11.4 million shares outstanding (S criteria) can contribute to greater price volatility in the event of institutional buying or selling. It returned to the Featured Stocks list on 9/24/19 when highlighted in yellow in the mid-day report (read here). It was last shown in this FSU section on 11/15/19 with an annotated graph under the headline, "Showing Resilience After Latest Quarter Missed Minimum Guidelines"
The number of top-rated funds owning its shares rose from 196 in Mar '18 to 250 in Sep '19, a reassuring sign concerning the I criteria. The current Up/Down Volume Ratio of 0.9 is an unbiased indication its shares have been under slight distributional pressure over the past 50 days. It has earned a C Timeliness rating and a E Sponsorship Rating.
Charts courtesy of www.stockcharts.com
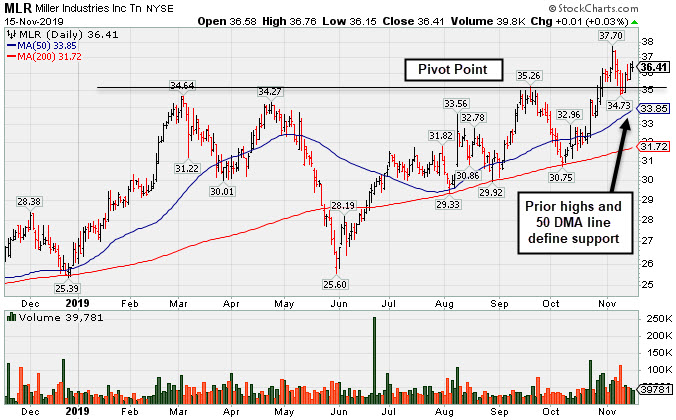
Showing Resilience After Latest Quarter Missed Minimum Guidelines - Friday, November 15, 2019
Miller Industries Inc (MLR +$0.01 or +0.03% to $36.41) remains perched near its all-time high. It reported earnings -7% on +0% sales revenues for the Sep '19 quarter versus the year ago period, below the +25% minimum guideline (C criteria) raising fundamental concerns. It retreated from its 52-week high with recent losses backed by above average volume. Prior highs in the $35 area define initial support above its 50-day moving average (DMA) line ($33.85).
MLR's annual earnings history (A criteria) has been good. The very small supply of only 11.4 million shares outstanding (S criteria) can contribute to greater price volatility in the event of institutional buying or selling. It returned to the Featured Stocks list on 9/24/19 when highlighted in yellow in the mid-day report (read here). It was last shown in this FSU section on 10/29/19 with an annotated graph under the headline, "Hit New High But Did Not Close Session Above Pivot Point"
The number of top-rated funds owning its shares rose from 196 in Mar '18 to 250 in Sep '19, a reassuring sign concerning the I criteria. The current Up/Down Volume Ratio of 1.1 is an unbiased indication its shares have been under only slight accumulation over the past 50 days. It has earned a B Timeliness rating and a E Sponsorship Rating.
Charts courtesy of www.stockcharts.com
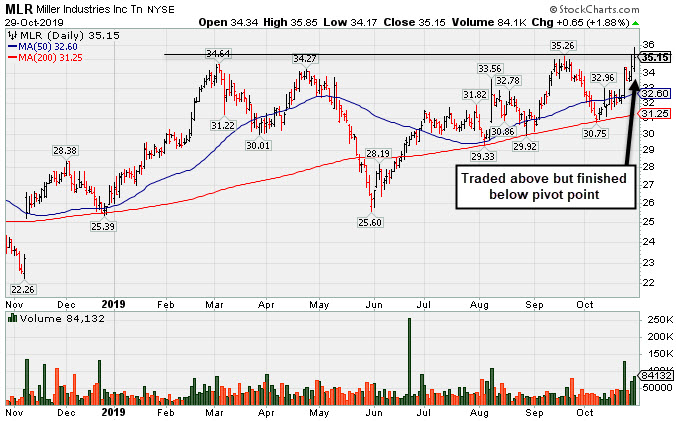
Hit New High But Did Not Close Session Above Pivot Point - Tuesday, October 29, 2019
Miller Industries Inc (MLR +$0.65 or +1.88% to $35.15) traded above but finished the session below its pivot point. Subsequent gains and a close above the pivot point backed by at least +40% above average volume may trigger a technical buy signal.
Keep in mind it is due to report earnings news on November 7th. Volume and volatility often increase near earnings news. June '19 quarterly earnings rose +40% on +26% sales revenues versus the year ago period, and 3 of the past 4 comparisons were above the +25% minimum earnings guideline (C criteria). Annual earnings history (A criteria) has also been good. Very small supply of only 11.4 million shares outstanding (S criteria) can contribute to greater price volatility in the event of institutional buying or selling.
MLR returned to the Featured Stocks list on 9/24/19 when highlighted in yellow in the mid-day report (read here). It has shown bullish action since last shown in this FSU section on 10/09/19 with an annotated graph under the headline, "Tested Support at Long-Term 200-Day Moving Average"
The number of top-rated funds owning its shares rose from 196 in Mar '18 to 249 in Sep '19, a reassuring sign concerning the I criteria. The current Up/Down Volume Ratio of 1.2 is an unbiased indication its shares have been under accumulation over the past 50 days. It has earned a B Timeliness rating and a E Sponsorship Rating.
Charts courtesy of www.stockcharts.com
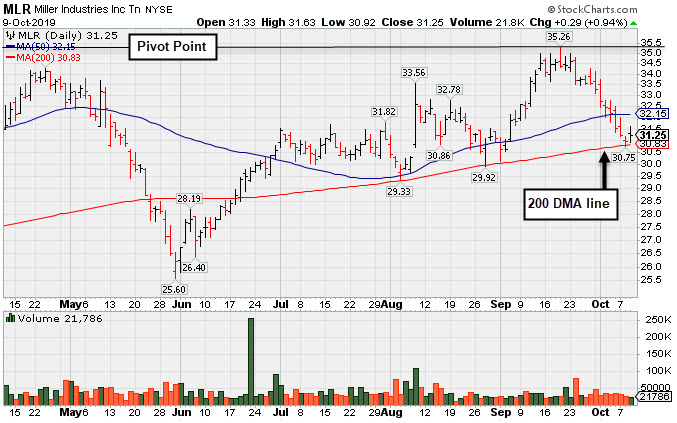
Tested Support at Long-Term 200-Day Moving Average - Wednesday, October 9, 2019
Miller Industries Inc (MLR +$0.29 or +0.94% to $31.25) halted its slide today at its 200-day moving average (DMA) line ($31.15). More damagaing losses would raise serious concerns. Its color code was changed to green after violating its 50 DMA line ($32.24) during a streak of noted losses. A rebound above the 50 DMA line is needed for its outlook to improve. Subsequent gains above the pivot point backed by at least +40% above average volume may trigger a technical buy signal.
June '19 quarterly earnings rose +40% on +26% sales revenues versus the year ago period, and 3 of the past 4 comparisons were above the +25% minimum earnings guideline (C criteria). Annual earnings history (A criteria) has also been good. Very small supply of only 11.4 million shares outstanding (S criteria) can contribute to greater price volatility in the event of institutional buying or selling.
MLR was dropped from the Featured Stocks list on 5/22/19 and went through a choppy consolidation below its 200-day moving average then rebounded. It returned to the Featured Stocks list on 9/24/19 when highlighted in yellow in the mid-day report (read here) and shown in this FSU section that evening with an annotated graph under the headline, "Encountered Distributional Pressure After Challenging Prior High".
The number of top-rated funds owning its shares rose from 196 in Mar '18 to 236 in Sep '19, a reassuring sign concerning the I criteria. The current Up/Down Volume Ratio of 0.9 is an unbiased indication its shares have been under slight distributional pressure over the past 50 days. It has earned an B Timeliness rating and a E Sponsorship Rating.
Charts courtesy of www.stockcharts.com
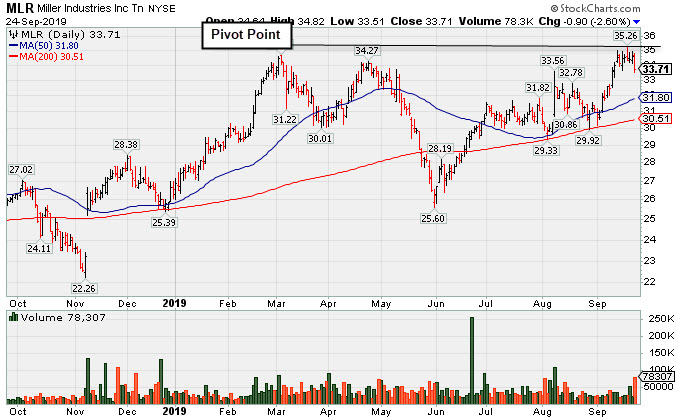
Encountered Distributional Pressure After Challenging Prior High - Tuesday, September 24, 2019
Miller Industries Inc (MLR -$0.90 or -2.60% to $33.71) finished with a loss on higher volume today, indicative of distributional pressure, after highlighted in yellow with new pivot point cited based on its 3/05/19 high plus 10 cents (read here). It was noted - ":Subsequent gains above the pivot point backed by at least +40% above average volume may trigger a technical buy signal. Very little resistance remains due to overhead supply."
June '19 quarterly earnings rose +40% on +26% sales revenues versus the year ago period, and 3 of the past 4 comparisons were above the +25% minimum earnings guideline (C criteria). Annual earnings history (A criteria) has also been good. Very small supply of only 11.4 million shares outstanding (S criteria) can contribute to greater price volatility in the event of institutional buying or selling.
MLR was dropped from the Featured Stocks list on 5/22/19 and went through a choppy consolidation below its 200-day moving average then rebounded since last shown in this FSU section on 4/08/19 with an annotated graph under the headline, "Below 50-Day Average After Damaging Losses".
The number of top-rated funds owning its shares rose from 196 in Mar '18 to 247 in Jun '19, a reassuring sign concerning the I criteria. The current Up/Down Volume Ratio of 1.4 is an unbiased indication its shares have been under accumulation over the past 50 days. It has earned an B Timeliness rating and a D Sponsorship Rating.
Charts courtesy of www.stockcharts.com
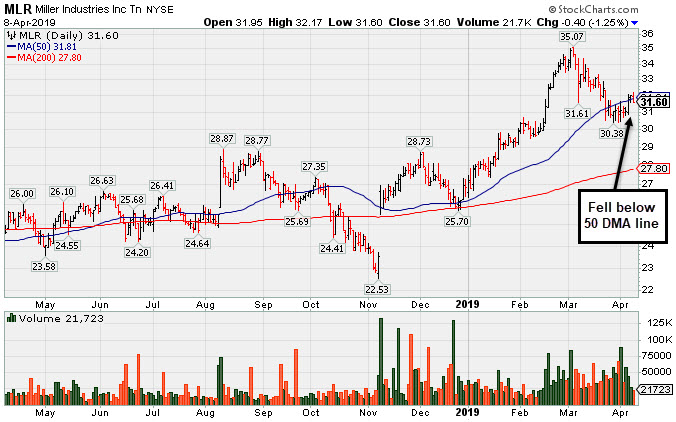
Below 50-Day Average After Damaging Losses - Monday, April 8, 2019
Miller Industries Inc (MLR -$0.40 or -1.25% to $31.60) fell back on light volume and closed below its 50-day moving average (DMA) line ($31.93). Prior highs in the $29 area define the next near-term support to watch.
Recently it reported earnings +17% on +13% sales revenues for the Dec '18 quarter, below the +25% minimum guideline (C criteria), raising fundamental concerns, and it has endured mild distributional pressure in recent weeks. MLR was last shown in this FSU section on 3/01/19 with an annotated graph under the headline, "Extended From Prior Base After Impressive Streak of Gains".
Prior quarterly comparisons had been above the +25% minimum earnings guideline (C criteria) and, sequentially, showed encouraging sales revenues acceleration. Annual earnings history (A criteria) has also been good. Very small supply of only 11.4 million shares outstanding (S criteria) can contribute to greater price volatility in the event of institutional buying or selling.
The number of top-rated funds owning its shares rose from 196 in Mar '18 to 223 in Dec '18, a reassuring sign concerning the I criteria. The current Up/Down Volume Ratio of 1.7 is an unbiased indication its shares have been neutral concerning accumulation/distribution over the past 50 days. It has earned an A Timeliness rating and a D Sponsorship Rating.
Charts courtesy of www.stockcharts.com
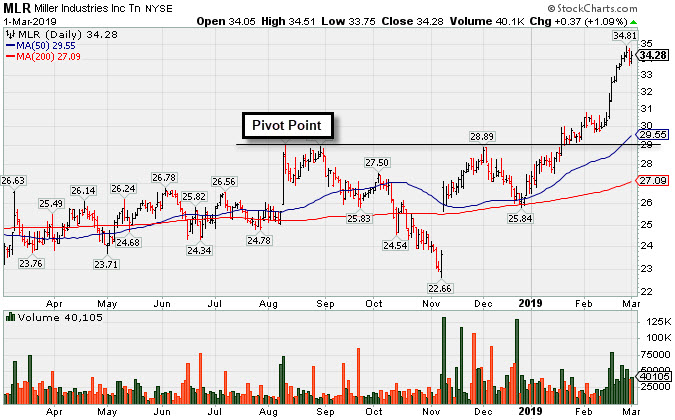
Extended From Prior Base After Impressive Streak of Gains - Friday, March 1, 2019
Miller Industries Inc (MLR +$0.37 or +1.09% to $34.28) is very extended from the prior base and perched near its all-time high following an impressive streak of 11 consecutive gains. Prior highs and its 50-day moving average (DMA) line ($29.55) define near-term support to watch on pullbacks.
Keep in mind that it is due to report earnings news on Wednesday, March 6th after the close. Volume and volatility often increase near earnings news. MLR was last shown in this FSU section on 1/29/19 with an annotated graph under the headline, "Traded Above Pivot Point Recently Without Great Volume".
It reported earnings +95% on +28% sales revenues for the Sep '18 quarter. Recent quarterly comparisons have been above the +25% minimum earnings guideline (C criteria) and, sequentially, showed encouraging sales revenues acceleration. Annual earnings history (A criteria) has also been good. Very small supply of only 11.4 million shares outstanding (S criteria) can contribute to greater price volatility in the event of institutional buying or selling.
The number of top-rated funds owning its shares rose from 196 in Mar '18 to 224 in Dec '18, a reassuring sign concerning the I criteria. The current Up/Down Volume Ratio of 1.8 is an unbiased indication its shares have been neutral concerning accumulation/distribution over the past 50 days. It has earned an A Timeliness rating and a C Sponsorship Rating.
Charts courtesy of www.stockcharts.com
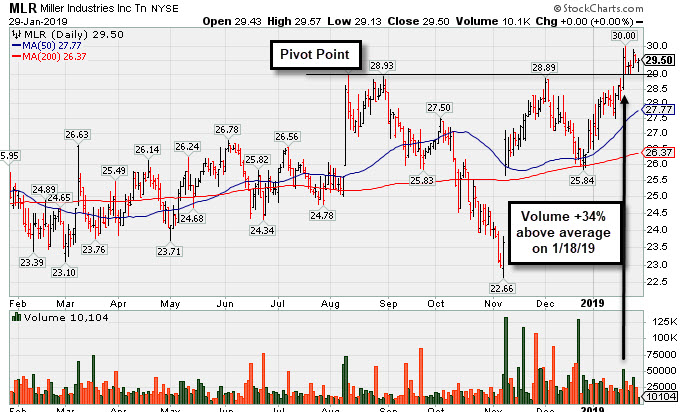
Traded Above Pivot Point Recently Without Great Volume - Tuesday, January 29, 2019
Miller Industries Inc (MLR $29.50) held its ground today with light volume. No resistance remains due to overhead supply. Subsequent gains above the pivot point backed by at least +40% above average volume may help clinch a proper technical buy signal. Its 50-day moving average (DMA) line ($27.80) defines near-term support to watch on pullbacks.
Disciplined investors will note that it did not produce the gains above the pivot point backed by at least +40% above average volume needed to trigger a technical buy signal after last shown in this FSU section on 1/08/19 with an annotated graph under the headline, "Perched Within Close Striking Distance of Prior High".
It encountered distributional pressure after highlighted in yellow with pivot point cited based on its 8/10/18 high plus 10 cents in the 11/30/18 mid-day report (read here).
It reported earnings +95% on +28% sales revenues for the Sep '18 quarter. Recent quarterly comparisons have been above the +25% minimum earnings guideline (C criteria) and, sequentially, showed encouraging sales revenues acceleration. Annual earnings history (A criteria) has also been good. Very small supply of only 11.4 million shares outstanding (S criteria) can contribute to greater price volatility in the event of institutional buying or selling.
The number of top-rated funds owning its shares rose from 196 in Mar '18 to 219 in Dec '18, a reassuring sign concerning the I criteria. The current Up/Down Volume Ratio of 1.2 is an unbiased indication its shares have been neutral concerning accumulation/distribution over the past 50 days. It has earned an A Timeliness rating and a C Sponsorship Rating.
Charts courtesy of www.stockcharts.com
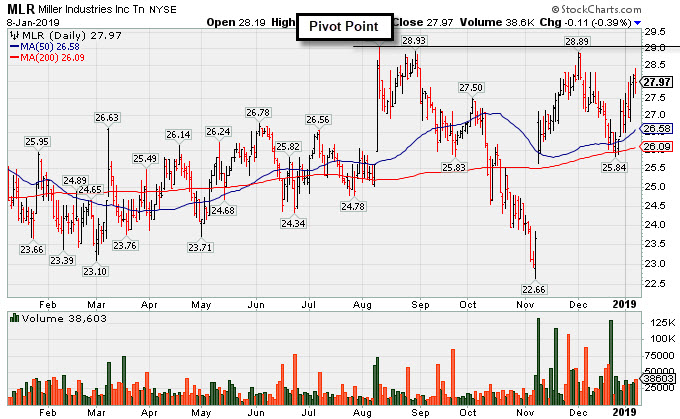
Perched Within Close Striking Distance of Prior High - Tuesday, January 8, 2019
Miller Industries Inc (MLR -$0.11 or -0.39% to $27.97) is consolidating above its closely coinciding 50-day and 200-day moving average (DMA) lines. Little resistance remains due to overhead supply up to the $29 level. Subsequent gains above the pivot point backed by at least +40% above average volume are needed to trigger a technical buy signal. It encountered distributional pressure in recent weeks after highlighted in yellow with pivot point cited based on its 8/10/18 high plus 10 cents in the 11/30/18 mid-day report (read here).
Disciplined investors will note that it did not produce the gains above the pivot point backed by at least +40% above average volume needed to trigger a technical buy signal after last shown in this FSU section on 12/20/18 with an annotated graph under the headline, "Failed to Produce Buy Signal and Deterioration Raised Concern".
It reported earnings +95% on +28% sales revenues for the Sep '18 quarter. Recent quarterly comparisons have been above the +25% minimum earnings guideline (C criteria) and, sequentially, showed encouraging sales revenues acceleration. Annual earnings history (A criteria) has also been good. Very small supply of only 11.4 million shares outstanding (A criteria) can contribute to greater price volatility in the event of institutional buying or selling.
The number of top-rated funds owning its shares rose from 196 in Mar '18 to 226 in Sep '18, a reassuring sign. The current Up/Down Volume Ratio of 1.4 is an unbiased indication its shares have been neutral concerning accumulation/distribution over the past 50 days. It has earned an A Timeliness rating and a C Sponsorship Rating.
Charts courtesy of www.stockcharts.com
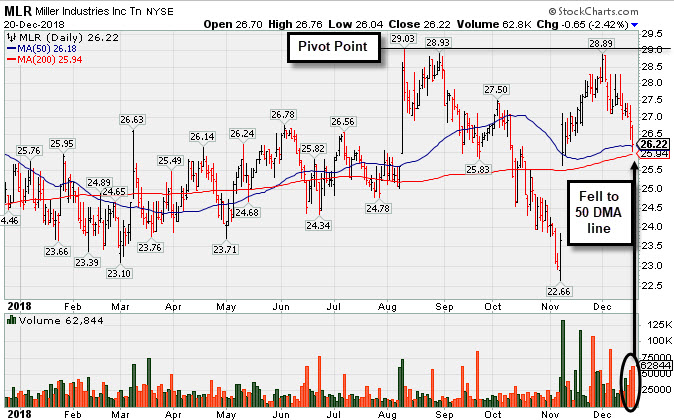
Failed to Produce Buy Signal and Deterioration Raised Concern - Thursday, December 20, 2018
Miller Industries Inc (MLR -$0.65 or -2.42% to $26.22) fell and its color code was changed to green after a gap down today. It violated both its 50-day and 200-day moving average (DMA) lines with a damaging loss triggering a technical sell signal and raising serious concerns. Resistance remains due to overhead supply up to the $29 level. A rebound and subsequent gains above the pivot point backed by at least +40% above average volume are needed to trigger a technical buy signal.
It encountered distributional pressure and finished lower after highlighted in yellow with pivot point cited based on its 8/10/18 high plus 10 cents in the 11/30/18 mid-day report (read here). Disciplined investors will note that it did not produce the gains above the pivot point backed by at least +40% above average volume needed to trigger a technical buy signal after last shown in this FSU section on 12/03/18 with an annotated graph under the headline, "Perched Within Striking Distance of All Time High".
It reported earnings +95% on +28% sales revenues for the Sep '18 quarter. Recent quarterly comparisons have been above the +25% minimum earnings guideline (C criteria) and, sequentially, showed encouraging sales revenues acceleration. Annual earnings history (A criteria) has also been good. Very small supply of only 11.4 million shares outstanding (A criteria) can contribute to greater price volatility in the event of institutional buying or selling.
The number of top-rated funds owning its shares rose from 196 in Mar '18 to 222 in Sep '18, a reassuring sign. The current Up/Down Volume Ratio of 1.0 is an unbiased indication its shares have been neutral concerning accumulation/distribution over the past 50 days. It has earned an A Timeliness rating and a C Sponsorship Rating.
Charts courtesy of www.stockcharts.com
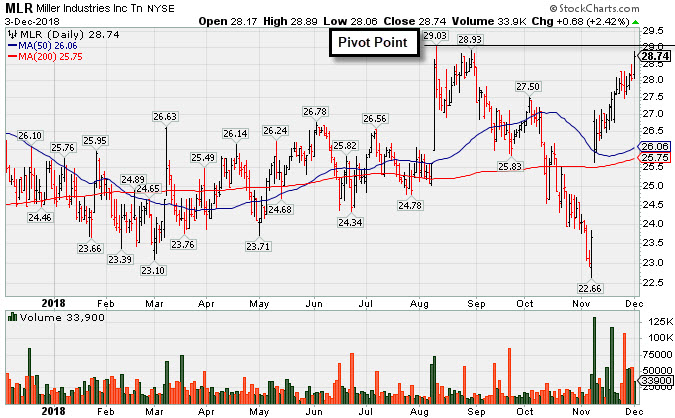
Perched Within Striking Distance of All Time High - Monday, December 3, 2018
Miller Industries Inc (MLR +$0.68 or +2.42% to $28.74) posted a gain today on lighter (but above average) volume. It encountered distributional pressure and finished lower after highlighted in yellow with pivot point cited based on its 8/10/18 high plus 10 cents in the 11/30/18 mid-day report (read here). It faces very little resistance due to overhead supply up to the $29 level. Subsequent gains above the pivot point backed by at least +40% above average volume are needed to trigger a technical buy signal.
Reported earnings +95% on +28% sales revenues for the Sep '18 quarter. Recent quarterly comparisons have been above the +25% minimum earnings guideline (C criteria) and, sequentially, showed encouraging sales revenues acceleration. Annual earnings history (A criteria) has also been good. Very small supply of only 11.4 million shares outstanding (A criteria) can contribute to greater price volatility in the event of institutional buying or selling.
The number of top-rated funds owning its shares rose from 196 in Mar '18 to 216 in Sep '18, a reassuring sign. The current Up/Down Volume Ratio of 1.2 is an unbiased indication its shares have been under accumulation over the past 50 days. It has earned an A Timeliness rating and a B Sponsorship Rating.
Charts courtesy of www.stockcharts.com
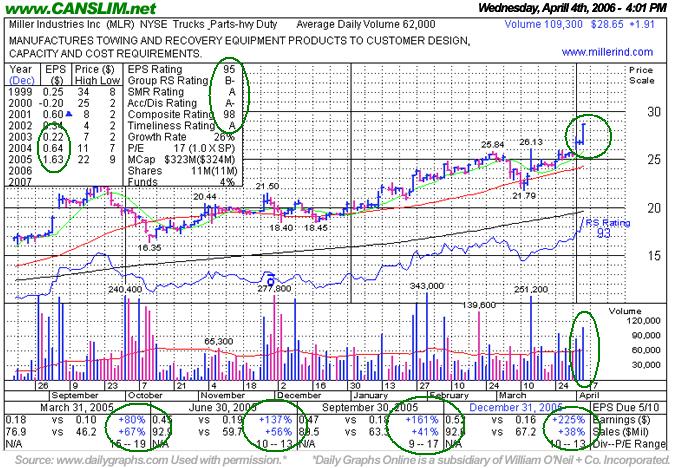
Very Healthy Post Breakout Action - Wednesday, April 05, 2006
A classic example of the success enjoyed by many CANSLIM.net readers usually starts when an investor reads a CANSLIM.net report and buys a featured stock before it has risen above the pivot point by greater than 5%. After a stock breaks out above its pivot point, there is only a +5% window that investors have to purchase the stock under the proper guidelines. Once a stock rises above the "maximum buy price" the risk of a shake out balloons, meaning that even a normal retracement in the stock might force you to employ the 7-8% loss cutting rule. Much can be told by the stock's daily action in the weeks and months that follow a breakout. Typically, a light volume and orderly pullback suggests that the bulls remain in control. However, high volume pullbacks that violate support paint a totally different picture.
Miller Industries Inc. (MLR +1.91 or +6.25% to $28.65) surged to a new 52-week high close on more than twice its daily average volume. This stock was featured two days ago (Monday, April 3rd, 2006) in the CANSLIM.net Mid-Day Breakouts Report (read here) with a $26.09 pivot point. MLR has managed to steadily increase its quarterly results at a very healthy rate, and the action shows its shares being rewarded properly for that feat. This issue is an excellent example of healthy post-breakout action. Only a reversal back into the prior base and close back under the February 28th, 2006 high close of $25.50 would prompt concern, as such deterioration would negate the latest breakout and have the stock falling back into its prior base. Discipline always dictates limiting losses at 7-8% from your cost to prevent more severe losses. Caution about chasing the stock and buying more than +5% above the pivot point is warranted, because the big gain today took it beyond the "max buy" level. Otherwise, this issue appears poised to continue advancing and the bulls remain in control.