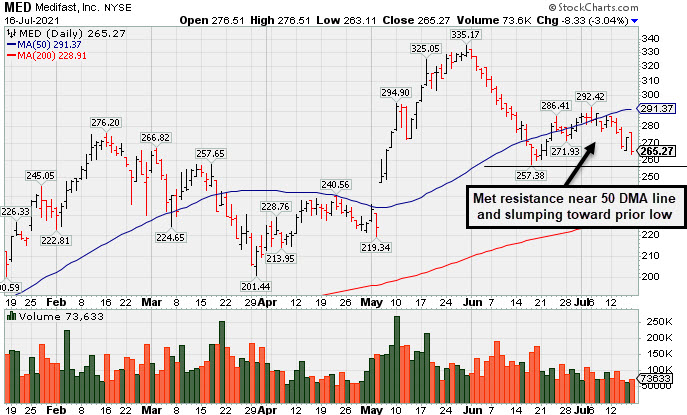
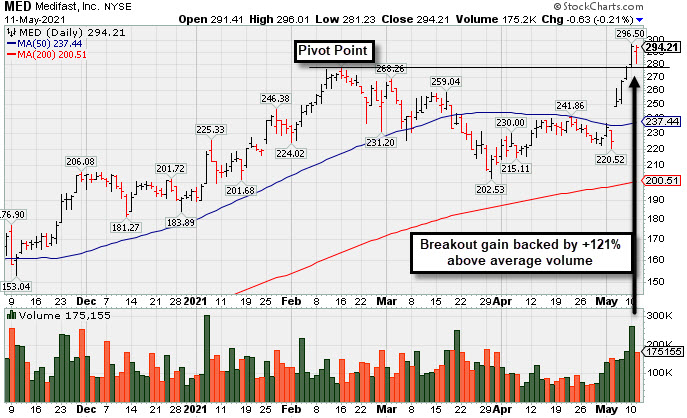
MED was highlighted in yellow in the 5/11/21 mid-day report (read here) with pivot point cited based on its 2/16/21 high plus 10 cents. It was shown in this FSU section that evening with an annotated graph under the headline, "Halted 10-Session Losing Streak Near Prior High and 50 DMA".
Recently it reported Mar '21 quarterly earnings +79% on +91% sales revenues versus the year ago period, marking its 3rd consecutive quarterly comparison above the +25% minimum guideline (C criteria), helping it better match with winning models of the fact-based investment system. Annual earnings (A criteria) history has been strong.
The Cosmetics - Personal Care firm has only 11.8 million shares outstanding (S criteria) which can contribute to greater price volatility in the event of institutional buying or selling. The number of top-rated funds owning its shares rose from 425 in Jun '20 to 561 in Jun '21, a reassuring sign concerning the I criteria. Its current Up/Down Volume Ratio of 0.9 is an unbiased indication its shares have been under slight distributional pressure over the past 50 days.