Manhattan Associates Consolidating Above 50-Day Moving Average - Monday, March 25, 2024
Manhattan Associates Inc (MANH -$2.33 or -0.93% to $248.51) closed just -6.9% off its all-time high today and volume totals have been cooling. Its 50-day moving average (DMA) line ($242.87) defines near-term support to watch above the prior low ($239.14 on 2/21/24). More damaging losses could raise concerns and trigger technical sell signals.
MANH was highlighted in yellow with pivot point cited based on its 11/29/23 high plus 10 cents in the 1/31/24 mid-day report (read here). It was last shown in great detail on 2/29/24 with an annotated graph under the headline, "Hovering Near All-Time High After Streak of Small Gains".
Earnings increases were above the +25% minimum guideline in the 5 latest quarterly comparisons through Dec '23. Annual earnings growth has been strong. It has a 96 Earnings Per Share (EPS) rating. Its Relative Strength rating is 89. It has a small supply of 61.6 million shares (S criteria) outstanding, which can contribute to volatility in the event of institutional buying or selling. The number of top-rated funds owning its shares rose from 849 in Mar '23 to 1,296 in Dec '23, a reassuring sign concerning the I criteria.
Charts courtesy www.stockcharts.com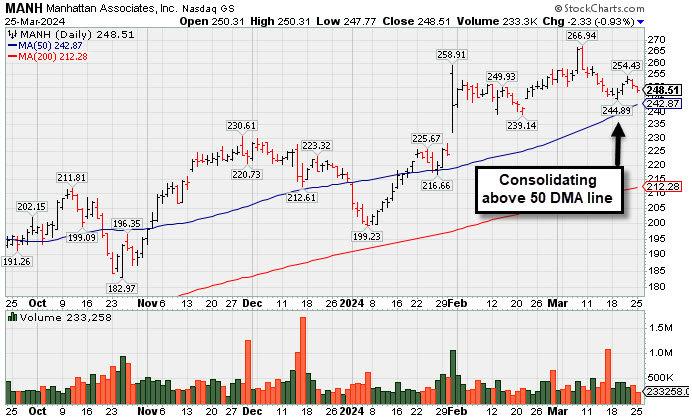
Hovering Near All-Time High After Streak of Small Gains - Thursday, February 29, 2024
Manhattan Associates Inc (MANH -$0.68 or -0.27% to $253.33) challenged its all-time high today following 5 consecutive small gains. Prior highs in the $230 area and its 50-day moving average (DMA) define near-term support to watch on pullbacks.
MANH closed in the middle of its intra-day range after highlighted in yellow with pivot point cited based on its 11/29/23 high plus 10 cents in the 1/31/24 mid-day report (read here). It was shown in greater detail on 1/31/24 with an annotated graph under the headline, "Big Volume Behind Breakout Gain".
Earnings increases were above the +25% minimum guideline in the 5 latest quarterly comparisons through Dec '23. Annual earnings growth has been strong. It has a 96 Earnings Per Share (EPS) rating. Its Relative Strength rating is 90. It has a small supply of 61.6 million shares (S criteria) outstanding, which can contribute to volatility in the event of institutional buying or selling. The number of top-rated funds owning its shares rose from 849 in Mar '23 to 1,272 in Dec '23, a reassuring sign concerning the I criteria.
Charts courtesy www.stockcharts.com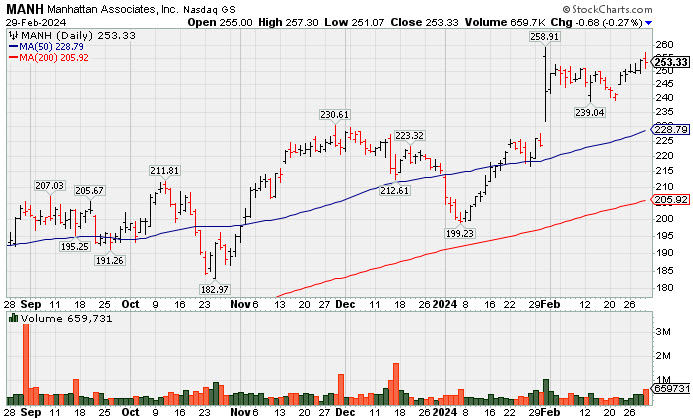
Big Volume Behind Breakout Gain - Wednesday, January 31, 2024
Manhattan Associates Inc (MANH +$18.78 or +8.39% to $242.56) closed in the middle of its intra-day range after highlighted in yellow with pivot point cited based on its 11/29/23 high plus 10 cents in the earlier mid-day report (read here). It gapped up today hitting a new 52-week high with gain backed by +153% above average volume triggering a technical buy signal.
Earnings increases were above the +25% minimum guideline in the 5 latest quarterly comparisons through Dec '23. Annual earnings growth has been strong. It has a 96 Earnings Per Share (EPS) rating. Its Relative Strength rating is 93. It has a small supply of 61.6 million shares (S criteria) outstanding, which can contribute to volatility in the event of institutional buying or selling. The number of top-rated funds owning its share rose from 849 in Mar '23 to 1,239 in Sep '15, a reassuring sign concerning the I criteria.
Charts courtesy www.stockcharts.com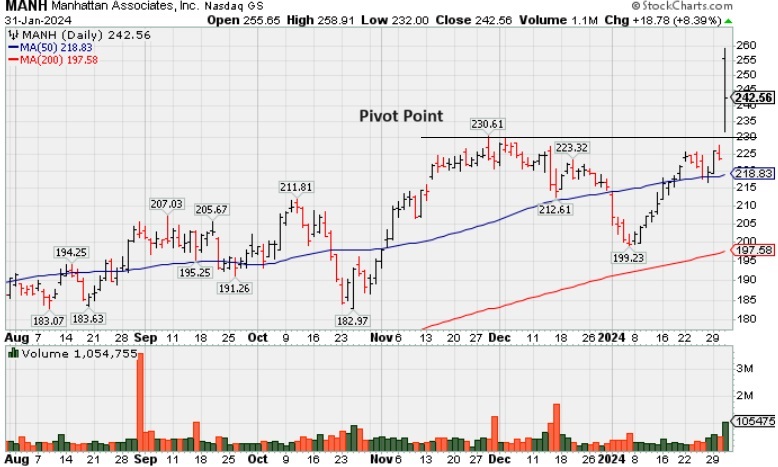
Falters and Slumps Into Prior Base Raising Concerns - Wednesday, December 23, 2015
Manhattan Associates Inc (MANH +$0.17 or +0.25% to $69.28) met resistance at its 50-day moving average (DMA) line and slumped below the recent low ($69.85 on 12/11/15) and back into the previous base. The weak action raised more serious concerns and triggered a technical sell signal. It suffered the damage after last shown in this FSU section on 12/09/15 with an annotated graph under then headline, "Consolidating Above Prior Highs and 50-Day Moving Average". MANH was highlighted in yellow with pivot point cited based on its 7/23/15 high plus 10 cents in the 10/21/15 mid-day report (read here).
It reported earnings +31% on +13% sales revenues for the Sep '15 quarter, its 4th consecutive quarterly comparison above the +25% minimum earnings guideline (C criteria). Earnings were +25%, +31%, +28%, and +31% in the Dec '14, Mar, Jun, and Sep '15 quarters, respectively, versus the year ago periods. Sales revenues rose +21%, +18%, +14%, and +13% during that same span. Following a downturn in its FY '09 earnings (A criteria) it has shown strong earnings growth.
The Computer Software group has shown a good leadership (L criteria). MANH has a 98 Earnings Per Share (EPS) rating. Its Relative Strength line recently rallied to new highs ahead of the shares' move into new high territory, a reassuring sign. It has a small supply of 73.1 million shares (S criteria) outstanding, which can contribute to volatility in the event of institutional buying or selling. The number of top-rated funds owning its share rose from 422 in Dec '14 to 529 in Sep '15, a reassuring sign concerning the I criteria.
Charts courtesy www.stockcharts.com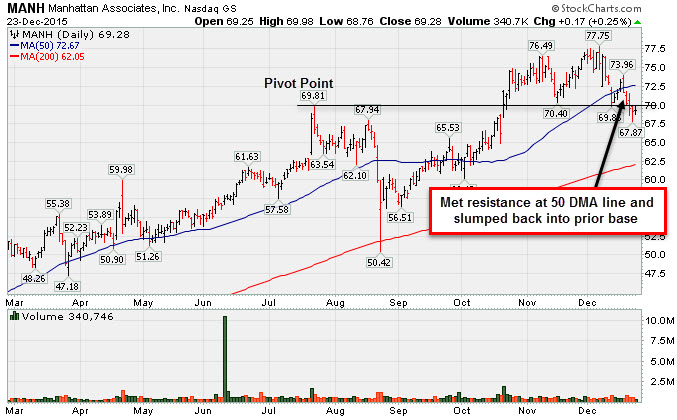
Consolidating Above Prior Highs and 50-Day Moving Average - Wednesday, December 9, 2015
Manhattan Associates Inc (MANH -$2.69 or -3.52% to $73.75) has been pulling back after recently wedging to new highs with gains lacking great volume conviction. Prior highs in the $69 area and its 50-day moving average (DMA) line define support to watch on pullbacks.
It was last shown in this FSU section on 11/18/15 with an annotated graph under the headline, "Consolidating Above Prior Highs and 50-Day Moving Average". It was highlighted in yellow with pivot point cited based on its 7/23/15 high plus 10 cents in the 10/21/15 mid-day report (read here).
It reported earnings +31% on +13% sales revenues for the Sep '15 quarter, its 4th consecutive quarterly comparison above the +25% minimum earnings guideline (C criteria). Earnings were +25%, +31%, +28%, and +31% in the Dec '14, Mar, Jun, and Sep '15 quarters, respectively, versus the year ago periods. Sales revenues rose +21%, +18%, +14%, and +13% during that same span. Following a downturn in its FY '09 earnings (A criteria) it has shown strong earnings growth.
The Computer Software group has shown a good leadership (L criteria). MANH has a 98 Earnings Per Share (EPS) rating. Its Relative Strength line recently rallied to new highs ahead of the shares' move into new high territory, a reassuring sign. It has a small supply of 73.1 million shares (S criteria) outstanding, which can contribute to volatility in the event of institutional buying or selling. The number of top-rated funds owning its share rose from 422 in Dec '14 to 530 in Sep '15, a reassuring sign concerning the I criteria. Its current Up/Down Volume Ratio of 1.8 is an unbiased indication its shares have been under accumulation over the past 50 days.
Charts courtesy www.stockcharts.com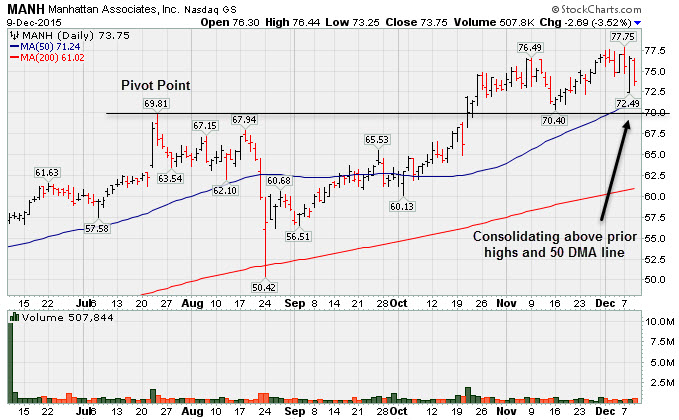
Consolidating Above Prior Highs and 50-Day Moving Average - Wednesday, November 18, 2015
Manhattan Associates Inc (MANH +$0.77 or +1.07% to $72.79) is consolidating below its "max buy" level. Prior highs in the $69 area and its 50-day moving average (DMA) line ($67.61) define important near-term support to watch on pullbacks. It was last shown in this FSU section on 11/02/15 with an annotated graph under the headline, "Prior Highs Define Support Following Recent Breakout". It was highlighted in yellow with pivot point cited based on its 7/23/15 high plus 10 cents in the 10/21/15 mid-day report (read here).
It reported earnings +31% on +13% sales revenues for the Sep '15 quarter, its 4th consecutive quarterly comparison above the +25% minimum earnings guideline (C criteria). Earnings were +25%, +31%, +28%, and +31% in the Dec '14, Mar, Jun, and Sep '15 quarters, respectively, versus the year ago periods. Sales revenues rose +21%, +18%, +14%, and +13% during that same span. Following a downturn in its FY '09 earnings (A criteria) it has shown strong earnings growth.
The Computer Software group has shown a good leadership (L criteria). MANH has a 98 Earnings Per Share (EPS) rating. Its Relative Strength line recently rallied to new highs ahead of the shares' move into new high territory, a reassuring sign. It has a small supply of 73.1 million shares (S criteria) outstanding, which can contribute to volatility in the event of institutional buying or selling. The number of top-rated funds owning its share rose from 422 in Dec '14 to 524 in Sep '15, a reassuring sign concerning the I criteria. Its current Up/Down Volume Ratio of 1.8 is an unbiased indication its shares have been under accumulation over the past 50 days.
Charts courtesy www.stockcharts.com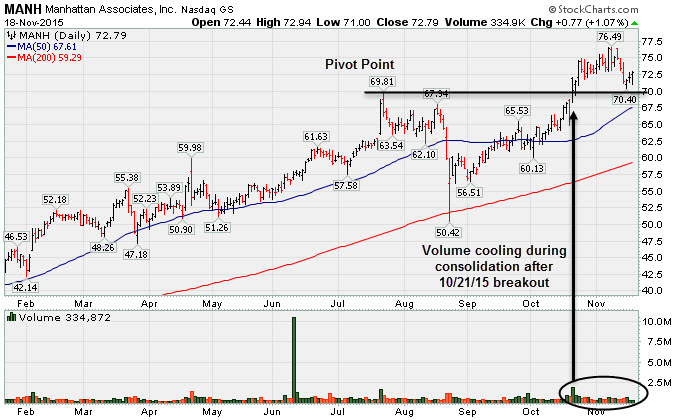
Prior Highs Define Support Following Recent Breakout - Monday, November 2, 2015
Manhattan Associates Inc (MANH +$1.12 or +1.54% to $73.97) is consolidating above its "max buy" level following volume-driven gains. Prior highs in the $69 area define initial support to watch on pullbacks.
It was last shown in this FSU section on 10/21/15 with an annotated graph under the headline, "Finished Strong With Gain Backed By Heavy Volume". The considerable gain helped it rise from a choppy 3-month base. It was highlighted in yellow with pivot point cited based on its 7/23/15 high plus 10 cents in the 10/21/15 mid-day report (read here).
It reported earnings +31% on +13% sales revenues for the Sep '15 quarter, its 4th consecutive quarterly comparison above the +25% minimum earnings guideline (C criteria). Earnings were +25%, +31%, +28%, and +31% in the Dec '14, Mar, Jun, and Sep '15 quarters, respectively, versus the year ago periods. Sales revenues rose +21%, +18%, +14%, and +13% during that same span.
The Computer Software group has shown a good leadership (L criteria). MANH has a 98 Earnings Per Share (EPS) rating. Its Relative Strength line recently rallied to new highs ahead of the shares' move into new high territory, a reassuring sign. It has a small supply of 73.1 million shares (S criteria) outstanding, which can contribute to volatility in the event of institutional buying or selling. The number of top-rated funds owning its share rose from 422 in Dec '14 to 512 in Sep '15, a reassuring sign concerning the I criteria. Its current Up/Down Volume Ratio of 1.6 is an unbiased indication its shares have been under accumulation over the past 50 days.
MANH was previously noted on 7/22/15 - "Patient investors may watch for a new base or secondary buy point to possibly develop and be noted in the weeks ahead. Following a downturn in its FY '09 earnings (A criteria) it has shown strong earnings growth."
Charts courtesy www.stockcharts.com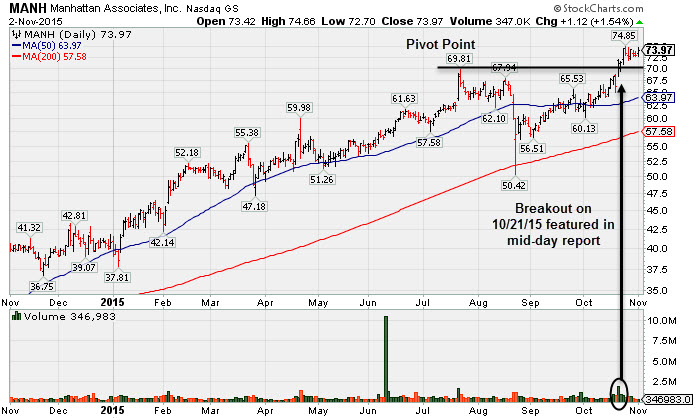
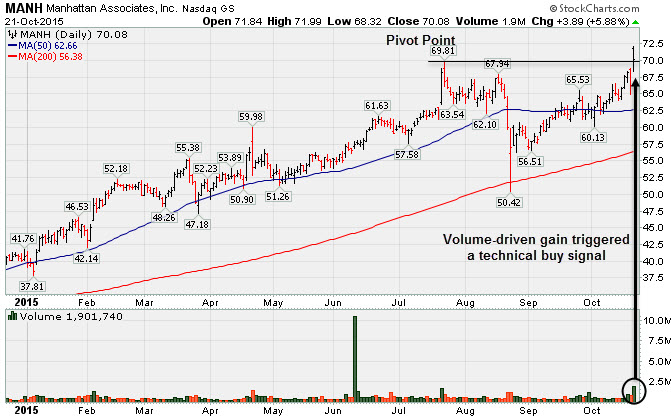
Finished Strong With Gain Backed By Heavy Volume - Wednesday, October 21, 2015
Manhattan Associates Inc (MANH +$3.89 or +5.88% to $70.08) hit a new all-time high with today's considerable gain while rising from a choppy 3-month base. It was highlighted in yellow with pivot point cited based on its 7/23/15 high plus 10 cents in the earlier mid-day report (read here). It reported earnings +31% on +13% sales revenues for the Sep '15 quarter, its 4th consecutive quarterly comparison above the +25% minimum earnings guideline (C criteria).
The Computer Software group has shown a good leadership (L criteria). MANH has a 98 Earnings Per Share (EPS) rating. Its Relative Strength line recently rallied to new highs ahead of the shares' move into new high territory, a reassuring sign. It has a small supply of 73.4 million shares (S criteria) outstanding, which can contribute to volatility in the event of institutional buying or selling.
MANH was previously noted on 7/22/15 - "Patient investors may watch for a new base or secondary buy point to possibly develop and be noted in the weeks ahead. Following a downturn in its FY '09 earnings (A criteria) it has shown strong earnings growth."
Charts courtesy www.stockcharts.com