Charts used courtesy of www.stockcharts.com
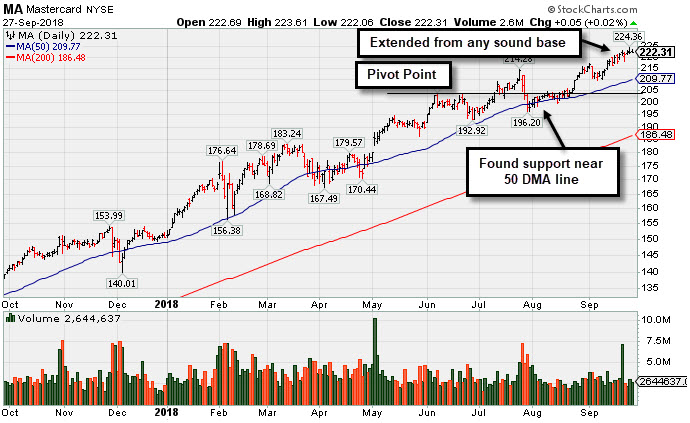
Mastercard Inc Cl A (MA +$0.05 or +0.02% to$222.31) has been hovering near its all-time high, extended from any sound base. Its 50-day moving average (DMA) line ($209.77) defines important near-term support to watch on pullbacks.
It was last shown in this FSU section on 8/10/18 with an annotated graph under the headline, "Found Support Near 50-Day Moving Average Line" It was highlighted in yellow in the 5/02/18 mid-day report (read here) as it rose above the pivot point cited based on its 3/13/18 high plus 10 cents with a big gain backed by +146% above average volume.
Fundamentals remain strong. For the quarter ended June 30, 2018 it reported a +51% earnings increase on +20% sales revenues versus the year-ago period, above +25% minimum quarterly earnings increase needed to satisfy the C criteria. It reported earnings increases +15%,+24%, +33% and +49% in the Jun, Sep, Dec '17 and Mar '18 quarterly comparisons, respectively, with sales revenues increases of +13%, +18%, +20% and +31% during that span. It has also maintained a strong annual earnings (A criteria) history.
The Finance - Credit Card/Payment Processing group has shown recent leadership (L criteria) that includes strong performing peers such as Visa Inc (V). The number of top-rated funds owning its shares rose from 2,802 in Jun '17 to 3,272 in Jun '18, however, it is already heavily owned by the institutional crowd (I criteria). Its current Up/Down Volume Ratio of 2.0 is an unbiased indication its shares have been under accumulation over the past 50 days. MA has a Timeliness Rating of A and Sponsorship Rating of B.
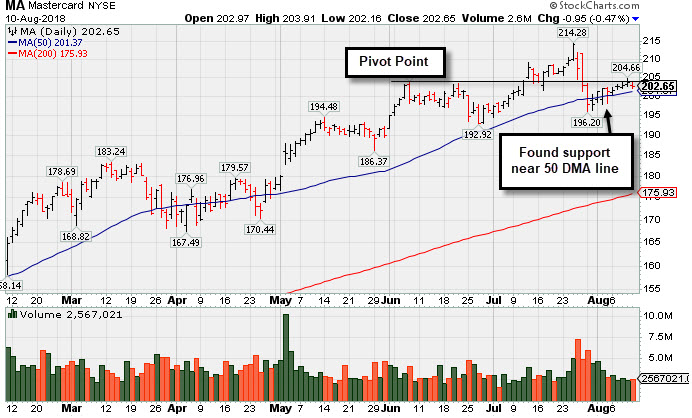
Mastercard Inc Cl A (MA -$0.95 or -0.47% to $202.65) found prompt support near its 50-day moving average (DMA) line ($201) following another strong earnings report. Recent lows in the $193-196 area define important near-term support to watch. It was last shown in this FSU section on 6/20/18 with an annotated graph under the headline, "Extended From Prior Base and Perched at All-Time High" It was highlighted in yellow in the 5/02/18 mid-day report (read here) as it rose above the pivot point cited based on its 3/13/18 high plus 10 cents with a big gain backed by +146% above average volume.
For the quarter ended June 30, 2018 it reported a +51% earnings increase on +20% sales revenues versus the year-ago period, above +25% minimum quarterly earnings increase needed to satisfy the C criteria. It reported earnings increases +15%,+24%, +33% and +49% in the Jun, Sep, Dec '17 and Mar '18 quarterly comparisons, respectively, with sales revenues increases of +13%, +18%, +20% and +31% during that span. It has also maintained a strong annual earnings (A criteria) history.
The Finance - Credit Card/Payment Processing group has shown recent leadership (L criteria) that includes strong performing peers such as Visa Inc (V). The number of top-rated funds owning its shares rose from 2,802 in Jun '17 to 3,070 in Jun '18, however, it is already heavily owned by the institutional crowd (I criteria). Its current Up/Down Volume Ratio of 1.6 is an unbiased indication its shares have been under accumulation over the past 50 days. MA has a Timeliness Rating of A and Sponsorship Rating of B.
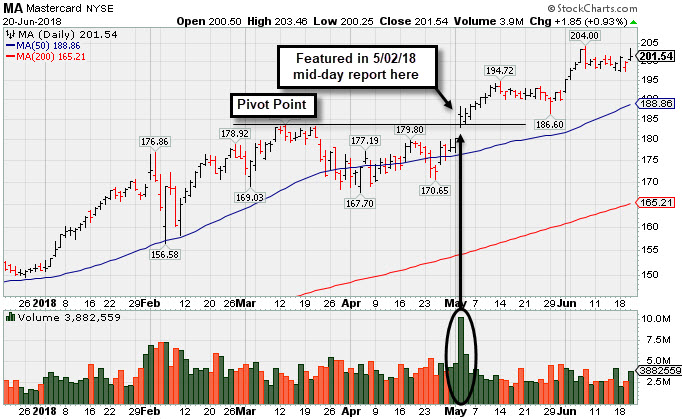
Mastercard Inc Cl A (MA +$1.85 or +0.93% to $201.54) posted a gain today with higher (near average) volume. It has been hovering in a tight range near its all-time high. Its 50-day moving average (DMA) line (188.86) and prior low ($186.60 on 5/29/18) define support to watch on pullbacks.
Mastercard was last shown in this FSU section on 5/02/18 with an annotated graph under the headline, "Gap Up and Volume Driven Gain for New High After Earnings" as it powered to new all-time highs (N criteria) with a volume-driven gain that offered investors convincing proof of fresh institutional (I criteria) buying demand. It was highlighted in yellow in the 5/02/18 mid-day report (read here) as it rose above the pivot point cited based on its 3/13/18 high plus 10 cents with a big gain backed by +146% above average volume.
It has been showing impressive acceleration in its sequential quarterly sales revenues and earnings increases. For the quarter ended March 31, 2018 it reported a +49% earnings increase on +31% sales revenues versus the year-ago period, above +25% minimum quarterly earnings increase needed to satisfy the C criteria. It reported earnings increases +15%,+24%, +33% and +49% in the Jun, Sep, Dec '17 and Mar '18 quarterly comparisons, respectively, with sales revenues increases of +13%, +18%, +20% and +31% during that span. It has also maintained a strong annual earnings (A criteria) history.
The Finance - Credit Card/Payment Processing group has shown recent leadership (L criteria) that includes strong performing peers such as Visa Inc (V). The number of top-rated funds owning its shares rose from 2,802 in Jun '17 to 3,065 in Mar '18, however, it is already heavily owned by the institutional crowd (I criteria). Its current Up/Down Volume Ratio of 1.3 is an unbiased indication its shares have been under accumulation over the past 50 days. MA has a Timeliness Rating of A and Sponsorship Rating of B.
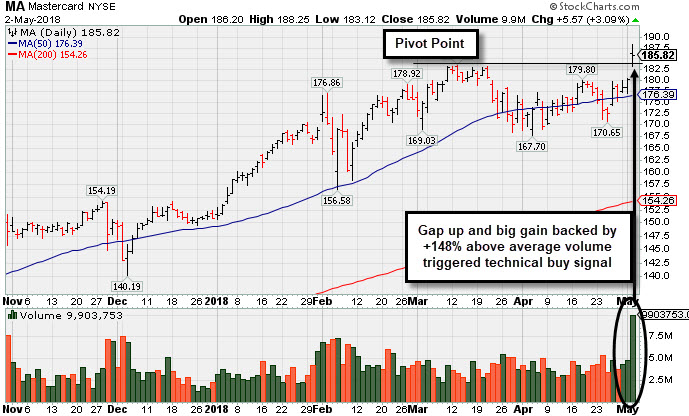
Mastercard Inc Cl A (MA +$5.57 or +3.09% to $185.82) gapped up today as it powered to new all-time highs (N criteria) with a volume-driven gain that offered investors convincing proof of fresh institutional (I criteria) buying demand. It was highlighted in yellow in the earlier mid-day report (read here) as it rose above the pivot point cited based on its 3/13/18 high plus 10 cents with a big gain backed by +146% above average volume.
It has been showing impressive acceleration in its sequential quarterly sales revenues and earnings increases. For the quarter ended March 31, 2018 it reported a +49% earnings increase on +31% sales revenues versus the year-ago period, above +25% minimum quarterly earnings increase needed to satisfy the C criteria. It reported earnings increases +15%,+24%, +33% and +49% in the Jun, Sep, Dec '17 and Mar '18 quarterly comparisons, respectively, with sales revenues increases of +13%, +18%, +20% and +31% during that span. It has also maintained a strong annual earnings (A criteria) history. The Finance - Credit Card/Payment Processing group has shown recent leadership (L criteria) that includes strong performing peers such as Visa Inc (V).
The number of top-rated funds owning its shares rose from 2,802 in Jun '17 to 2,988 in Mar '18, however, it is already heavily owned by the institutional crowd (I criteria). It made impressive progress even though sales revenues and earnings increases were not a great match with the fact-based investment system's guidelines for much of the time since its last FSU appearance on 4/11/12 with an annotated graph under the headline, " Distributional Action Opposed to Fresh Institutional Buying Demand".
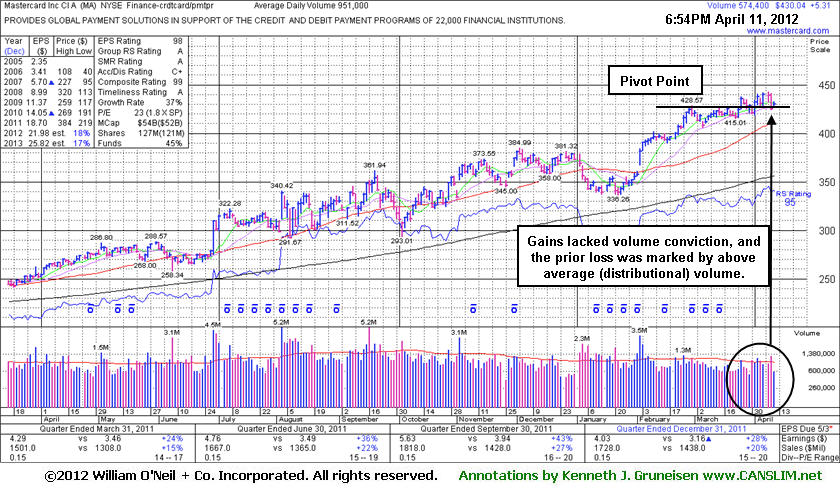
Mastercard Inc Cl A (MA +$5.31 or +1.25% to $430.04) was up today with very light volume. Volume was above average as it recently encountered distributional pressure amid widespread market weakness. Recent gains above its new pivot point cited lacked great volume conviction. Its 50-day moving average (DMA) line defines near-term support to watch.
Its last FSU appearance was on 2/17/12 with an annotated graph under the headline, "Hovering Near All-Time Highs Less Than +5% Above Pivot Point". It stubbornly held its ground and wedged to new all-time highs (N criteria) afterward without the volume-driven gains that might offer investors convincing proof of fresh institutional (I criteria) buying demand.
It has been showing impressive sales revenues and strong quarterly earnings increases. For the quarter ended December 31, 2011 it reported a +28% earnings increase on +20% sales revenues versus the year-ago period. The above +25% quarterly earnings increases satisfy the C criteria. It has also maintained a strong annual earnings (A criteria) history. The Finance - Credit Card/Payment Processing group has shown recent leadership (L criteria) that includes strong performing peers such as Visa Inc (V).
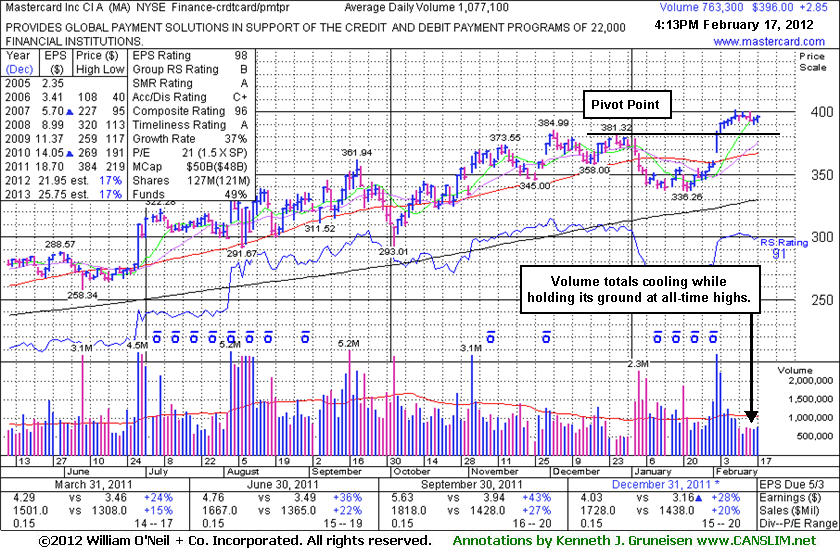
Mastercard Inc Cl A (MA +$2.85 or +0.82% to $396.00) has seen its volume totals cooling while stubbornly holding its ground perched at its all-time high after a streak of consecutive volume-driven gains. Prior highs in the mid-$380 area define initial chart support to watch on pullbacks. Its last FSU appearance was on 1/03/12 with an annotated weekly graph under the headline, "Familiar Financial Name Returns to Featured Stocks Page", while it was forming a short flat base pattern. But then it encountered distributional pressure and violated its 50-day moving average (DMA) line, raising concerns. It went on to slump below prior chart lows, yet it stayed well above its 200 DMA line and stayed within -13% of its 52-week high.
It was highlighted again in yellow on 2/02/12 with a new pivot point cited based on its 12/27/12 high while gapping up and blasting from a "double bottom" base. The volume-driven gains above its pivot point triggered a convincing technical buy signal. Proof of fresh institutional buying demand is a critical reassurance disciplined investors may have recognized. Since then it has not run up and gotten too extended from its prior highs, as it remains trading below the "max buy" level.
It has been showing impressive sales revenues and strong quarterly earnings increases. For the quarter ended December 31, 2011 it reported a +28% earnings increase on +20% sales revenues versus the year-ago period. The above +25% quarterly earnings increases satisfy the C criteria. It has also maintained a strong annual earnings (A criteria) history. The Finance - Credit Card/Payment Processing group has shown recent leadership (L criteria) that includes strong performing peers such as Visa Inc (V).
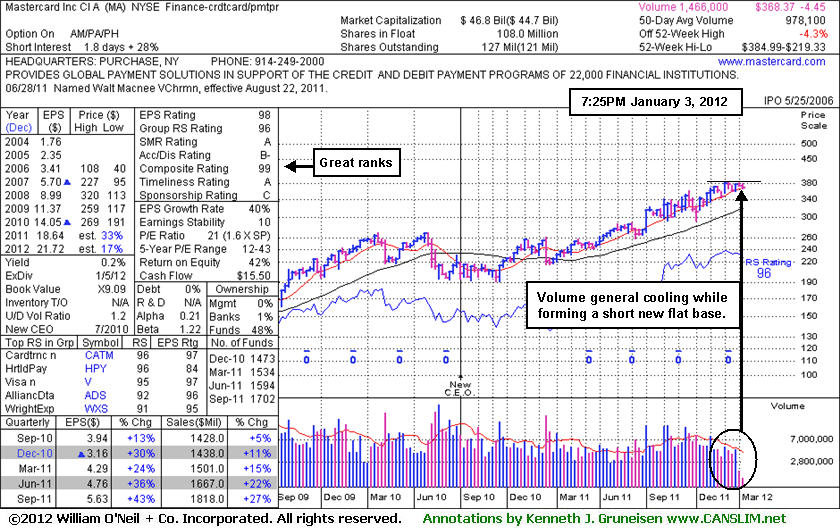
Mastercard Inc Cl A (MA -$4.45 or -1.19% to $368.37) is forming a short flat base pattern, but it encountered distributional pressure today while consolidating within close striking distance of its all-time high. While building on a riskier late-stage base, in the mid-day report (read here) it was highlighted in yellow with new pivot point cited based on its 52-week high plus 10 cents. Disciplined investors may watch for volume-driven gains above its pivot point to subsequently trigger a convincing technical buy signal. Proof of fresh institutional buying demand is a critical reassurance to watch for. Patience is required in the interim, as there is no assurance a breakout will occur.
Its last FSU appearance was on 9/12/11 with an annotated graph under the headline, "Conviction Questionable But Consolidation Has Look Of New Base." Afterward it indeed broke out, but soon it failed and triggered technical sell signals while violating its 50-day moving average line with damaging losses. It was dropped from the Featured Stocks page on October 4th. Based on its resilience it has again returned to the Featured Stocks page as a worthy looking candidate in the strong Finance - Credit Card/Payment Processing group, joining its peer Visa Inc (V) on that list of noteworthy and potentially action-worthy leaders.
It has been showing impressive sales revenues acceleration and strong quarterly earnings increases, especially with the latest September 2011 quarter showing a +43% earnings increase on +27% sales revenues. Bigger percentage increases in the recent quarterly comparisons, sequentially, are a sign the company has been building great momentum. It has maintained a strong annual earnings (A criteria) history.
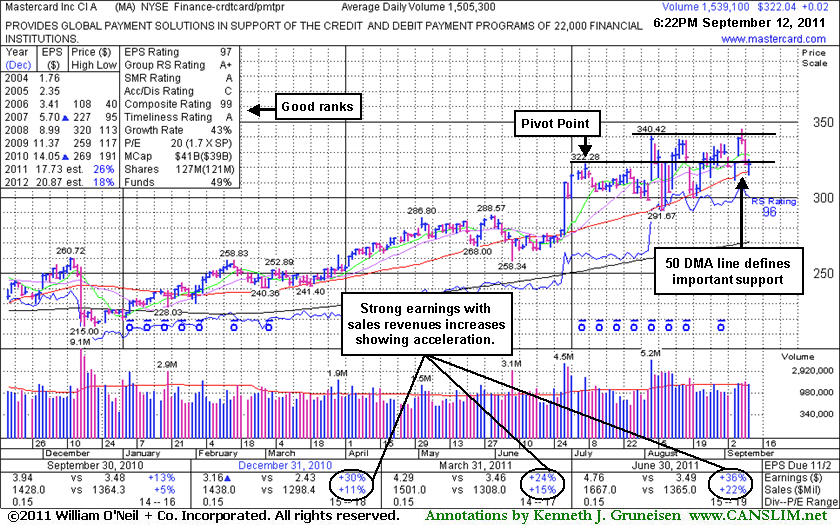
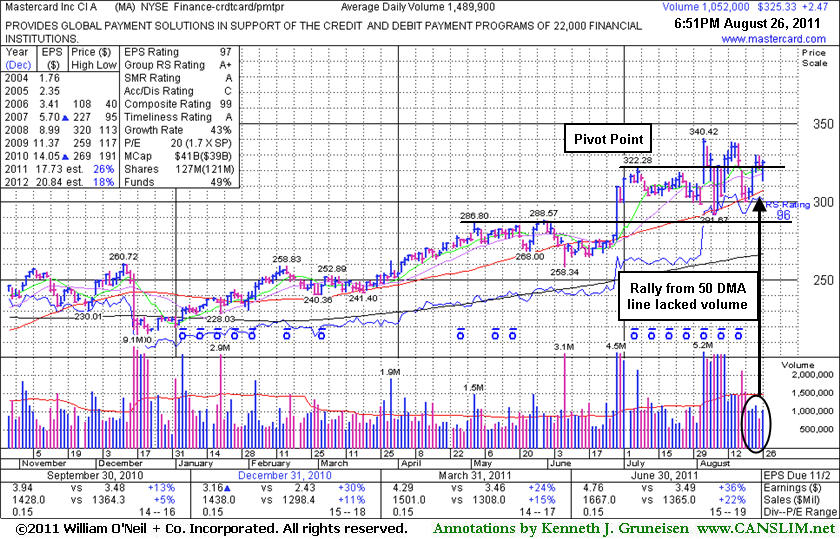
Mastercard Inc Cl A (MA +$0.02 or +0.01% to $322.04) has again slumped near important support at its 50-day moving average (DMA) line and near its prior pivot point. A damaging violation of its 50 DMA line would raise concerns and may trigger a technical sell signal. The choppy action following its prior breakout has offered investors an opportunity to accumulate shares and pyramid into any positions without chasing it higher. While its latest consolidation may be considered a new base pattern, no new pivot point is being cited. Last week it quietly wedged up to touch a new all-time high, but after gains on quiet volume it again pulled back to its 50 DMA line. The broader market (M criteria) has been noted for its recent lack of leadership and worrisome distributional pressure that argues for caution and smart defense more than any new buying efforts.
Mastercard's last FSU appearance was on 8/26/11 with an annotated weekly graph under the headline, "Quiet Gains Reveal Lack Of Conviction After Finding Support." It has been showing sales revenues acceleration and strong quarterly earnings increases, with the latest June 2011 quarter showing a +36% earnings increase on +22% sales revenues. It also has maintained a strong annual earnings (A criteria) history. A considerable 6/29/11 gain on heavy volume came after the Federal Reserve set a higher cap on debit-card fees (mentioned in the 6/29/11 Market Commentary - read here). In a handful of mid-day report appearances in June and July of this year it was noted -"It survived but failed to impress since it was dropped from the Featured Stocks list on 7/02/08 after an ominous 'double top' pattern triggered a technical sell signal." A follow-up article dated 12/16/08 revisited MA and summarized the action under the headline, "Multiple Sell Signals Prompted Profit Taking; Serious Damage Followed".
It has been showing sales revenues acceleration and strong quarterly earnings increases, with the latest June 2011 quarter showing a +36% earnings increase on +22% sales revenues. It also has maintained a strong annual earnings (A criteria) history. A considerable 6/29/11 gain on heavy volume came after the Federal Reserve set a higher cap on debit-card fees (mentioned in the 6/29/11 Market Commentary - read here). In a handful of mid-day report appearances in June and July of this year it was noted -"It survived but failed to impress since it was dropped from the Featured Stocks list on 7/02/08 after an ominous 'double top' pattern triggered a technical sell signal." A follow-up article dated 12/16/08 had last revisited MA and summarized the action under the headline, "Multiple Sell Signals Prompted Profit Taking; Serious Damage Followed".
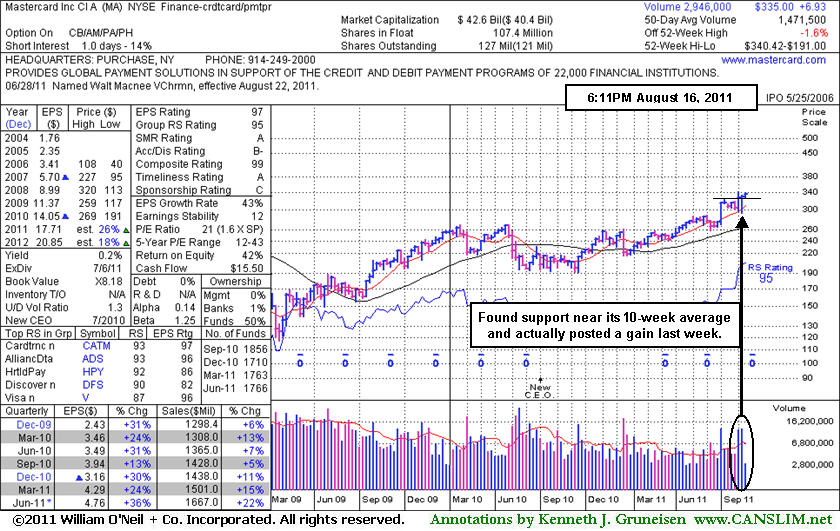
Mastercard Inc Cl A (MA +$0.00 or +0.00% to $335.00) held its ground today with near average volume. Its resilience this week helped it approach its 8/03/11 all-time high, rallying further above the previously cited pivot point. An annotated daily graph was included in its last FSU appearance on 8/03/11 under the headline, "Surge To New Highs Makes Mastercard an Outlier to Watch", after it had gapped up and and hit a new all-time high following a 4-week consolidation that was considered a "square box" base. The weekly chart below shows it finding support near its 10-week moving average line, and it actually finished last week with a gain. However, the weaker action in the broader market (M criteria) still argues against new buying efforts until a confirmed rally with a follow-through day.
It has been showing sales revenues acceleration and strong quarterly earnings increases, with the latest June 2011 quarter showing a +36% earnings increase on +22% sales revenues. It also has maintained a strong annual earnings (A criteria) history. A considerable 6/29/11 gain on heavy volume came after the Federal Reserve set a higher cap on debit-card fees (mentioned in the 6/29/11 Market Commentary - read here). In a handful of mid-day report appearances in June and July of this year it was noted -"It survived but failed to impress since it was dropped from the Featured Stocks list on 7/02/08 after an ominous 'double top' pattern triggered a technical sell signal." A follow-up article dated 12/16/08 had last revisited MA and summarized the action under the headline, "Multiple Sell Signals Prompted Profit Taking; Serious Damage Followed".
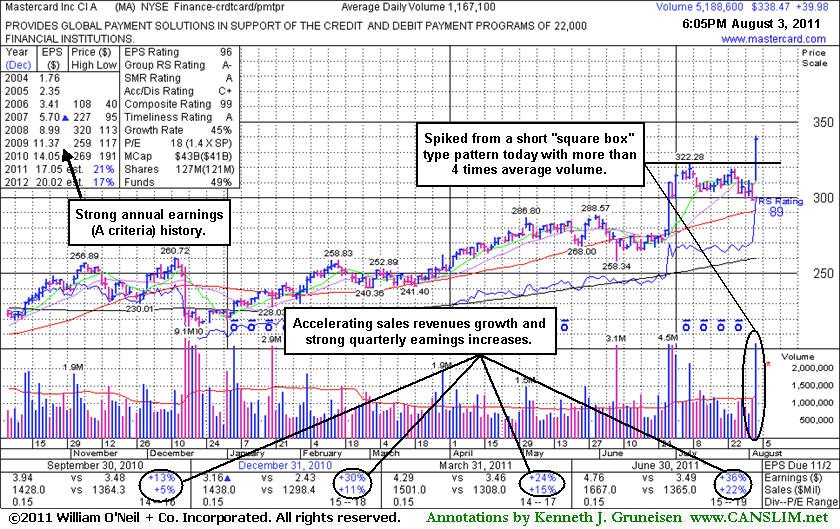
Mastercard Inc Cl A (MA +$39.98 or +13.39% to $338.47) gapped up today and hit a new all-time high after a 4-week consolidation that may be considered a "square box" base. It has been showing sales revenues acceleration and strong quarterly earnings increases, with the latest June 2011 quarter showing a +36% earnings increase on +22% sales revenues. It also has maintained a strong annual earnings (A criteria) history. Its color code was changed to yellow with a pivot point cited based on its prior high plus 10 cents. It held its ground well above prior highs and its 50-day moving average (DMA) line since the considerable 6/29/11 gain on heavy volume after the Federal Reserve set a higher cap on debit-card fees (mentioned in the 6/29/11 Market Commentary - read here). In a handful of mid-day report appearances in June and July of this year it was noted -"It survived but failed to impress since it was dropped from the Featured Stocks list on 7/02/08 after an ominous 'double top' pattern triggered a technical sell signal." A follow-up article dated 12/16/08 had last revisited MA and summarized the action under the headline, "Multiple Sell Signals Prompted Profit Taking; Serious Damage Followed".
In recent weeks we have taken the opportunity to use this section to revisit some of the previously featured stocks that were dropped some time ago based on technical weakness. Studying what happened afterwards should hopefully allow investors to get a better understanding of the importance of having a sell discipline. Limiting losses while they are small is critically important to your success, and this investment system's rule is to always sell a losing stock after it falls more than 7-8% from your buy price. These well-known, high-profile companies serve now as perfect examples that will hopefully allow investors in the future to recognize the warning signs and technical sell signals so they will know when it is time to lock in profits or minimize losses per the investment system's sell rules.
Mastercard Inc Cl A (MA +$8.81 or +6.32% to $148.10) is not a currently featured stock, but it may be worth another look for any important lessons that can be learned from this previous market leader that has experienced a technical breakdown after a considerable run up. Although MA rallied above its 50-day moving average (DMA) line today, its gain was backed by suspiciously light volume (revealing no serious institutional buying demand), and the stock now faces a tremendous amount of resistance due to overhead supply, making it unlikely to be a market leader in the near term.
MA made its last appearance in the CANSLIM.net After Market Update's Featured Stock Update section on 6/20/08, with many details about its prior CANSLIM.net coverage provided under the headline "Distributional Action Negated Recent Breakout" with an annotated graph (read here). In the weeks immediately following, the major averages' rally ended and a serious market correction began! Since 3 out of 4 stocks go right along with the direction of the broader market, it was not surprising that additional sell signals soon prompted investors to unload their MA shares. Its technical deterioration below an upward trendline and prior chart lows was noted (use the "view all notes" links to review), and the stock has traded as much as -55.75% lower since 7/02/08 when it was dropped from the Featured Stocks list. MA had traded up as much as +73.18% after it was first featured on Wednesday, October 31, 2007 in the CANSLIM.net Mid Day Breakouts Report (read here).
C A N S L I M | StockTalk | News | Chart | SEC | Zacks Reports | ![]()
![]()
![]()
View all notes | Alert me of new notes | CANSLIM.net Company Profile
--A very important technical tool that savvy investors have learned to incorporate in their technical analysis is the 50-day moving average (DMA) line. The 50 DMA line plays a pivotal role relative to a stock's price. If the price of a stock is above its 50 DMA then odds are that its 50 DMA will act as formidable support. Conversely, if the price is below its 50 DMA then the moving average acts as resistance. Healthy stocks sometimes trade under their 50 DMA lines briefly, but usually a strong candidate will promptly bounce and repair a 50 DMA violation. When a stock has violated its 50 DMA line and then lingers beneath it, the stock's outlook gets worse and worse as it spends a greater period of time trading under that important short-term average line. Once the 50 DMA line starts sloping downward it should also be acknowledged that the stock has been struggling for a while, and it might be time to reduce exposure and look for places to put that money to work in stronger buy candidates.
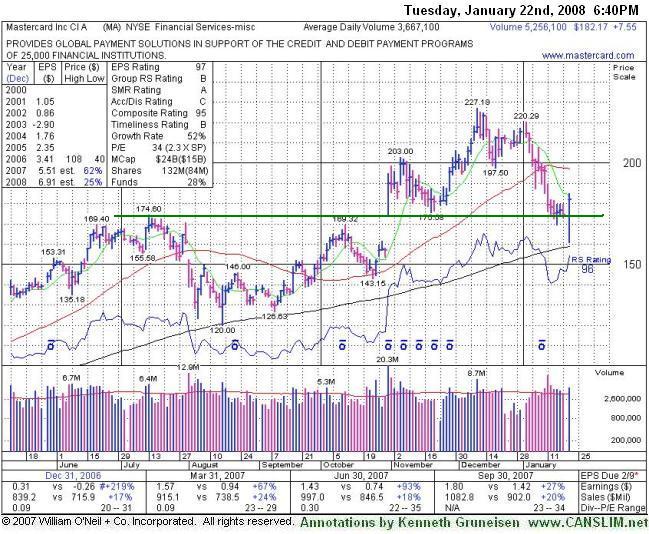
Mastercard Inc. (MA -$8.59 or -3.12% to $284.01) ended lower with a loss on below average volume. This high-ranked leader has been consolidating its recent move above its 50 DMA line, and it is important to watch for any breach of its 50 DMA which would raise concerns. The present market (M criteria) now argues for good defense, and investors with hard earned profits might also watch the upward trendline it is presently testing as an initial support level. Meanwhile, a violation of its chart lows near $270 could complete an ominous "double top" pattern, triggering a more worrisome technical sell signal. Mastercard has shown solid earnings growth and accelerating sales revenues growth in recent quarterly comparisons, and it also has an attractive annual earnings growth history that helps to satisfy the C and A criteria. MA sports very healthy ranks, and faces very little resistance due to overhead supply now. Its Earnings Per Share (EPS) stands at a firm 99 and its Relative Strength (RS) rating is a very solid 97. The number of top-rated funds owning an interest in its shares rose from 156 in Jun '07 to 293 in Mar '08, helping to satisfy the I criteria.
This stock was first featured on Wednesday, October 31, 2007 in the CANSLIM.net Mid Day Breakouts Report (read here) with a $169.42 pivot point and a $177.89 maximum buy price. At the time, the stock was at $184.95 and triggering a technical buy signal as it experienced a "break-away" gap. A breakaway gap has been noted as one exception to the usual guideline of buying stocks no more than +5% above their pivot point. Since its 10/31/07 appearance in yellow the stock has traded as much as +73% higher. On 3/20/08 its color code was changed to yellow and a new pivot point was noted (read here). It made quiet progress afterward, until another big breakaway gap up on 4/29/08. Since then, another new pivot point of $301.53 and a $316.61 maximum buy price emerged and were noted on Tuesday, June 3, 2008 in the CANSLIM.net Mid Day Breakouts Report (read here). However, it negated its latest breakout and fell back into the prior base with losses on heavy volume indicative of institutional selling pressure or distribution.
C A N S L I M | StockTalk | News | Chart | SEC | Zacks Reports | ![]()
![]()
![]()
View all notes | Alert me of new notes | CANSLIM.net Company Profile
Volume is a vital component of technical analysis. Prudent investors that incorporate volume into their stock analysis have often benefited several fold. Ideally, healthy stocks will more often tend to rise on higher volume and pullback on lighter volume. Volume is a great proxy for institutional sponsorship. Conversely, high volume declines can be ominous, as this usually signals distribution and further price deterioration are more likely to follow.
Mastercard Inc (MA +$3.21 or +1.39% to $233.71) gapped up for gains that lifted it into new high territory and above its $233.40 maximum buy price on Friday. Volume, however, has been suspiciously light behind its recent gains, which suggests that institutional investors have not been eagerly buying shares. Mastercard has shown solid earnings growth and accelerating sales revenues growth in recent quarterly comparisons, and it also has an attractive annual earnings growth history that helps to satisfy the C and A criteria. MA sports very healthy ranks, and faces no resistance due to overhead supply now. Its Earnings Per Share (EPS) stands at a firm 97 and its Relative Strength (RS) rating is a very solid 98. The number of top-rated funds owning an interest in its shares rose from 156 in Jun '07 to 262 in Mar '08, helping to satisfy the I criteria.
This stock was first featured on Wednesday, October 31, 2007 in the CANSLIM.net Mid Day Breakouts Report (read here) with a $169.42 pivot point and a $177.89 maximum buy price. At the time, the stock was at $184.95 and triggering a technical buy signal as it experienced a "break-away" gap. A breakaway gap has been noted as one exception to the usual guideline of buying stocks no more than +5% above their pivot point. Since its 10/31/07 appearance in yellow the stock has traded as much as +29.89% higher. Its January losses led to a 50 DMA violation and test of support at its longer-term 200 DMA line, weakness which coincided with a pullback in the major averages. Since then, a new pivot point of $222.35 and a $233.40 maximum buy price emerged and were noted in the March 20, 2008 CANSLIM.net After Market update (read here). It has failed to trigger a proper new technical buy signal since then, as volume has failed to meet the minimum guidelines (at least +50% above average) behind its latest gains above its pivot point
.C A N S L I M | StockTalk | News | Chart | SEC | Zacks Reports | ![]()
![]()
![]()
View all notes | Alert me of new notes | CANSLIM.net Company Profile
|
Mastercard Inc. |
| |
|
Ticker Symbol: MA (NYSE) |
Industry Group: Financial Services- Misc |
Shares Outstanding: 131,000,000 |
|
Price: $220.38 3/20/2008 |
Day's Volume: 5,815,500 3/20/2008 |
Shares in Float: 71,500,000 |
|
52 Week High: $227.18 12/11/2008 |
50-Day Average Volume: 4,260,500 |
Up/Down Volume Ratio: 0.8 |
|
Pivot Point: $222.35 2/04/2008 |
Pivot Point +5% = Max Buy Price: $233.47 |
Web Address: http://www.mastercard.com/ |
C A N S L I M | StockTalk | News | Chart | SEC | Zacks Reports | ![]()
![]()
![]()
View all notes | Alert me of new notes | CANSLIM.net Company Profile
CANSLIM.net Profile: MasterCard Incorporated, together with its subsidiaries, provides transaction processing and related services to customers principally in support of their credit, deposit access, electronic cash and automated teller machine payment card programs, and travelers cheque programs. The company develops and markets payment solutions, processes payment transactions, and provides consulting and information services to customers and merchants. The company's payment programs, which are facilitated through its brands, include consumer credit and debit programs, commercial payment solutions, stored value programs, prepaid programs, and contactless payment solutions. As of December 31, 2007, it served approximately 25,000 financial institutions worldwide. The company was founded in 1966 and is headquartered in Purchase, New York. MA hails from the Financial Services- Misc group which is presently ranked 50th on the 197 Industry Groups list, which satisfies the L criteria. There were 115 top-rated funds with an ownership interest in March '07, yet that number jumped to 248 as of December 07, offering a very strong sign of increasing institutional interest (I criteria). More encouraging, the stock only has 71.5 million shares in the float which is much less than most of its peers. Having a small supply of shares is a characteristic that most of the greatest stock market winners exhibited before they enjoyed explosive moves up. Its annual earnings growth history has steadily grown over the past few years which has helped satisfy the A criteria. It satisfies the C criteria with solid quarterly earnings increases in the 4 latest quarterly earnings comparisons above the +25% guideline, along with sales revenues growth accelerating in recent quarters.
What to Look For and What to Look Out For: Look for the stock to confirm a new technical buy signal by breaking out and closing above its $222.35 pivot point with gains on heavy volume in the coming days and weeks. It has rallied near that threshold, but remember that buyable breakouts require three important components: the stock must clear its pivot point with considerable gains, those gains must be backed by at least +50% above average volume, and the overall market environment must improve and produce a new batch of leadership. On Thursday, March 20, 2008 the market confirmed its latest rally attempt which helps means the environment conducive for accumulating shares again. As always, it is of the utmost importance to sell a stock if it drops 7-8% below your purchase price. This high-ranked leader should remain on an active watchlist and could be considered as a new buy candidate in the event it closes above its pivot point on the necessary volume needed to trigger a technical buy signal. Any failure and damaging losses leading to a close back under its 50-day moving average (DMA) line would raise concerns and trigger technical sell signals.
Technical Analysis: MA technically enjoyed its second best close ever and remains perched just below its pivot point. Chart readers may note that during the market's steep January correction MA pulled back and found support near last year's highs in the $174 area, and stayed well above its longer-term 200 DMA line. The stock has spent the past four months building its latest base, and now there is little resistance remaining from overhead supply. Healthy action is also demonstrated by the gains on its three most recent weeks that were marked by above average volume. The stock is currently trading just -3.0% shy of its all-time high and has enjoyed healthy gains since its IPO in May 2006.
A very important technical tool that savvy investors have learned to incorporate in their technical analysis is the 50-day moving average (DMA) line. The 50 DMA line plays a pivotal role relative to a stock's price. If the price of a stock is above its 50 DMA then odds are that its 50 DMA will act as formidable support. Conversely, if the price is below its 50 DMA then the moving average acts as resistance. Healthy stocks sometimes trade under their 50 DMA lines briefly, but usually a strong candidate will promptly bounce and repair a 50 DMA violation. When a stock has violated its 50 DMA line and then lingers beneath it, the stock's outlook gets worse and worse as it spends a greater period of time trading under that important short-term average line. Once the 50 DMA line starts sloping downward it should also be acknowledged that the stock has been struggling for a while, and it might be time to reduce exposure and look for places to put that money to work in stronger buy candidates.
Mastercard Inc Cl A (MA -$1.47 or -0.78% to $191.00) ended slightly lower on below average volume on Wednesday as this high-ranked leader continues to quietly consolidate below its 50 DMA line. Mastercard has shown solid earnings growth and accelerating sales revenues growth in recent quarterly comparisons, and it also has a attractive annual earnings growth history that helps to satisfy the C and A criteria. MA sports very healthy ranks, and faces very little resistance due to overhead supply now. Its Earnings Per Share (EPS) stands at a firm 97 and its Relative Strength (RS) rating is a solid 96. The number of top-rated funds owning an interest in its shares rose from 115 in Mar '07 to 238 in Dec '07, helping to satisfy the I criteria.
This stock was first featured on Wednesday, October 31, 2007 in the CANSLIM.net Mid Day Breakouts Report (read here)
with a $169.42 pivot point and a $177.89 maximum buy price. At the time, the stock was triggering a technical buy signal as it experienced a "break-away" gap. Since then, the stock rallied +34% above its pivot point as it hit a fresh record high of $227.18 on December 11, 2007. But it began running into trouble as the buying enthusiasm waned, which coincided with a pullback in the major averages. Remember that 3 out of 4 growth stocks move in tandem with the major averages. The next important area of support would be for MA to find support above its longer-term 200 DMA line (now $170.38) which is an important area of support often defended by the institutional crowd. A violation of the 200 DMA line would trigger a technical sell signal, then the next level of support is in the $118-120 area near its August low (which is just above its chart highs February 2007). Remember that proper discipline requires investors to sell if any stock falls 7-8% from their buy price, as that is the only way to eliminate the chance of even larger losses occurring. The stock should remain on an active watchlist in the event, the market remains healthy, and this stock manages to get back towards new high territory on healthy volume.C A N S L I M | StockTalk | News | Chart | SEC | Zacks Reports | ![]()
![]()
![]()
View all notes | Alert me of new notes | CANSLIM.net Company Profile
Statistically, about 40% of winning stocks will pull back after breaking out. In other words, it is not uncommon for stocks to pullback and retest support near their pivot point after breaking out. It is important to see the bulls show up and offer support at or above the pivot point. This may offer investors a chance to increase their exposure before the stock continues advancing. However, an important caveat is that volume should contract as the stock pulls back towards its pivot point. Heavy volume behind losses can be cause for concern, especially if the stock does not find support at its pivot point. Whenever a recent breakout is completely negated by a loss that leads to a close back in the prior base, this is construed as a technical sell signal and a sign that the bears are regaining control.
Mastercard Incorporated (MA +$7.55 or +4.32% to $182.17) gapped down today, then positively reversed as it found support near its prior chart highs and above its longer term 200-day moving average (DMA) line. The high-ranked leader was featured in the November 2007 issue of CANSLIM.net News (read here) with a $169.42 pivot point and a $177.89 maximum buy point. At the time, the stock was triggering a technical buy signal as it experienced a "break-away" gap. Since then, the stock rallied +34% above its pivot point as it hit a fresh record high of $227.18 on December 11, 2007. But it began running into trouble as the buying enthusiasm waned, which coincided with a pullback in the major averages. Remember that 3 out of 4 growth stocks move in tandem with the major averages. The positive reversal for a gain on above average volume is a near-term positive sign. It was reassuring to see the stock find support above its longer-term 200 DMA line which is an important area of support often defended by the institutional crowd. If this level is subsequently breached, the next level of support is in the $118-120 area near its August low (which is just above its chart highs February 2007).
C A N S L I M | StockTalk | News | Chart | SEC | Zacks Reports | ![]()
![]()
![]()
View all notes | Alert me of new notes | CANSLIM.net Company Profile
|
MasterCard Inc. |
||
|
Ticker Symbol: (NYSE: MA) |
Industry Group: Financial Services- misc |
Shares Outstanding: 135,000,000 |
|
Price: $189.91 |
Day's Volume: 20,211,800 10/31/2007 |
Shares in Float: 65,500,000 |
|
52 Week High: $194.78 10/31/2007 |
50-Day Average Volume: 2,981,600 |
Up/Down Volume Ratio: 1.1 |
|
Pivot Point: $169.42 10/11/2007 high plus 10 cents |
Pivot Point +5% = Max Buy Price: $177.89 |
Web Address: www.mastercard.com |
C A N S L I M | StockTalk | News | Chart | SEC | Zacks Reports | ![]()
![]()
![]()
View all notes | Alert me of new notes | CANSLIM.net Company Profile
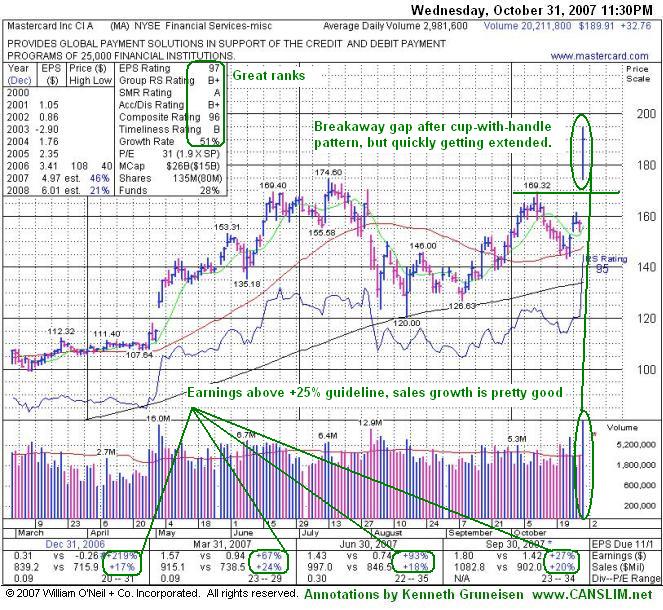
CANSLIM.net Profile: MasterCard Incorporated develops and markets payment solutions, processes payment transactions, and provides consulting services to customers and merchants. It provides transaction processing and other payment-related services, as well as facilitates the authorization, clearing, and settlement process of the transactions. It manages and licenses payment card brands, including MasterCard, MasterCard Electronic, Maestro, and Cirrus. As of December 31, 2006, MasterCard Incorporated served approximately 25,000 financial institutions worldwide. The company was founded in 1966 and is headquartered in Purchase, New York. The company sports a very healthy Earnings Per Share (EPS) rating of 97 and a strong Relative Strength (RS) rating of 95. Return on Equity of 26% is above the 17% guideline. The company has managed to increase its earnings by above the +25% guideline in each of the past four quarterly comparisons versus the year earlier (satisfying the C criteria) and its annual earnings history (the A) is solid. MA resides in the Financial Services - Misc which is currently ranked 55th out the 197 Industry Groups covered in the paper, placing it just outside of the much preferred top quartile. However, other strong stocks in the group such as Nasdaq Stock Market Inc. (NDAQ) and Intercontinental exchange (ICE) help satisfy the L criteria. The number of high ranked mutual funds that own this stock has swelled from 92 in the quarter ending December '06 to 163 in the quarter ending Sept '07, helping satisfy the I criteria.
What to Look For and What to Look Out For: The stock experienced a break-away gap when it surged past its $169.42 pivot point and $177.89 maximum buy price after reporting its latest quarterly earnings on October 31, 2007. MA has cleared all technical resistance and odds favor further price gains. Ideally, this stock would consolidate on lighter volume over the next few days and weeks, offering investors a chance to accumulate shares at more attractive prices before following through with additional gains on higher volume. Breakaway gaps are one exception where it is permissible to buy a stock more than +5% above a pivot point, however buying at more than +10% higher prices is not prudent since extended stocks can easily pull back and trigger a 7-8% stop loss. Patience may allow shares to be accumulated on a lighter volume pullback toward prior chart highs which should now serve as a key technical support level. About 40% of successful breakouts pull back and test support near their pivot point and/or prior chart highs. Keep in mind that MA appeared in the October 31, 2007 CANSLIM.net Mid-Day Breakouts Report describing its healthy action (read here). Undisciplined buys can hurt your investment results. Caution and a disciplined sell strategy could be required, and concerns would definitely be raised if the stock falls more than 7-8% below your purchase price.
Technical Analysis: On Wednesday, October 31st, 2007, MA triggered a technical buy signal as it surged above its $169.42 pivot point from a cup-with handle type pattern with gains backed by very heavy volume more than 6 times its average daily total. Whenever a stock explodes out of a sound base and vaults to new highs in such a powerful fashion, the action suggests that there is very strong institutional sponsorship (the I criteria). The recent volume patterns have been bullish, which is best indicated by the fact that on its weekly chart there are numerous up weeks on above average volume, but not many down weeks on above average volume.