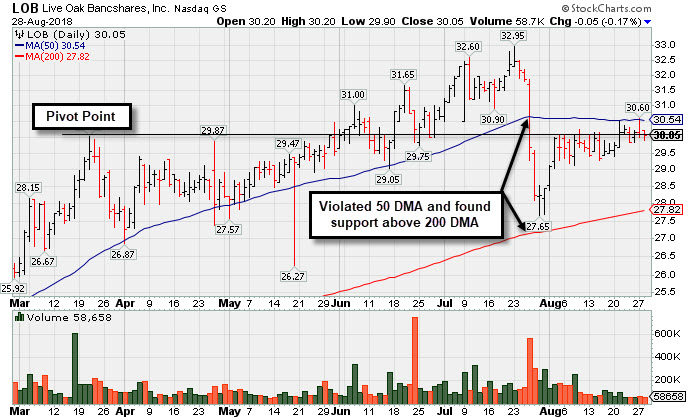
Recently Met Resistance at 50-Day Moving Average - Tuesday, August 28, 2018
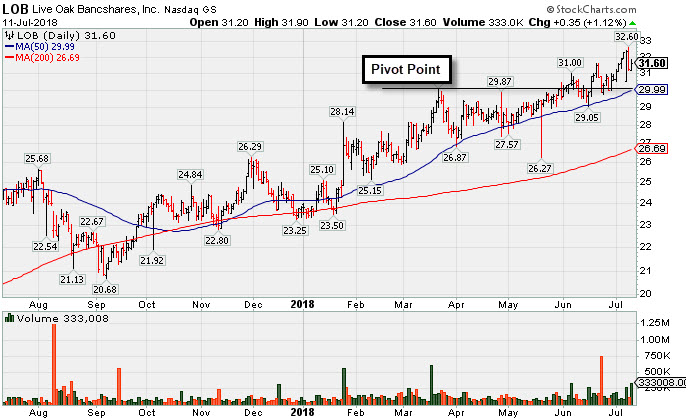
Bank Making Gradual Progress After Support Found at 50-Day Average - Wednesday, July 11, 2018
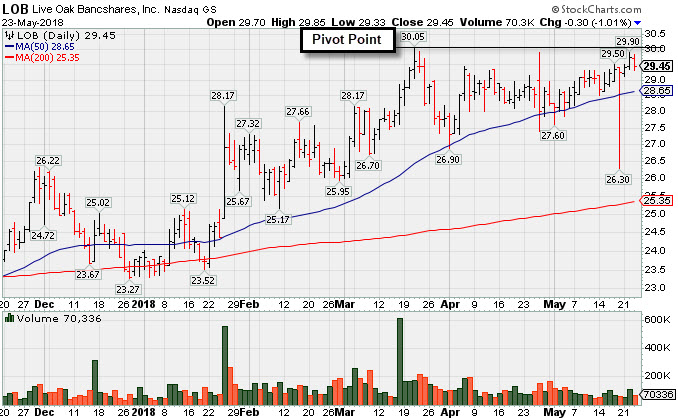
Bank Perched Near High After Orderly Base - Wednesday, May 23, 2018
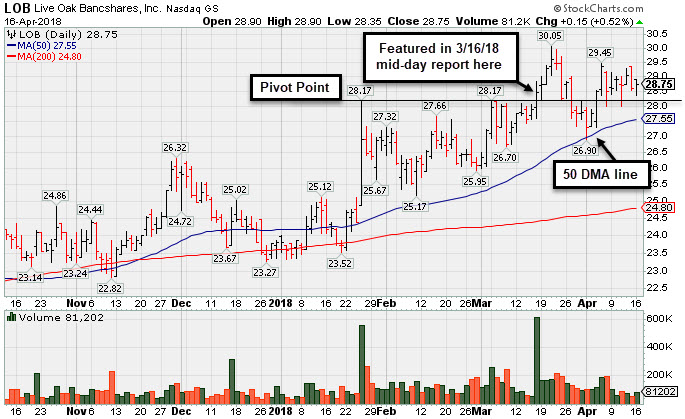
Tested Support at 50-Day Moving Average After Breakout - Monday, April 16, 2018
Tallied Volume-Driven Gain for New High - Friday, March 16, 2018
Recently Met Resistance at 50-Day Moving Average - Tuesday, August 28, 2018
Live Oak Bancshares Inc (LOB -$0.05 or -0.17% to $30.05) still needs a rebound above the 50-day moving average (DMA) line ($30.54) for its outlook to improve.Its Relative Strength Rating is still 79, below the 80+ minimum guideline. Volume totals have cooled in recent weeks. The recent low and 200 DMA line ($27.85) define important near-term chart support.
LOB violated its 50-day moving average line on 7/26/18 triggering a technical sell signal after last shown with an annotated graph in this FSU section on 7/11/18 under the headline, "Bank Making Gradual Progress After Support Found at 50-Day Average". It found support above its 200 DMA line and rebounded, but it has met resistance at its 50 DMA line in recent weeks.
The Wilmington, NC - based banking company recently reported earnings +25% on +40% for the Jun '18 quarter. It had very strong sales revenues and earnings increases. The prior quarterly and annual earnings (C and A criteria) history is a good match with the fact-based investment system's guidelines.
It completed a new Public Offering on 8/09/17. The number of top-rated funds owning its shares rose from 140 in Mar '17 to 234 in Jun '18, a reassuring sign concerning the I criteria. Its current Up/Down Volume Ratio of 1.2 is an unbiased indication its shares have been under slight accumulation over the past 50 days. There are only 40.0 million shares outstanding (S criteria). It has earned a Timeliness Rating of B and Sponsorship rating of B.
Bank Making Gradual Progress After Support Found at 50-Day Average - Wednesday, July 11, 2018
Live Oak Bancshares Inc (LOB +$0.35 or +1.12% to $31.60) pulled back from a new high on the prior session following a streak of 7 consecutive gains. Near-term support to watch is at its 50-day moving average (DMA) line ($30). LOB made gradual progress since last shown with an annotated graph in this FSU section on 5/23/18 under the headline, "Bank Perched Near High After Orderly Base".
The Wilmington, NC - based banking company recently reported earnings +63% on +42% for the Mar '18 quarter. It hadvery strong sales revenues and earnings increases for the Sep and Dec '17 quarters. Prior quarterly and annual earnings (C and A criteria) history is a good match with the fact-based investment system's guidelines.
It completed a new Public Offering on 8/09/17. The number of top-rated funds owning its shares rose from 140 in Mar '17 to 210 in Jun '18, a reassuring sign concerning the I criteria. Its current Up/Down Volume Ratio of 1.6 is an unbiased indication its shares have been under accumulation over the past 50 days. There are only 40.0 million shares outstanding (S criteria). It has earned a Timeliness Rating of A and Sponsorship rating of B.
Bank Perched Near High After Orderly Base - Wednesday, May 23, 2018
Live Oak Bancshares Inc (LOB -$0.30 or -1.01% to $29.45) has been highlighted in yellow again with a new pivot point cited based on its 3/21/18 high plus 10 cents. Subsequent volume-driven gains for a new high may trigger a technical buy signal. Volume totals have been mostly below average while consolidating above its 50 DMA line ($28.65). Prior lows in the $26-27 area define important near term support.
The Wilmington, NC - based banking company recently reported earnings +63% on +42% for the Mar '18 quarter. It hadvery strong sales revenues and earnings increases for the Sep and Dec '17 quarters. Prior quarterly and annual earnings (C and A criteria) history is a good match with the fact-based investment system's guidelines.
It completed a new Public Offering on 8/09/17. The number of top-rated funds owning its shares rose from 140 in Mar '17 to 196 in Mar '18, a reassuring sign concerning the I criteria. Its current Up/Down Volume Ratio of 1.7 is an unbiased indication its shares have been under accumulation over the past 50 days. There are only 40.0 million shares outstanding (S criteria). It has earned a Timeliness Rating of A and Sponsorship rating of C.
Tested Support at 50-Day Moving Average After Breakout - Monday, April 16, 2018
Live Oak Bancshares Inc (LOB +$0.15 or +0.52% to $28.75) is quietly consolidating above its pivot point after testing its 50-day moving average (DMA) line ($27.56). Subsequent damaging losses below the 50 DMA line and prior low ($26.90 on 4/02/18) would raise greater concerns and rigger technical sell signals.
LOB was highlighted in yellow with pivot point cited based on its 1/25/18 high plus 10 cents in the 3/16/18 mid-day report (read here). It was shown with an annotated graph in this FSU section that evening under the headline, "Tallied Volume-Driven Gain for New High".
Hitting a new all-time high, its gain and strong close above the pivot point was backed by +354% above average volume triggering a technical buy signal.
The Wilmington, NC - based banking company reported very strong sales revenues and earnings increases for the Sep and Dec '17 quarters. Prior quarterly and annual earnings (C and A criteria) history is a good match with the fact-based investment system's guidelines.
It completed a new Public Offering on 8/09/17. The number of top-rated funds owning its shares rose from 140 in Mar '17 to 181 in mar '18, a reassuring sign concerning the I criteria. Its current Up/Down Volume Ratio of 1.5 is an unbiased indication its shares have been under accumulation over the past 50 days. There are only 40.0 million shares outstanding (S criteria). It has earned a Timeliness Rating of A and Sponsorship rating of C.
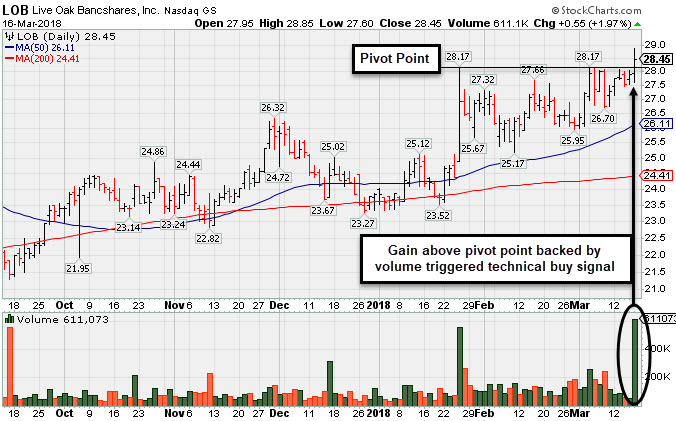
Tallied Volume-Driven Gain for New High - Friday, March 16, 2018
Live Oak Bancshares Inc (LOB +$0.55 or +1.97% to $28.45) was highlighted in yellow with pivot point cited based on its 1/25/18 high plus 10 cents in the earlier mid-day report (read here). Hitting a new all-time high, its gain and strong close above the pivot point was backed by heavy volume well above the +40% above average volume threshold needed to trigger and clinch a proper technical buy signal. Recently it consolidated in an orderly fashion above its 50-day moving average (DMA) line and prior highs.
The Wilmington, NC - based banking company reported very strong sales revenues and earnings increases for the Sep and Dec '17 quarters. Prior quarterly and annual earnings (C and A criteria) history is a good match with the fact-based investment system's guidelines.
It completed a new Public Offering on 8/09/17. The number of top-rated funds owning its shares rose from 140 in Mar '17 to 177 in Dec '17, a reassuring sign concerning the I criteria. Its current Up/Down Volume Ratio of 1.3 is an unbiased indication its shares have been under accumulation over the past 50 days. There are only 39.9 million shares outstanding (S criteria). It has earned a Timeliness Rating of A and Sponsorship rating of C.