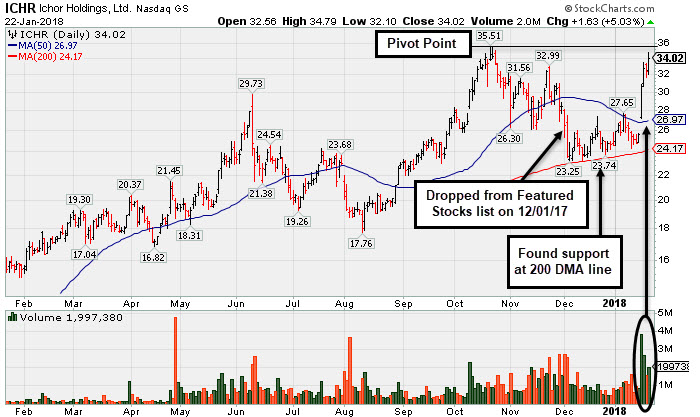
Found Support at 200 Day Average and Rebounded Near Prior High - Monday, January 22, 2018
Ichor Holdings Ltd (ICHR +$1.63 or +5.03% to $34.02) was highlighted in yellow with new pivot point cited based on its 10/20/17 high plus 10 cents in the earlier mid-day report (read here). It rebounded above its 50-day moving average (DMA) line on 1/17/18 and little overhead supply remains after additional volume-driven gains. Gains above the pivot point backed by at least +40% above average volume are still needed to trigger a technical buy signal.
Fundamentals remain very strong. ICHR found support at its 200 DMA line after it was dropped from the Featured Stocks list on 12/01/17. It was last shown in this FSU section on 11/30/17 with an annotated graph under the headline "Damaging Losses Undercutting 50-Day Average Hurt Outlook". It currently has a Timeliness rating of C and a Sponsorship rating of C.
It has reported great earnings increases, above the +25% minimum guideline (C criteria) for the past 6 quarterly comparisons through Sep '17, helping it match the fact-based investment system's fundamental guidelines. Its limited annual history (A criteria) is a concern, and it is up considerably from its $9 IPO on 12/09/16.
The number of top-rated funds owning its shares rose from 29 on Dec '16 to 200 in Dec '17, a very reassuring sign concerning the I criteria. Its small supply of only 17.9 million shares in the public float (S criteria) can contribute to greater price volatility in the event of institutional buying or selling. Its current Up/Down Volume ratio of 0.9 is an unbiased indication its shares have been under slight distributional pressure over the past 50 days.
Charts used courtesy of www.stockcharts.com
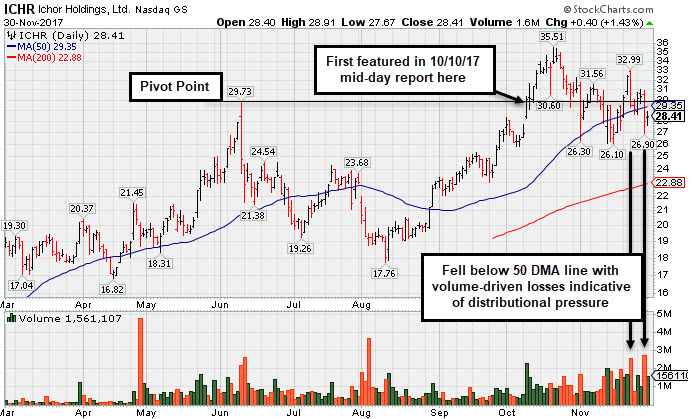
Damaging Losses Undercutting 50-Day Average Hurt Outlook - Thursday, November 30, 2017
Ichor Holdings Ltd (ICHR +$0.40 or +1.43% to $28.41) fell below its 50-day moving average (DMA) line ($29.35) with recent volume-driven losses indicative of distributional pressure, raising concerns. Recent lows in the $26.00 area define the next important support level to watch where a damaging violation would trigger a technical sell signal. A prompt rebound above its 50-day moving average (DMA) line is needed for its outlook to improve.
ICHR was last shown in this FSU section on 11/03/17 with an annotated graph under the headline "Undercut Prior Highs and Tested 50-Day Moving Average Line". It was highlighted in yellow with pivot point cited based on its 10/02/17 high in the 10/10/17 mid-day report (read here). Volume was more than 3 times averages as it gapped up and hit a new all-time high, rising from a cup-with-handle base.
It currently has a Timeliness rating of A and a Sponsorship rating of C. It has reported great earnings increases, above the +25% minimum guideline (C criteria) for the past 6 quarterly comparisons through Sep '17, helping it match the fact-based investment system's fundamental guidelines. Its limited annual history (A criteria) is a concern, and it is up considerably from its $9 IPO on 12/09/16.
The number of top-rated funds owning its shares rose from 29 on Dec '16 to 177 in Sep '17, a very reassuring sign concerning the I criteria. Its small supply of only 17.9 million shares in the public float (S criteria) can contribute to greater price volatility in the event of institutional buying or selling. Its current Up/Down Volume ratio of 1.2 is an unbiased indication its shares have been under accumulation over the past 50 days.
Charts used courtesy of www.stockcharts.com
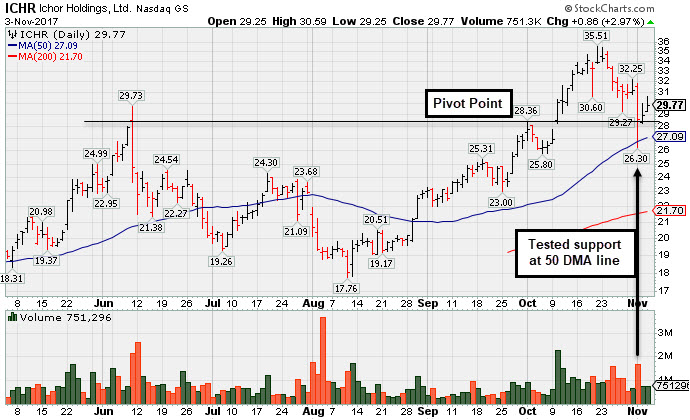
Undercut Prior Highs and Tested 50-Day Moving Average Line - Friday, November 3, 2017
Ichor Holdings Ltd (ICHR +$0.86 or +2.97% to $29.77) tested support at its 50-day moving average (DMA) line this week while enduring distributional pressure. After undercutting its "max buy" level and prior highs in the $29 area its color code was changed to yellow. However, more damaging losses would raise greater concerns.
The high-ranked Electronics - Semiconductor Equipment firm is due to report Sep '17 earnings news on Thursday, November 9th, 2017 after the close of the market. Volume and volatility often increase near earnings news. It was last shown in this FSU section on 10/10/17 with an annotated graph under the headline "Semiconductor Equipment Firm Finished Strong After Highlighted", after highlighted in yellow with pivot point cited based on its 10/02/17 high in the earlier mid-day report (read here). Volume was more than 3 times averages as it gapped up and hit a new all-time high, rising from a cup-with-handle base.
ICHR currently has a Timeliness rating of A and a Sponsorship rating of C. It has reported great earnings increases, above the +25% minimum guideline (C criteria) for the past 5 quarterly comparisons through Jun '17, helping it match the fact-based investment system's fundamental guidelines. Its limited annual history (A criteria) is a concern, and it is up considerably from its $9 IPO on 12/09/16.
The number of top-rated funds owning its shares rose from 29 on Dec '16 to 158 in Sep '17, a very reassuring sign concerning the I criteria. Its small supply of only 17.6 million shares in the public float (S criteria) can contribute to greater price volatility in the event of institutional buying or selling.
Charts used courtesy of www.stockcharts.com
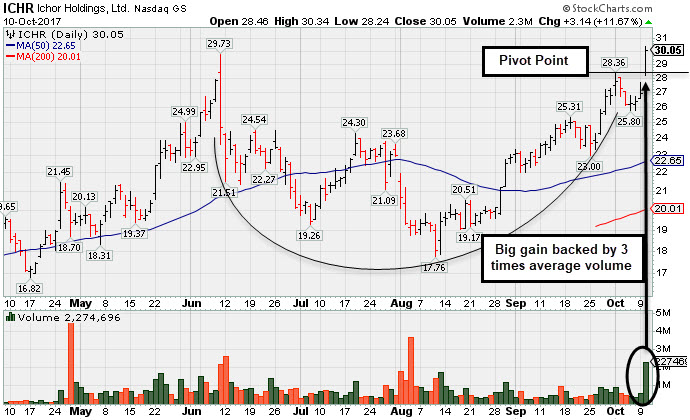
Semiconductor Equipment Firm Finished Strong After Highlighted - Tuesday, October 10, 2017
Ichor Holdings Ltd (ICHR +$3.14 or +11.67% to $30.05) finished strong after highlighted in yellow with pivot point cited based on its 10/02/17 high in the earlier mid-day report (read here). Volume was more than 3 times averages as it gapped up today and hit a new all-time high, rising from a cup-with-handle base. Disciplined investors avoid chasing stocks more than +5% above prior highs and always limit losses by selling any stock that falls more than -7% from their purchase price.
ICHR has reported great earnings increases, above the +25% minimum guideline (C criteria) for the past 5 quarterly comparisons through Jun '17, helping it match the fact-based investment system's fundamental guidelines. Its limited annual history (A criteria) is a concern, and it is up considerably from its $9 IPO on 12/09/16.
The number of top-rated funds owning its shares rose from 29 on Dec '16 to 151 in Sep '17, a very reassuring sign concerning the I criteria. Its small supply of only 5.5 million shares in the public float (S criteria) can contribute to greater price volatility in the event of institutional buying or selling.