Met Resistance at 50-Day Moving Average and Slumped - Tuesday, October 3, 2023
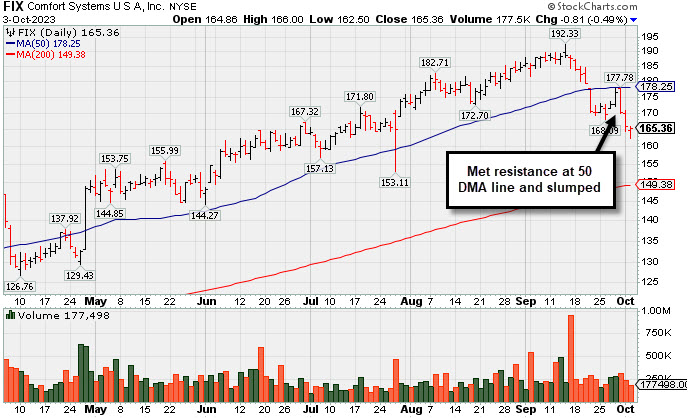
Comfort Systems U S A (FIX -$0.81 or -0.49% to $165.36) suffered a 3rd consecutive loss today, slumping after meeeting resistance near its 50-day moving average (DMA) line ($178.32). It will be dropped from the Featured Stocks list tonight. A rebound above the 50 DMA line is needed for its outlook to improve.
Fundamentals remain strong. Its annual earnings history (A criteria) has been strong and steady. It has a 98 Earnings Per Share Rating. It reported Jun '23 quarterly earnings +65% on +27% sales revenues versus the year-ago period. FIX was highlighted in yellow in the 2/23/23 mid-day report (read here) with a pivot point cited based on its 11/23/22 high plus 10 cents. It was last shown in greater detail on 9/21/23 with an annotated graph under the headline, "Violated 50-Day Moving Average With a Damaging Gap Down".
It hails from the Building - A/C & Heating Products group which is currently ranked 4th on the 197 Industry Groups list. It has a small supply of only 35.8 million shares outstanding (S criteria) which can contribute to greater price volatility in the event of institutional buying or selling. The number of top-rated funds that own its shares rose from 487 in Jun '22 to 659 in Jun '23, a reassuring sign regarding the I criteria. Its current Up/Down Volume Ratio of 0.8 is an unbiased indication its shares have been under distributional pressure over the past 50 days.
Violated 50-Day Moving Average With a Damaging Gap Down - Thursday, September 21, 2023
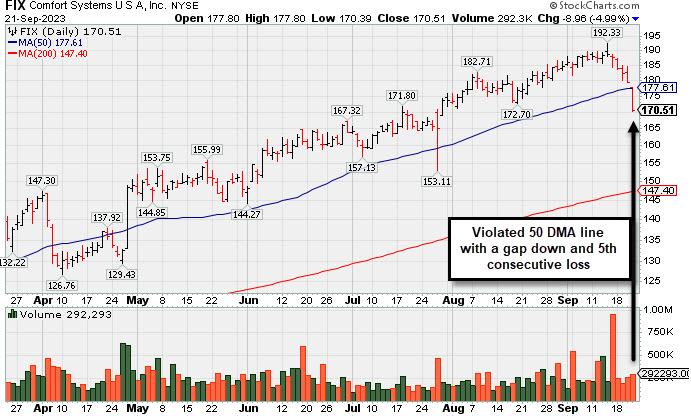
Comfort Systems U S A (FIX -$8.97 or -5.00% to $170.50) gapped down today violating its 50-day moving average (DMA) line ($177.72) triggering a technical sell signal. Only a prompt rebound above the 50 DMA line would help its outlook improve.
Fundamentals remain strong. Its annual earnings history (A criteria) has been strong and steady. It has a 98 Earnings Per Share Rating. It reported Jun '23 quarterly earnings +65% on +27% sales revenues versus the year-ago period. FIX was highlighted in yellow in the 2/23/23 mid-day report (read here) with a pivot point cited based on its 11/23/22 high plus 10 cents. It was last shown in greater detail on 8/21/23 with an annotated graph under the headline, "FIX Still Stubbornly Hovering Near High".
It hails from the Building - A/C & Heating Products group which is currently ranked 9th on the 197 Industry Groups list. It has a small supply of only 35.8 million shares outstanding (S criteria) which can contribute to greater price volatility in the event of institutional buying or selling. The number of top-rated funds that own its shares rose from 487 in Jun '22 to 652 in Jun '23, a reassuring sign regarding the I criteria. Its current Up/Down Volume Ratio of 0.9 is an unbiased indication its shares have been under slight distributional pressure over the past 50 days.
FIX Still Stubbornly Hovering Near High - Monday, August 21, 2023
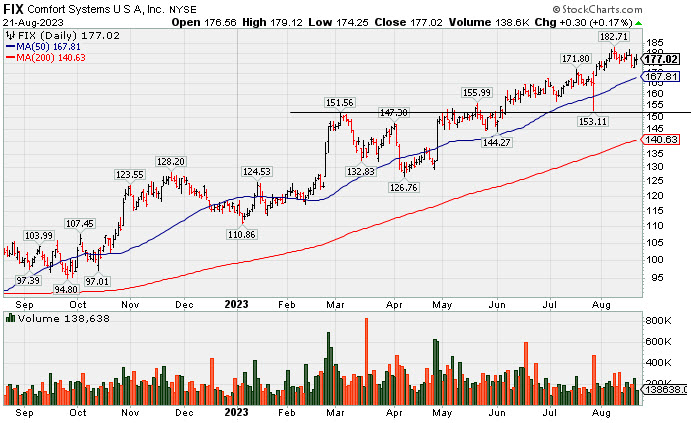
Comfort Systems U S A (FIX +$0.30 or +0.17% to $177.02) is still stubbornly holding its ground near its all-time high. Its 50-day moving average (DMA) line ($168) defines important near-term support to watch on pullbacks. Fundamentals remain strong.
Its annual earnings history (A criteria) has been strong and steady. It has a 98 Earnings Per Share Rating. It reported Jun '23 quarterly earnings +65% on +27% sales revenues versus the year-ago period. FIX was highlighted in yellow in the 2/23/23 mid-day report (read here) with a pivot point cited based on its 11/23/22 high plus 10 cents. It was last shown in greater detail on 7/19/23 with an annotated graph under the headline, "Pulled Back From High With Lighter Volume".
It hails from the Building - A/C & Heating Products group which is currently ranked 7th on the 197 Industry Groups list. It has a small supply of only 35.8 million shares outstanding (S criteria) which can contribute to greater price volatility in the event of institutional buying or selling. The number of top-rated funds that own its shares rose from 487 in Jun '22 to 643 in Jun '23, a reassuring sign regarding the I criteria.
Pulled Back From High With Lighter Volume - Wednesday, July 19, 2023
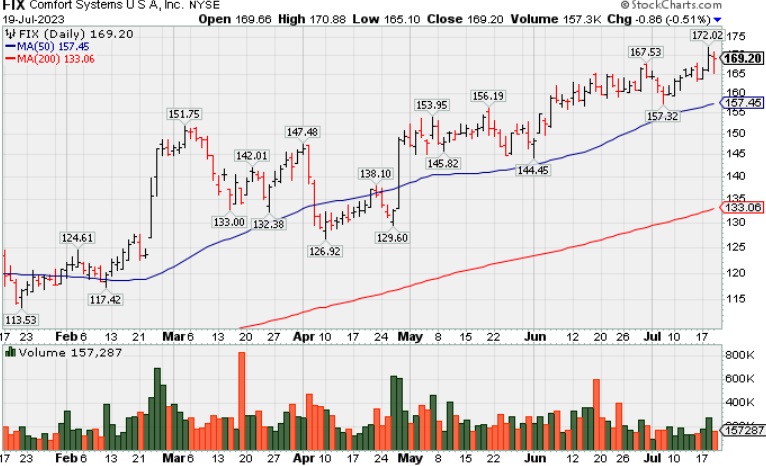
Comfort Systems U S A (FIX -$0.86 to $169.20) pulled back today after a solid gain on the prior session with above-average volume hitting another new all-time high. No resistance remains due to overhead supply. Its 50-day moving average (DMA) line ($157.48) defines important near-term support to watch on pullbacks. Keep in mind it is due to report Jun '23 quarterly results on 7/27/23. Volume and volatility often increase near earnings news.
Its annual earnings history (A criteria) has been strong and steady. It has a 98 Earnings Per Share Rating. Bullish action came after it reported Mar '23 quarterly earnings +66% on +33% sales revenues versus the year-ago period. FIX was highlighted in yellow in the 2/23/23 mid-day report (read here) with a pivot point cited based on its 11/23/22 high plus 10 cents. It was last shown in greater detail on 6/16/23 with an annotated graph under the headline, "'Negative Reversal' Following Recent Volume-Driven Gains".
It hails from the Building - A/C & Heating Products group which is currently ranked 13th on the 197 Industry Groups list. It has a small supply of only 35.8 million shares outstanding (S criteria) which can contribute to greater price volatility in the event of institutional buying or selling. The number of top-rated funds that own its shares rose from 487 in Jun '22 to 622 in Jun '23, a reassuring sign regarding the I criteria.
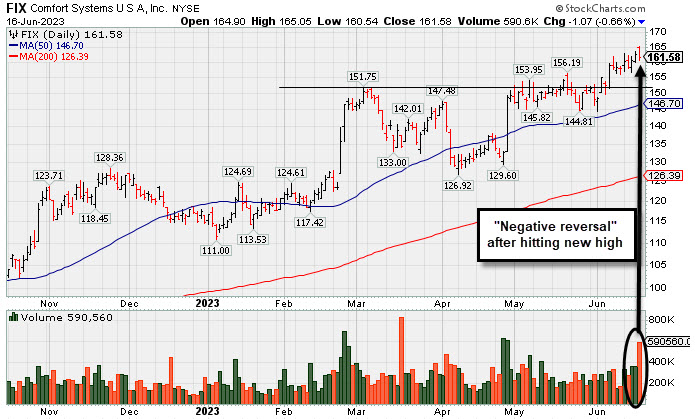
"Negative Reversal" Following Recent Volume-Driven Gains - Friday, June 16, 2023
Comfort Systems U S A (FIX -$1.07 or -0.66% to $161.58) had a "negative reversal" after hitting a new all-time high. No resistance remains due to overhead supply. Its current Up/Down Volume Ratio of 1.3 is an unbiased indication its shares have been under accumulation over the past 50 days.
Annual earnings history has been strong and steady. It now has a 98 Earnings Per Share Rating. Bullish action came after it reported Mar '23 quarterly earnings +66% on +33% sales revenues versus the year-ago period. FIX was highlighted in yellow in the 2/23/23 mid-day report (read here) with a pivot point cited based on its 11/23/22 high plus 10 cents. It was last shown in greater detail on 5/12/23 with an annotated graph under the headline, "Churning Action While Recently Hovering Near All-Time High".
It hails from the Building - A/C & Heating Products group which is currently ranked 23rd on the 197 Industry Groups list. It has a small supply of only 35.8 million shares outstanding (S criteria) which can contribute to greater price volatility in the event of institutional buying or selling. The number of top-rated funds that own its shares rose from 487 in Jun '22 to 607 in Mar '23, a reassuring sign regarding the I criteria.
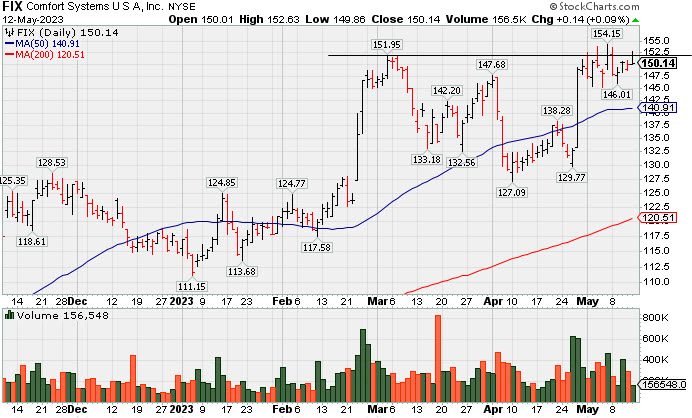
Churning Action While Recently Hovering Near All-Time High - Friday, May 12, 2023
Comfort Systems U S A (FIX +$0.29 or +0.19% to $150.29) inched higher today with lighter volume. No resistance remains due to overhead supply, however, it has made no meaningful price progress in the past 2 weeks while churing above average volume, which is action indictive of distributional pressure. Its current Up/Down Volume Ratio of 1.0 is an unbiased indication of neutral action over the past 50 days concerning Accumulation/Distribution. Additional confirming volume-driven gains to new highs would be a reassuring sign of fresh institutional buying demand. Its 50-day moving average (DMA) line ($141) defines near-term support to watch on pullbacks.
Annual earnings history has been strong and steady. It now has a 98 Earnings Per Share Rating. Bullish action came after it reported Mar '23 quarterly earnings +66% on +33% sales revenues versus the year-ago period. FIX was highlighted in yellow in the 2/23/23 mid-day report (read here) with a pivot point cited based on its 11/23/22 high plus 10 cents. It was last shown in greater detail on 4/21/23 with an annotated graph under the headline, "Consolidating Near 50-Day Moving Average and -10.5% off High."
It hails from the Building - A/C & Heating Products group which is currently ranked 26th on the 197 Industry Groups list. It has a small supply of only 35.8 million shares outstanding (S criteria) which can contribute to greater price volatility in the event of institutional buying or selling. The number of top-rated funds that own its shares rose from 487 in Jun '22 to 594 in Mar '23, a reassuring sign regarding the I criteria. Its current Up/Down Volume Ratio is 1.0, an unbiased indication its shares have been under accumulation over the past 50 days.
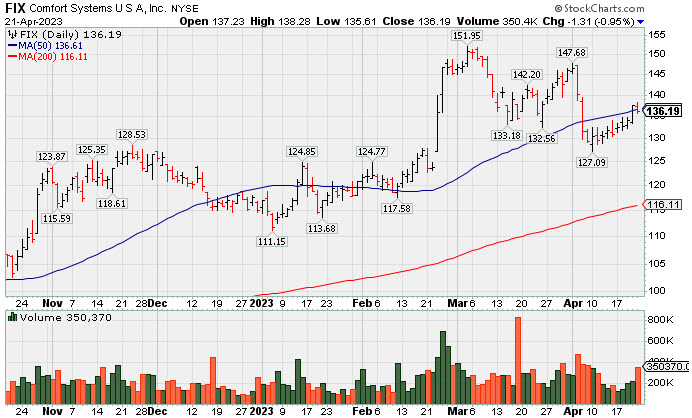
Consolidating Near 50-Day Moving Average and -10.5% off High - Friday, April 21, 2023
Comfort Systems U S A (FIX -$1.31 or -0.95% to $136.19) is consolidating near its 50-day moving average (DMA) line ($136.69) after quiet gains helped its outlook improve. It has not formed a sound new base, and it faces resistance due to overhead supply up to the $152 level. Fundamentals remain strong.
FIX was highlighted in yellow in the 2/23/23 mid-day report (read here) with a pivot point cited based on its 11/23/22 high plus 10 cents. It broke out hitting a new 52-week high (N criteria) with volume +131% above average behind the gain, triggering a technical buy signal while rising from an orderly 3-month base. It was last shown in greater detail on 4/04/23 with an annotated graph under the headline, "Pullback With Higher Volume While Consolidating".
Bullish action came after it reported earnings +48% on +31% sales revenues for the Dec '22 quarter versus the year ago period, its 4th strong quarter above the +25% minimum guideline (C criteria). Annual earning history has been strong and steady. It has a 97 Earnings Per Share Rating.
Pullback With Higher Volume While Consolidating - Tuesday, April 4, 2023
Comfort Systems U S A (FIX -$6.41 or -4.37% to $140.20) pulled back today with above-average volume, action indicative of distributional pressure. It has been consolidating well above its 50-day moving average (DMA) line ($133.81) and the prior low ($132.56 on 3/24/23) defining important support to watch. Fundamentals remain strong.
FIX was highlighted in yellow in the 2/23/23 mid-day report (read here) with a pivot point cited based on its 11/23/22 high plus 10 cents. It broke out hitting a new 52-week high (N criteria) with volume +131% above average behind the gain, triggering a technical buy signal while rising from an orderly 3-month base. It was last shown in greater detail on 3/16/23 with an annotated graph under the headline, "Consolidating Above Support at Prior High and 50-Day Moving Average".
Bullish action came after it reported earnings +48% on +31% sales revenues for the Dec '22 quarter versus the year ago period, its 4th strong quarter above the +25% minimum guideline (C criteria). Annual earning history has been strong and steady. It has a 97 Earnings Per Share Rating.
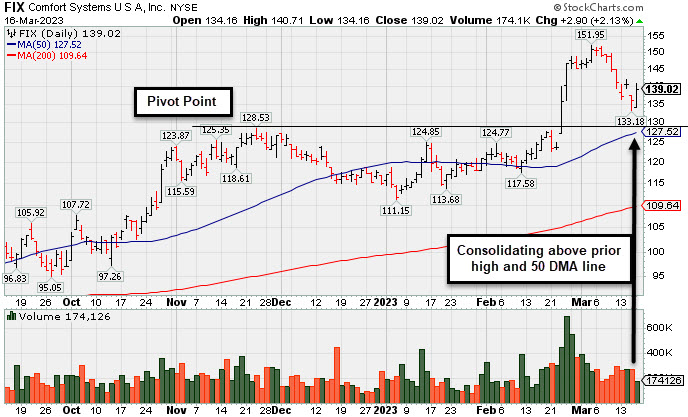
Consolidating Above Support at Prior High and 50-Day Moving Average - Thursday, March 16, 2023
Comfort Systems U S A (FIX +$2.90 or +2.13% to $139.02) is consolidating above prior highs in the $128 area its 50-day moving average (DMA) line ($127.52) which define important near-term support to watch. Broader market weakness (M criteria) has been noted as a "correction" that has raised concerns.
FIX was highlighted in yellow in the 2/23/23 mid-day report (read here) with a pivot point cited based on its 11/23/22 high plus 10 cents. It broke out hitting a new 52-week high (N criteria) with volume +131% above average behind the gain, triggering a technical buy signal while rising from an orderly 3-month base. It was shown in greater detail that evening with an annotated graph under the headline, "Powerful Technical Breakout After Earnings Report". The bullish action came after it reported earnings +48% on +31% sales revenues for the Dec '22 quarter versus the year ago period, its 4th strong quarter above the +25% minimum guideline (C criteria). Annual earning history has been strong and steady.
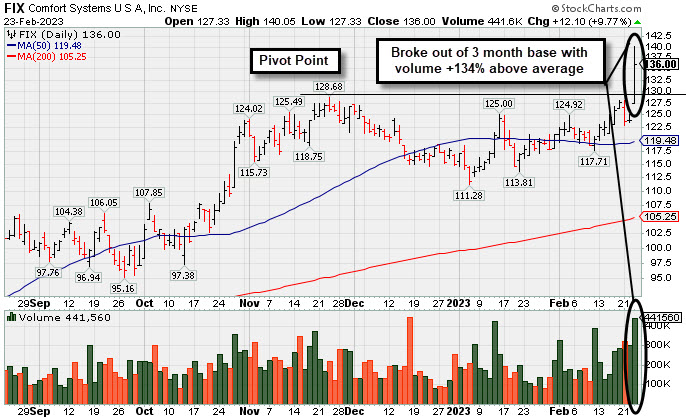
Powerful Technical Breakout After Earnings Report - Thursday, February 23, 2023
Comfort Systems U S A (FIX +$12.10 or +9.77% to $136.00) finished strong today after highlighted in yellow in the mid-day report (read here) with a pivot point cited based on its 11/23/22 high plus 10 cents. It broke out hitting a new 52-week high (N criteria) with volume +131% above average behind the gain, triggering a technical buy signal while rising from an orderly 3-month base. Volume and volatility often increase near earnings news. The bullish action came after it reported earnings +48% on +31% sales revenues for the Dec '22 quarter versus the year ago period, its 4th strong quarter above the +25% minimum guideline (C criteria). Annual earning history has been strong and steady.
