There are no featured stock write-ups on EPAM proir to 2/17/2025
 Upgrade your membership to see all of the expert analysis we have published on EPAM now!
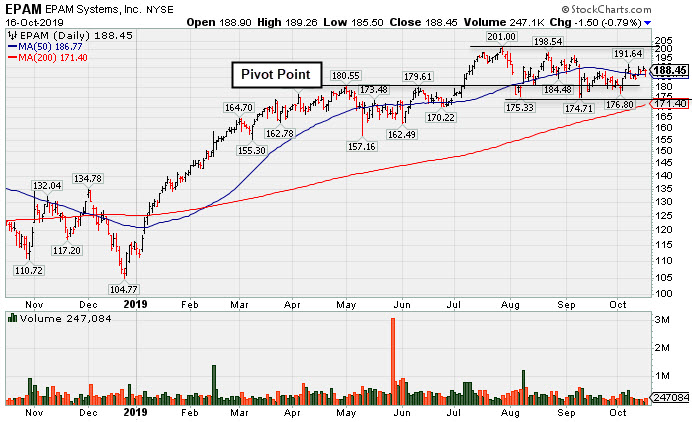
Faces Some Resistance Due to Overhead Supply - Wednesday, October 16, 2019
Epam Systems Inc (EPAM -$1.50 or -0.79% to $188.45) is consolidating above its 50-day moving average (DMA) line ($186.76). It faces some resistance due to overhead supply up to the $201 level. meanwhile, prior lows in the $174-175 area define the next important support level.
It recently reported earnings +27% on +24% sales revenues for the Jun '19 quarter, continuing its strong earnings track record. Fundamentals remain strong with a 97 Earnings Per Share Rating, well above the 80+ minimum guideline for buy candidates. The Computer - Tech Services firm's annual earnings history (A criteria) has been strong. It was last shown in this FSU section on 9/30/19 with an annotated graph under the headline, "Slumped and Sputtered Below 50-Day Moving Average".
The number of top-rated funds owning its shares rose from 462 in Jun '17 to 911 in Sep '19, a reassuring sign concerning the I criteria. Its current Up/Down Volume Ratio of 1.5 is an unbiased indication its shares have been under accumulation over the past 50 days. Its small supply of only 51.6 million shares (S criteria) in the pubic float can contribute to greater volatility in the event of institutional buying or selling. Its Relative Strength rating of 91 is above the 80+ minimum guideline for buy candidates.
Charts courtesy of www.stockcharts.com
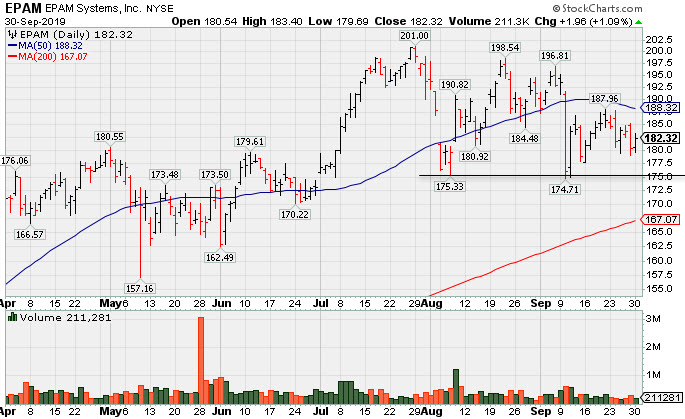
Slumped and Sputtered Below 50-Day Moving Average - Monday, September 30, 2019
Epam Systems Inc (EPAM +$1.96 or +1.09% to $182.32) rebound above its 50-day moving average (DMA) line ($188.31) is still needed for its outlook to improve. It also faces some resistance due to overhead supply up to the $201 level.Prior lows in the $174-175 area define the next important support level where any violations may trigger more worrisome technical sell signals.
It recently reported earnings +27% on +24% sales revenues for the Jun '19 quarter, continuing its strong earnings track record. Fundamentals remain strong with a 97 Earnings Per Share Rating, well above the 80+ minimum guideline for buy candidates. The Computer - Tech Services firm's annual earnings history (A criteria) has been strong. It was last shown in this FSU section on 9/16/19 with an annotated graph under the headline, "Recent Slump Below 50-Day Average Hurt Outlook".
The number of top-rated funds owning its shares rose from 462 in Jun '17 to 854 in Jun '19, a reassuring sign concerning the I criteria. Its current Up/Down Volume Ratio of 1.1 is an unbiased indication its shares have been under slight accumulation over the past 50 days. Its small supply of only 51.6 million shares (S criteria) in the pubic float can contribute to greater volatility in the event of institutional buying or selling. Its Relative Strength rating of 91 is above the 80+ minimum guideline for buy candidates.
Charts courtesy of www.stockcharts.com
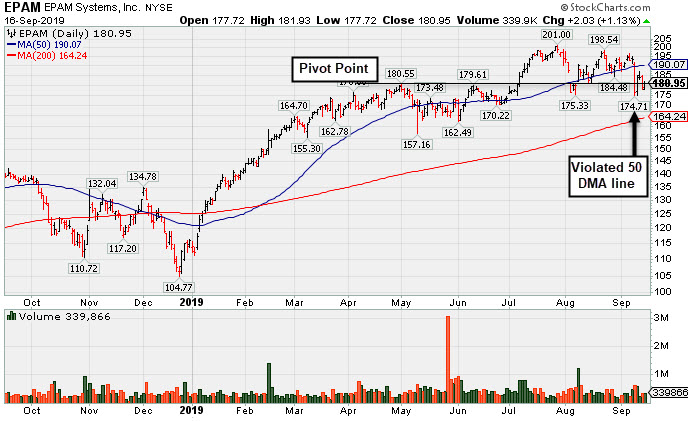
Recent Slump Below 50-Day Average Hurt Outlook - Monday, September 16, 2019
Epam Systems Inc (EPAM +$2.03 or +1.13% to $180.95) halted its slide above the prior low ($175.33 on 8/07/19) which defines the next important support level. A rebound above its 50 DMA line ($190) is needed for its outlook to improve. It also faces some resistance due to overhead supply up to the $201 level.
It recently reported earnings +27% on +24% sales revenues for the Jun '19 quarter, continuing its strong earnings track record. Fundamentals remain strong with a 97 Earnings Per Share Rating, well above the 80+ minimum guideline for buy candidates. The Computer - Tech Services firm's annual earnings history (A criteria) has been strong. It was last shown in this FSU section on 8/29/19 with an annotated graph under the headline, "Volume Light During Brief Consolidation Above 50-Day Average".
The number of top-rated funds owning its shares rose from 462 in Jun '17 to 852 in Jun '19, a reassuring sign concerning the I criteria. Its current Up/Down Volume Ratio of 1.5 is an unbiased indication its shares have been under accumulation over the past 50 days. Its small supply of only 51.6 million shares (S criteria) in the pubic float can contribute to greater volatility in the event of institutional buying or selling. Its Relative Strength rating of 90 is above the 80+ minimum guideline for buy candidates.
Charts courtesy of www.stockcharts.com
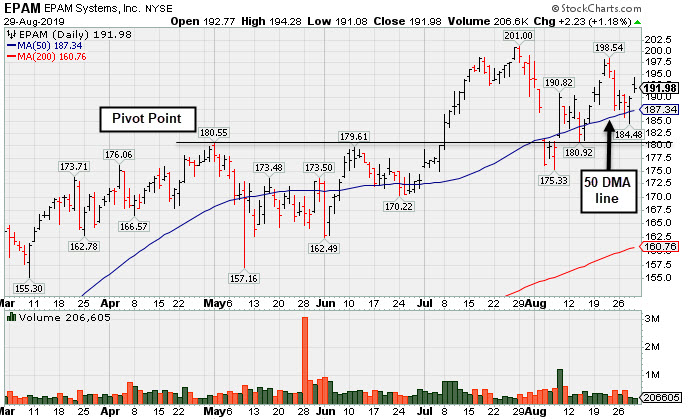
Volume Light During Brief Consolidation Above 50-Day Average - Thursday, August 29, 2019
Epam Systems Inc's (EPAM $191.98 +$2.23 +1.18%) has found support at its 50-day moving average (DMA) line ($187.33 while recent volume totals have been cooling. It has not formed a new base of sufficient length and faces some resistance due to overhead supply up to the $201 level.
It recently reported earnings +27% on +24% sales revenues for the Jun '19 quarter, continuing its strong earnings track record. Fundamentals remain strong with a 97 Earnings Per Share Rating, well above the 80+ minimum guideline for buy candidates. The Computer - Tech Services firm's annual earnings history (A criteria) has been strong. It was last shown in this FSU section on 8/12/19 with an annotated graph under the headline, "Rebounded Above 50-Day Average Following Earnings Report".
The number of top-rated funds owning its shares rose from 462 in Jun '17 to 826 in Jun '19, a reassuring sign concerning the I criteria. Its current Up/Down Volume Ratio of 1.7 is an unbiased indication its shares have been under accumulation over the past 50 days. Its small supply of only 51.4 million shares (S criteria) in the pubic float can contribute to greater volatility in the event of institutional buying or selling. Its Relative Strength rating of 93 is above the 80+ minimum guideline for buy candidates.
Charts courtesy of www.stockcharts.com
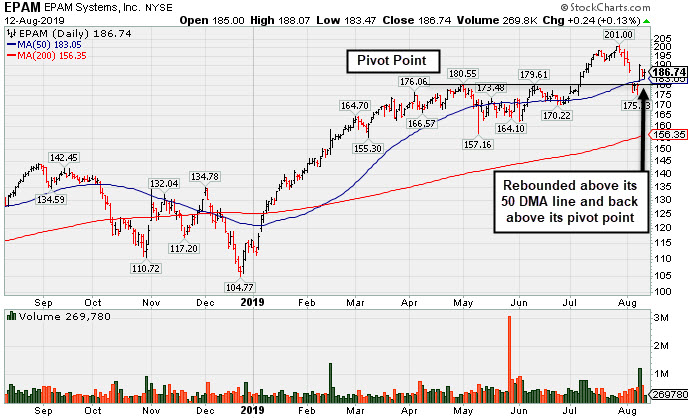
Rebounded Above 50-Day Average Following Earnings Report - Monday, August 12, 2019
Epam Systems Inc's (EPAM -$0.06 or -0.03% to $186.44) color code was changed to yellow after reporting earnings +27% on +24% sales revenues , continuing its strong earnings track record. A rebound above its 50-day moving average (DMA) line ($183.05) helped its outlook to improve.
Fundamentals remain strong with a 97 Earnings Per Share Rating, well above the 80+ minimum guideline for buy candidates. The Computer - Tech Services firm's annual earnings history (A criteria) has been strong. It was last shown in this FSU section on 7/12/19 with an annotated graph under the headline, "Winning Streak Leaves IT Firm Extended From Prior Base".
The number of top-rated funds owning its shares rose from 462 in Jun '17 to 803 in Jun '19, a reassuring sign concerning the I criteria. Its small supply of only 51.4 million shares (S criteria) in the pubic float can contribute to greater volatility in the event of institutional buying or selling. Its Relative Strength rating of 94 is above the 80+ minimum guideline for buy candidates.
Charts courtesy of www.stockcharts.com
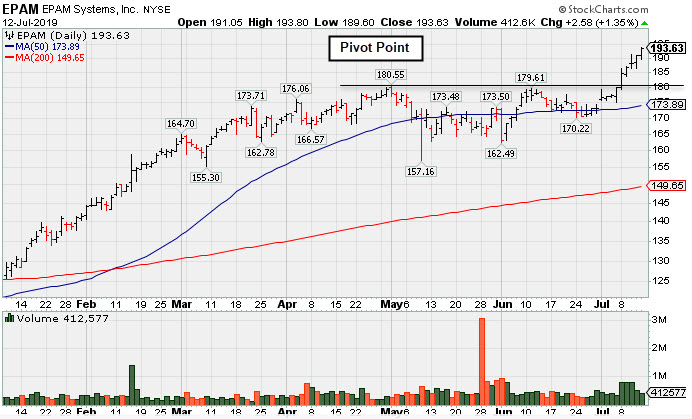
Winning Streak Leaves IT Firm Extended From Prior Base - Friday, July 12, 2019
Epam Systems Inc (EPAM +$2.58 or +1.35% to $193.63) is extended from any sound base and perched at its 52-week high. Its color code was changed to green after rallying above its "max buy" level during an impressive streak of 12 consecutive gains. Prior highs in the $179-180 area define initial support above its 50-day moving average (DMA) line ($173.89).
EPAM reported earnings +34% on +23% sales revenues for the Mar '19 quarter, continuing its strong earnings track record. Fundamentals remain strong with a 97 Earnings Per Share Rating, well above the 80+ minimum guideline for buy candidates.The Computer - Tech Services firm's annual earnings history (A criteria) has been strong. It was last shown in this FSU section on 6/13/19 with an annotated graph under the headline, "Perched Near Pivot Point After a New Flat Base".
The number of top-rated funds owning its shares rose from 462 in Jun '17 to 721 in Mar '19, a reassuring sign concerning the I criteria. Its small supply of only 51.4 million shares (S criteria) in the pubic float can contribute to greater volatility in the event of institutional buying or selling. Its Relative Strength rating of 95 is above the 80+ minimum guideline for buy candidates.
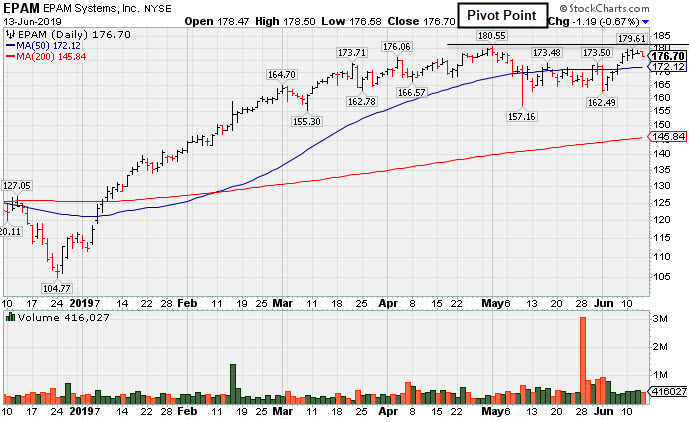
Perched Near Pivot Point After a New Flat Base - Thursday, June 13, 2019
Epam Systems Inc (EPAM -$1.19 or -0.67% to $176.70) recently rebounded above its 50-day moving average (DMA) line ($172) helping its outlook to improve. It is perched within close striking distance of its 52-week high. Subsequent gains above the pivot point backed by at least +40% above average volume may trigger a new (or add-on) technical buy signal.
EPAM reported earnings +34% on +23% sales revenues for the Mar '19 quarter, continuing its strong earnings track record. Fundamentals remain strong with a 97 Earnings Per Share Rating, well above the 80+ minimum guideline for buy candidates.The Computer - Tech Services firm's annual earnings history (A criteria) has been strong. It was last shown in this FSU section on 5/09/19 with an annotated graph under the headline, "Found Support and Closed in Upper Third of Day's Range".
The number of top-rated funds owning its shares rose from 462 in Jun '17 to 631 in Mar '19, a reassuring sign concerning the I criteria. Its small supply of only 51.4 million shares (S criteria) in the pubic float can contribute to greater volatility in the event of institutional buying or selling. Its Relative Strength rating of 94 is above the 80+ minimum guideline for buy candidates.
Found Support and Closed in Upper Third of Day's Range - Thursday, May 9, 2019
Epam Systems Inc (EPAM -$0.63 or -0.37% to $169.79) was highlighted in yellow in the earlier mid-day report (read here). Although it is extended from any recent base, after finding support at the 10 WMA it is considered a valid "secondary buy point" up to +5% above the latest high. It found support after gapping down today violating its 50-day moving average (DMA) line ($170). It was last shown in this FSU section on 10/05/18 with an annotated graph under the headline, "Slump Below 50-Day Moving Average Raised Concerns".
EPAM reported earnings +34% on +23% sales revenues for the Mar '19 quarter, continuing its strong earnings track record. Fundamentals remain strong with a 95 Earnings Per Share Rating, well above the 80+ minimum guideline for buy candidates.The Computer - Tech Services firm's annual earnings history (A criteria) has been strong. It showed resilience and strength after slumping below its 200 DMA line when dropped from the Featured Stocks list on 10/10/18.
The number of top-rated funds owning its shares rose from 462 in Jun '17 to 623 in Mar '19, a reassuring sign concerning the I criteria. Its small supply of only 51.3 million shares (S criteria) in the pubic float can contribute to greater volatility in the event of institutional buying or selling. Its Relative Strength rating of 94 is above the 80+ minimum guideline for buy candidates.
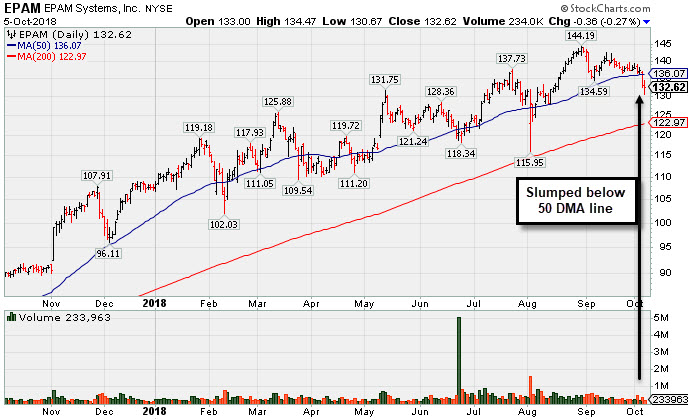
Slump Below 50-Day Moving Average Raised Concerns - Friday, October 5, 2018
Epam Systems Inc (EPAM -$0.36 or -0.27% to $132.62) slumped below its 50-day moving average (DMA) line ($136.07) and undercut the recent low ($134.59) triggering technical sell signals this week. Only a prompt rebound above the 50 DMA line would help its outlook improve. In recent months, it repeatedly undercut its 50 DMA line before recovering. Obviously, the 200 DMA line ($123) and prior low ($115) now define the next important near term support levels to watch.
Fundamentals remain strong with a 91 Earnings Per Share Rating, well above the 80+ minimum guideline for buy candidates.The Computer - Tech Services firm reported Jun '18 earnings +26% on +28% sales revenues, above the +25% minimum earnings guideline (C criteria), continuing its strong earnings track record with encouraging underlying sales revenues growth. Annual earnings history (A criteria) remained strong after it was dropped from Featured Stocks list on 8/11/15.
The number of top-rated funds owning its shares rose from 462 in Jun '17 to 595 in Jun '18, a reassuring sign concerning the I criteria. Its small supply of only 50.6 million shares (S criteria) in the pubic float can contribute to greater volatility in the event of institutional buying or selling. Its Relative Strength rating of 88 is above the 80+ minimum guideline for buy candidates.
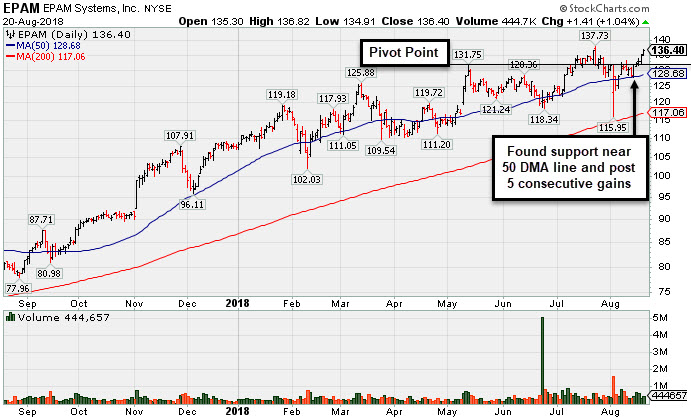
Tech Services Firm Remains Fundamentally and Technically Strong - Monday, August 20, 2018
Epam Systems Inc (EPAM +$1.41 or +1.04% to $136.40) posted a 5th consecutive gain with light or average volume and finished Monday's session 4 cents below its best ever close. It found support above its 50-day moving average DMA line ($128.68) during the most recent consolidation. The recent low ($115) and 200 DMA line also define important near term support to watch.
Fundamentals remain strong with a 91 Earnings Per Share Rating, well above the 80+ minimum guideline for buy candidates. The Computer - Tech Services firm reported Jun '18 earnings +26% on +28% sales revenues, above the +25% minimum earnings guideline (C criteria), continuing its strong earnings track record with encouraging underlying sales revenues growth. Annual earnings history (A criteria) remained strong after it was dropped from Featured Stocks list on 8/11/15.
The number of top-rated funds owning its shares rose from 462 in Jun '17 to 565 in Jun '18, a reassuring sign concerning the I criteria. Its small supply of only 50.2 million shares (S criteria) in the pubic float can contribute to greater volatility in the event of institutional buying or selling. Its Relative Strength rating of 89 is above the 80+ minimum guideline for buy candidates.
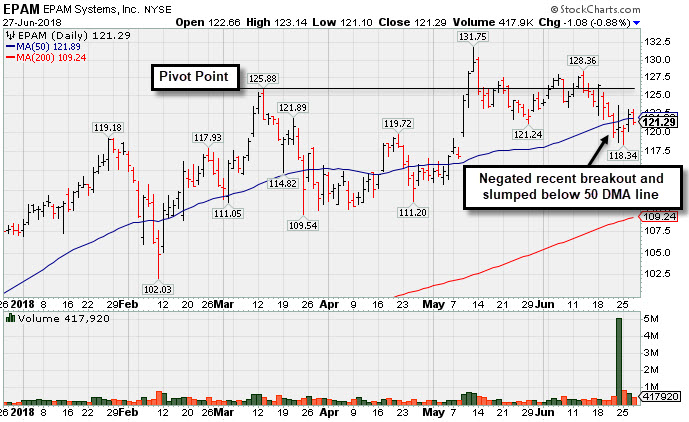
Sputtering Below 50-Day Average After Negating Prior Breakout - Wednesday, June 27, 2018
Epam Systems Inc (EPAM -$1.08 or -0.88% to $121.29) has been sputtering below its 50-day moving average (DMA) line ($121.89). Recent losses negated the prior breakout raising concerns, and additional losses triggered a technical sell signal. More damaging losses would raise serious concerns. A convincing rebound above the 50 DMA line and above the previously cited pivot point would be a reassuring sign.
Bullish action came after the Computer - Tech Services firm reported Mar '18 earnings +29% on +31% sales revenues, above the +25% minimum earnings guideline (C criteria). Sequential quarterly comparisons show strong earnings with an encouraging acceleration in sales revenues growth. Annual earnings history (A criteria) remained strong after it was dropped from Featured Stocks list on 8/11/15.
Fundamentally, it still has a strong 94 Earnings Per Share Rating, well above the 80+ minimum guideline for buy candidates. The number of top-rated funds owning its shares rose from 462 in Jun '17 to 544 in Mar '18, a reassuring sign concerning the I criteria. Its small supply of only 49.9 million shares (S criteria) in the pubic float can contribute to greater volatility in the event of institutional buying or selling. Its Relative Strength rating of 87 is above the 80+ minimum guideline for buy candidates.
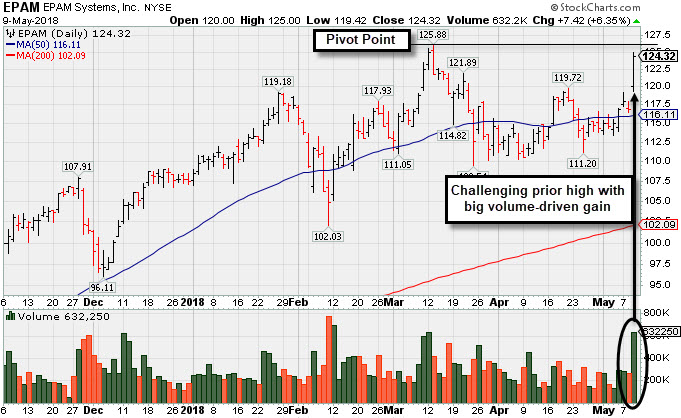
Volume-Driven Gain Challenged Prior High Following Earnings - Wednesday, May 9, 2018
Epam Systems Inc (EPAM +$7.42 or +6.35% to $124.32) finished strong after highlighted in yellow with pivot point cited based on its 3/13/18 high plus 10 cents in the earlier mid-day report (read here). It gapped up today with a big volume-driven gain challenging its all-time high. Subsequent gains for new highs (N criteria) above the pivot point backed by at least +40% above average volume are needed to trigger a proper technical buy signal.
Bullish action came after the Computer - Tech Services firm reported Mar '18 earnings +29% on +31% sales revenues, above the +25% minimum earnings guideline (C criteria). Sequential quarterly comparisons show strong earnings with an encouraging acceleration in sales revenues growth. Annual earnings history (A criteria) remained strong after it was dropped from Featured Stocks list on 8/11/15. It was last shown in this FSU section on 8/11/15 with an annotated graph under the headline, "Fundamental and Technical Concerns Hurt Outlook".
Fundamentally, it still has a strong 94 Earnings Per Share Rating, well above the 80+ minimum guideline for buy candidates. The number of top-rated funds owning its shares rose from 462 in Jun '17 to 529 in Mar '18, a reassuring sign concerning the I criteria. Its small supply of only 49.9 million shares (S criteria) in the pubic float can contribute to greater volatility in the event of institutional buying or selling. Its Relative Strength rating of 87 is above the 80+ minimum guideline for buy candidates.
Fundamental and Technical Concerns Hurt Outlook - Tuesday, August 11, 2015
Epam Systems Inc (EPAM -$1.18 or -1.67% to $69.58) slumped further below its 50-day moving average (DMA) line. A rebound above that short-term average is needed to help its outlook improve. It will be dropped from the Featured Stocks list tonight due to fundamental and technical deterioration noted recently.
Fundamentally, it still has a strong 94 Earnings Per Share Rating, well above the 80+ minimum guideline for buy candidates. However, it reported earnings +21% on +25% sales revenues for the Jun '15 quarter, below the +25% minimum guideline (C criteria), raising fundamental concerns. It had previously reported earnings +33%, +40%, +29%, and +30% in the Jun, Sep, Dec '14 and Mar '15 quarterly comparisons versus the year ago periods, respectively. Sales revenues rose +31%, +38%, +28% and +25% during that span. Annual earnings growth (A criteria) has been strong.
The Computer - Tech Services firm violated its 50 DMA line triggering a technical sell signal with damaging losses since last shown in this FSU section on 7/23/15 with an annotated graph under the headline, "Volume Totals Cooling While Consolidating Near Highs". Its Relative Strength rating of 95 remains well above the 80+ minimum guideline for buy candidates.
It completed Secondary Offerings 8/30/13 and 9/17/13. The number of top-rated funds owning its shares rose from 254 in Dec '13 to 376 Jun '15, a reassuring sign concerning the I criteria. Its small supply of only 41.1 million shares (S criteria) in the pubic float can contribute to greater volatility in the event of institutional buying or selling.
Volume Totals Cooling While Consolidating Near Highs - Thursday, July 23, 2015
Epam Systems Inc (EPAM -$0.95 or -1.27% to $73.91) still has been stubbornly holding its ground perched near its all-time high with volume totals cooling, an indication few are headed for the exit. Its 50-day moving average (DMA) line ($71.68) defines support where a violation would trigger a technical sell signal.
Keep in mind it is due to report earnings on 08/04/15, and volume and volatility often increase near earnings news. The high-ranked Computer - Tech Services firm was last shown in this FSU section on 6/30/15 with annotated graphs under the headline, "50 DMA Line Defines Support". A big gain on 5/28/15 backed by +117% above average volume as it rallied above its pivot point triggered a new (or add-on) technical buy signal. Fundamentally it is strong, with a 95 Earnings Per Share Rating, well above the 80+ minimum guideline for buy candidates.
It reported earnings +33%, +40%, +29%, and +30% in the Jun, Sep, Dec '14 and Mar '15 quarterly comparisons versus the year ago periods, respectively. Sales revenues rose +31%, +38%, +28% and +25% during that span. Its streak of 6 consecutive quarters with earnings above the +25% guideline makes it a solid match concerning the C criteria. Annual earnings growth (A criteria) has been strong. Its Relative Strength rating of 96 is now well above the 80+ minimum guideline for buy candidates.
It completed Secondary Offerings 8/30/13 and 9/17/13. The number of top-rated funds owning its shares rose from 254 in Dec '13 to 373 Jun '15, a reassuring sign concerning the I criteria. Its small supply of only 41.1 million shares (S criteria) in the pubic float can contribute to greater volatility in the event of institutional buying or selling.
X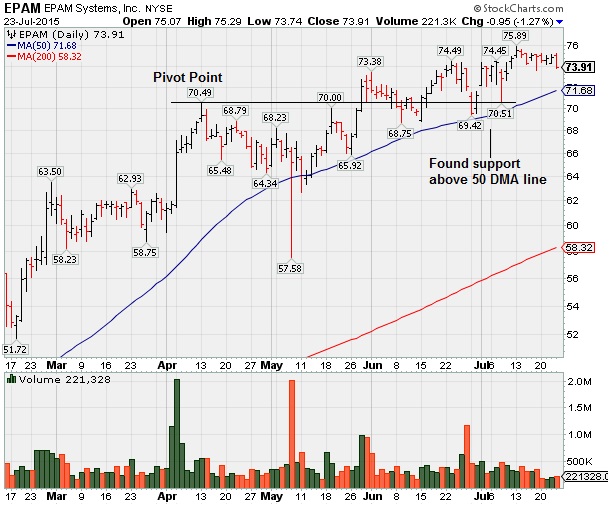
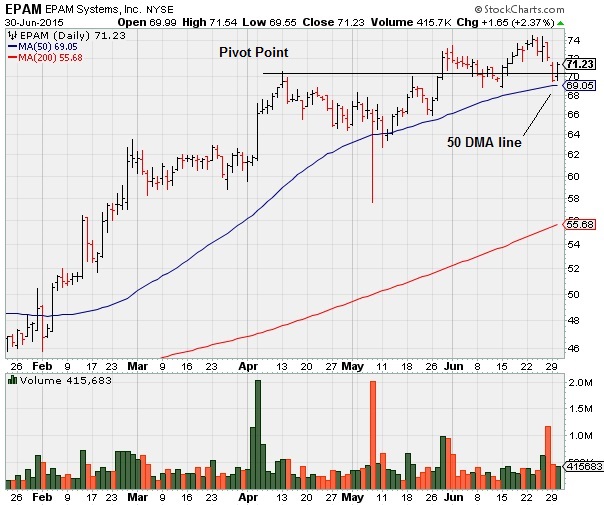
50 DMA Line Defines Support - Tuesday, June 30, 2015
Epam Systems Inc (EPAM +$1.65 or +2.37% to $71.23) is consolidating above its 50 DMA line. Subsequent damaging losses leading to a 50 DMA line violation would raise greater concerns and trigger technical sell signals.
The high-ranked Computer - Tech Services firm was last shown in this FSU section on 6/05/15 with annotated graphs under the headline, "
A big gain on 5/28/15 backed by +117% above average volume as it rallied above its pivot point triggered a new (or add-on) technical buy signal. The next important support is defined by its 50-day moving average DMA line. Damaging losses leading to violations would raise greater concerns and trigger a technical sell signal. Fundamentally it is strong, with a 95 Earnings Per Share Rating, well above the 80+ minimum guideline for buy candidates.
It reported earnings +33%, +40%, +29%, and +30% in the Jun, Sep, Dec '14 and Mar '15 quarterly comparisons versus the year ago periods, respectively. Sales revenues rose +31%, +38%, +28% and +25% during that span. Its streak of 6 consecutive quarters with earnings above the +25% guideline makes it a solid match concerning the C criteria. Annual earnings growth (A criteria) has been strong. Its Relative Strength rating of 96 is now well above the 80+ minimum guideline for buy candidates.
It completed Secondary Offerings 8/30/13 and 9/17/13. The number of top-rated funds owning its shares rose from 254 in Dec '13 to 349 Mar '15, a reassuring sign concerning the I criteria. Its small supply of only 37.2 million shares (S criteria) in the pubic float can contribute to greater volatility in the event of institutional buying or selling.
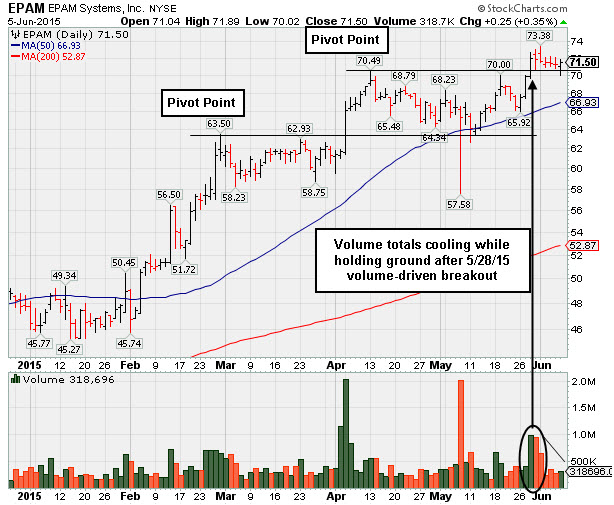
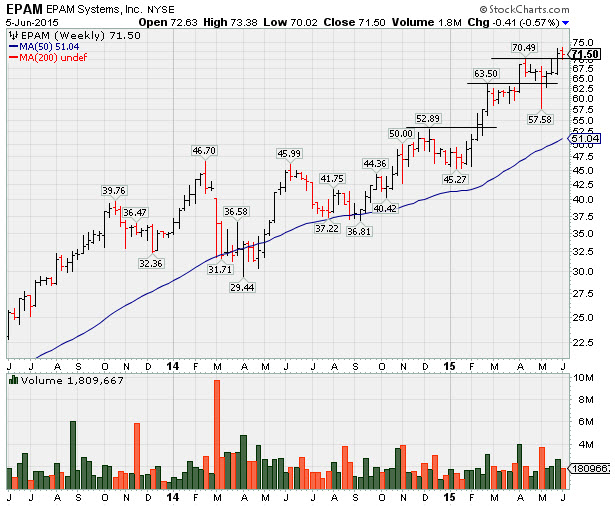
Volume Totals Cooling While Consolidating After Breakout - Friday, June 5, 2015
Epam Systems Inc (EPAM +$.025 or +0.35% to $71.50) has seen volume totals cooling while stubbornly holding its ground near its 52-week high. That is a sign that few investors have headed for the exit following its recent technical breakout, meanwhile, it remains below its "max buy level.
A big gain on 5/28/15 backed by +117% above average volume as it rallied above its pivot point triggered a new (or add-on) technical buy signal. Three pivot points were identified this year thus far, and the most recent was cited on 5/18/15 based on its 4/13/15 high plus 10 cents. Prior highs in the $70 area define initial support. The next important support is defined by its 50-day moving average DMA line ($66.93). Damaging losses leading to violations would raise greater concerns and trigger a technical sell signal.
It reported earnings +33%, +40%, +29%, and +30% in the Jun, Sep, Dec '14 and Mar '15 quarterly comparisons versus the year ago periods, respectively. Sales revenues rose +31%, +38%, +28% and +25% during that span. Its streak of 6 consecutive quarters with earnings above the +25% guideline makes it a solid match concerning the C criteria. Annual earnings growth (A criteria) has been strong. Its Relative Strength rating of 96 is now well above the 80+ minimum guideline for buy candidates.
It completed Secondary Offerings 8/30/13 and 9/17/13. Its Up/Down Volume ratio of 1.4 is an unbiased indication its shares have been under accumulation over the past 50 days. The number of top-rated funds owning its shares rose from 254 in Dec '13 to 349 Mar '15, a reassuring sign concerning the I criteria. Its small supply of only 37.2 million shares (S criteria) in the pubic float can contribute to greater volatility in the event of institutional buying or selling.
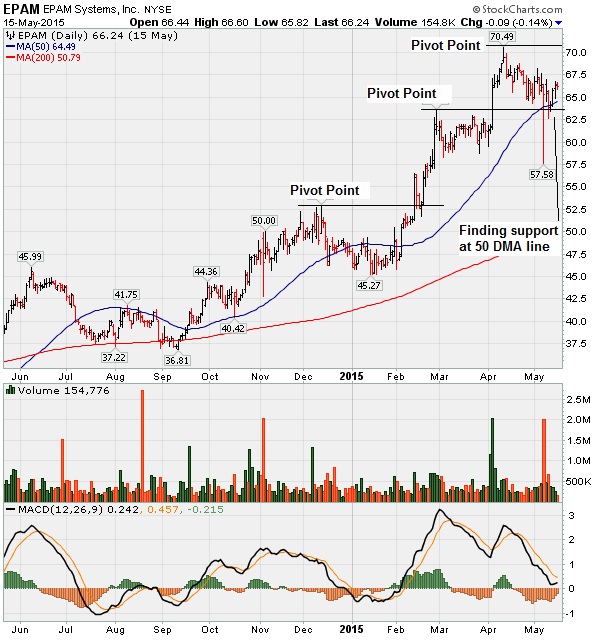
Consolidating Above Support at Prior Highs and 50-Day Moving Average - Friday, May 15, 2015
Epam Systems Inc (EPAM -$.0.09 or -0.14% to $66.24) has been finding support near its 50-day moving average (DMA) line ($64.07). Subsequent violations of the 50 DMA line and recent lows would raise concerns and trigger technical sell signals. The annotated graph below shows two prior pivot points which were identified, and a new pivot point which was cited on 5/18/15 based on its 4/13/15 high plus 10 cents.
EPAM was last shown in this FSU section on 4/28/15 with annotated graphs under the headline, "Consolidating Following Latest Volume-Driven Breakout". The high-ranked Computer - Tech Services firm reported earnings +33%, +40%, +29%, and +30% in the Jun, Sep, Dec '14 and Mar '15 quarterly comparisons versus the year ago periods, respectively. Sales revenues rose +31%, +38%, +28% and +25% during that span. Its streak of 6 consecutive quarters with earnings above the +25% guideline makes it a solid match concerning the C criteria. Annual earnings growth (A criteria) has been strong. Its Relative Strength rating of 95 is now well above the 80+ minimum guideline for buy candidates.
It completed Secondary Offerings 8/30/13 and 9/17/13. Its Up/Down Volume ratio of 1.7 is an unbiased indication its shares have been under accumulation over the past 50 days. The number of top-rated funds owning its shares rose from 254 in Dec '13 to 342 Mar '15, a reassuring sign concerning the I criteria. Its small supply of only 37.1 million shares (S criteria) in the pubic float can contribute to greater volatility in the event of institutional buying or selling. The annotated graph below shows it consolidating
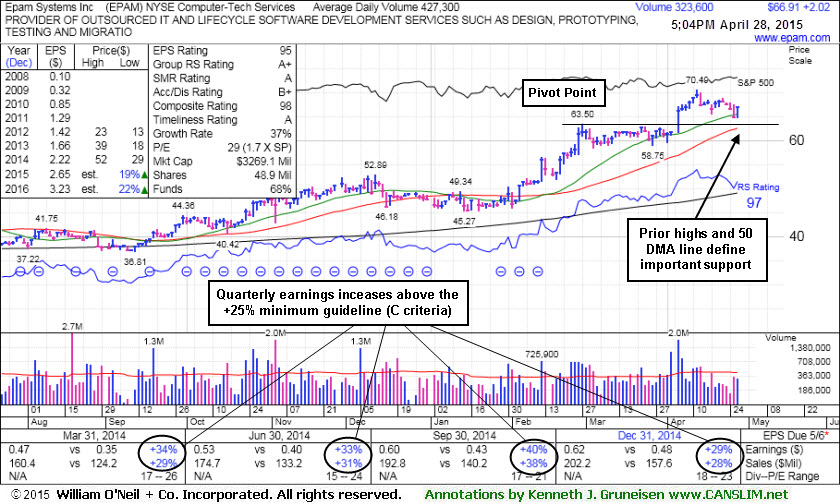
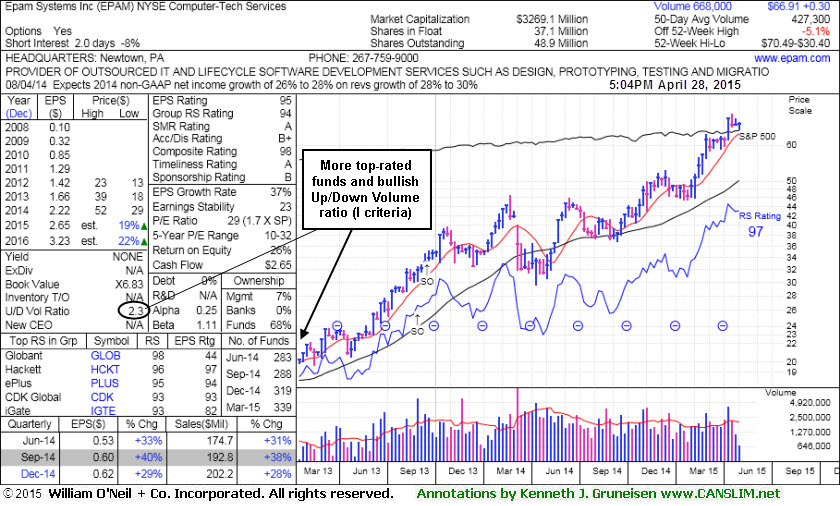
Consolidating Following Latest Volume-Driven Breakout - Tuesday, April 28, 2015
Epam Systems Inc (EPAM +$2.02 or +3.11% to $66.91) rallied with below average volume and finished the session back above its "max buy" level. Prior highs in the $63.50 area define near-term support above its 50-day moving average (DMA) line ($62.53). Subsequent violations would raise concerns and trigger technical sell signals.
EPAM is due to report first-quarter 2015 results after the market closes on Wednesday, May 6, 2015. Keep in mind that volume and volatility often increase near earnings news. Its last appearance in the FSU section was on 4/07/15 with annotated graphs under the headline, "Fresh Breakout Again Had Look of Institutional Demand". On 3/27/15 a new pivot point had been cited based on its 2/27/15 high plus 10 cents, as a new base of sufficient length had formed.
The high-ranked Computer - Tech Services firm reported Dec '14 earnings +29% on +28% sales revenues. Its 5 consecutive quarters with earnings above the +25% guideline makes it a solid match concerning the C criteria. Annual earnings growth (A criteria) has been strong. Its Relative Strength rating of 97 is now well above the 80+ minimum guideline for buy candidates. Its Relative Strength line (the jagged blue line) has also been hitting new all-time highs.
It completed Secondary Offerings 8/30/13 and 9/17/13. Its Up/Down Volume ratio of 2.3 is an unbiased indication its shares have been under accumulation over the past 50 days. The number of top-rated funds owning its shares rose from 254 in Dec '13 to 339 Mar '15, a reassuring sign concerning the I criteria. Its small supply of only 37.1 million shares (S criteria) in the pubic float can contribute to greater volatility in the event of institutional buying or selling.
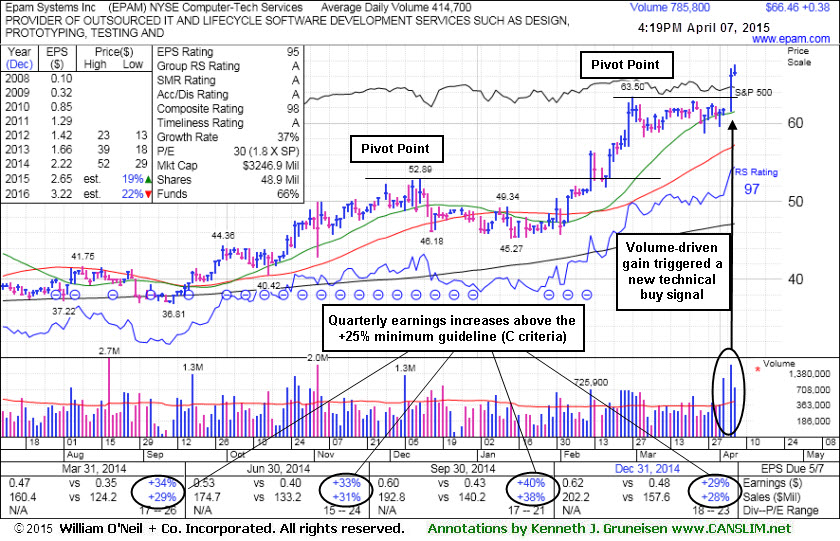
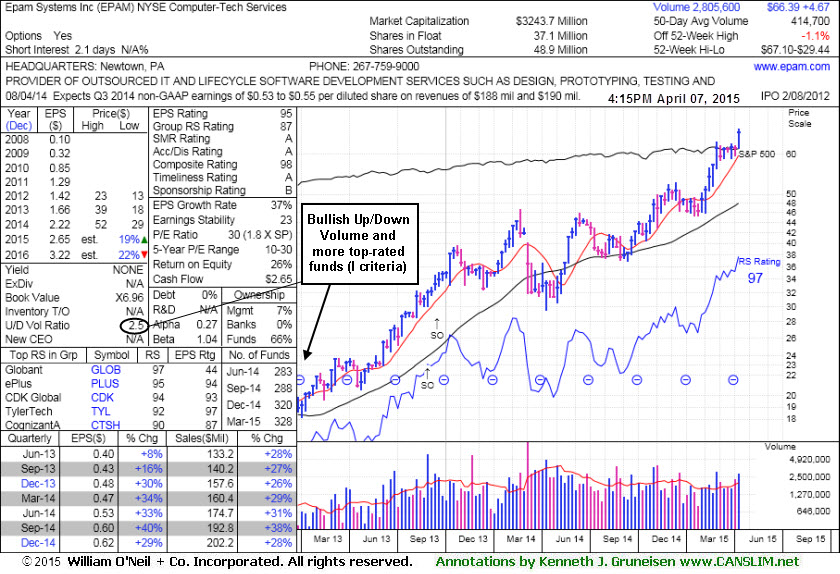
Fresh Breakout Again Had Look of Institutional Demand - Tuesday, April 07, 2015
Epam Systems Inc (EPAM +$0.42 or +0.64% to $66.49) hit another new 52-week high and traded near its "max buy" level ($66.78) today. It broke out on the prior session with 5 times average volume while rallying above the pivot point triggering a new (or add-on) technical buy signal. Its 50-day moving average (DMA) line ($57.27) defines near-term support to watch on pullbacks.
On 3/27/15 a new pivot point was cited based on its 2/27/15 high plus 10 cents, as a new base of sufficient length had formed following its appearance in the 3/18/15 FSU section with annotated graphs under the headline, "Hovering Near Highs Extended From Prior Base". The latest action again has the look of serious institutional buying demand, however, after quick gains it is almost too extended from the prior base to be considered buyable under the fact-based investment system's guidelines.
The high-ranked Computer - Tech Services firm reported Dec '14 earnings +29% on +28% sales revenues. Its 5 consecutive quarters with earnings above the +25% guideline makes it a solid match concerning the C criteria. Annual earnings growth (A criteria) has been strong. Its Relative Strength rating of 97 is now well above the 80+ minimum guideline for buy candidates. Its Relative Strength line (the jagged blue line) has also been hitting new all-time highs.
It completed Secondary Offerings 8/30/13 and 9/17/13. Its Up/Down Volume ratio of 2.5 is an unbiased indication its shares have been under accumulation over the past 50 days. The number of top-rated funds owning its shares rose from 254 in Dec '13 to 328 Dec '14, a reassuring sign concerning the I criteria. Its small supply of only 37.1 million shares (S criteria) in the pubic float can contribute to greater volatility in the event of institutional buying or selling.
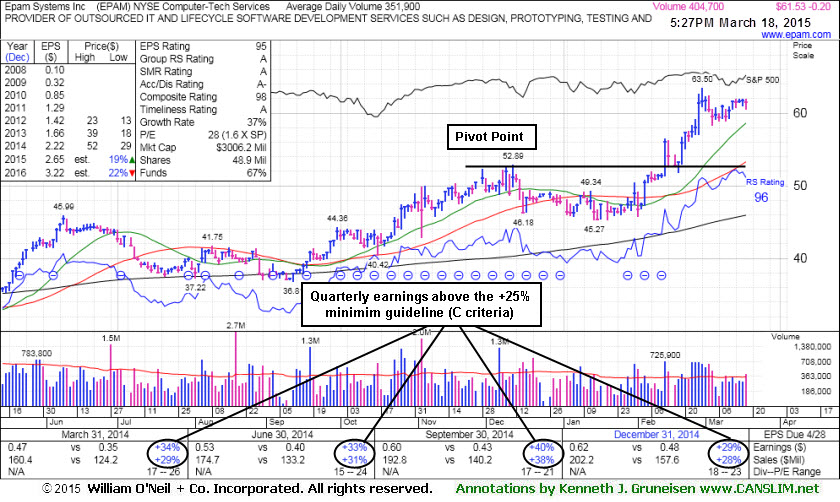
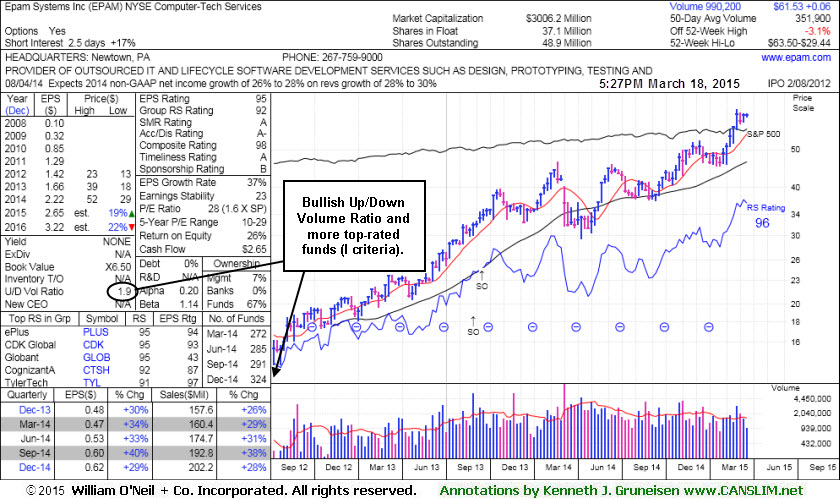
Hovering Near Highs Extended From Prior Base - Wednesday, March 18, 2015
Epam Systems Inc (EPAM -$0.20 or -5.81% to $61.53) has been stubbornly holding its ground near its 52-week high. Recent action had the look of serious institutional buying demand, however, it is too extended from the prior base to be considered buyable under the fact-based investment system's guidelines. Its 50-day moving average (DMA) line and prior highs in the $52 area define support to watch on pullbacks.
The high-ranked Computer - Tech Services firm reported Dec '14 earnings +29% on +28% sales revenues. Its 5 consecutive quarters with earnings above the +25% guideline makes it a solid match concerning the C criteria. Annual earnings growth (A criteria) has been strong. EPAM was last shown in this FSU section on 2/26/15 with annotated graphs under the headline, "Extended From Base Following Volume Driven Gains". Its Relative Strength rating of 96 is now well above the 80+ minimum guideline for buy candidates. Its Relative Strength line (the jagged blue line) has also been hitting new all-time highs.
It completed Secondary Offerings 8/30/13 and 9/17/13. Its Up/Down Volume ratio of 1.9 is an unbiased indication its shares have been under accumulation over the past 50 days. The number of top-rated funds owning its shares rose from 254 in Dec '13 to 324 Dec '14, a reassuring sign concerning the I criteria. Its small supply of only 37.1 million shares (S criteria) in the pubic float can contribute to greater volatility in the event of institutional buying or selling.
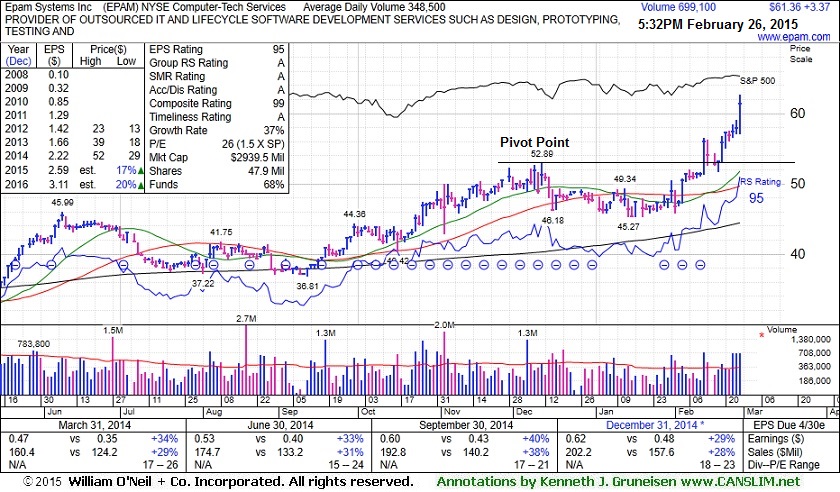
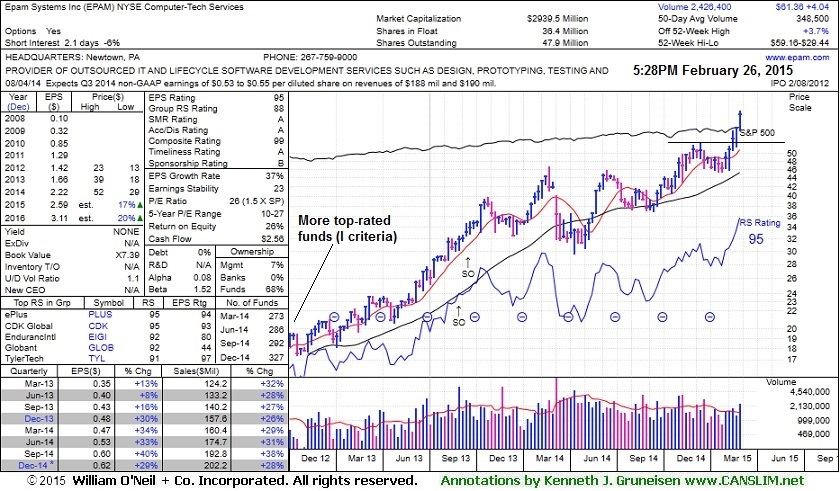
Extended From Base Following Volume Driven Gains - Thursday, February 26, 2015
Epam Systems Inc (EPAM +$3.37 or +5.81% to $61.36) hit another new 52-week high with today's 3rd consecutive gain on above average volume. The recent action has the look of serious institutional buying demand, however, it is getting too extended from the prior base to be considered buyable under the fact-based investment system's guidelines. Prior highs in the $52 area define support to watch on pullbacks.
The high-ranked Computer - Tech Services firm reported Dec '14 earnings +29% on +28% sales revenues. Its 5 consecutive quarters with earnings above the +25% guideline makes it a solid match concerning the C criteria. Annual earnings growth (A criteria) has been strong. EPAM was last shown in this FSU section on 2/05/15 with annotated graphs under the headline, "New Pivot Point Cited While Rebounding Near Prior Highs". Its Relative Strength rating of 95 is now well above the 80+ minimum guideline for buy candidates. Its Relative Strength line (the jagged blue line) has also been hitting new all-time highs.
It completed Secondary Offerings 8/30/13 and 9/17/13. The number of top-rated funds owning its shares rose from 254 in Dec '13 to 327 Dec '14, a reassuring sign concerning the I criteria. Its small supply of only 36.4 million shares (S criteria) can contribute to greater volatility in the event of institutional buying or selling.
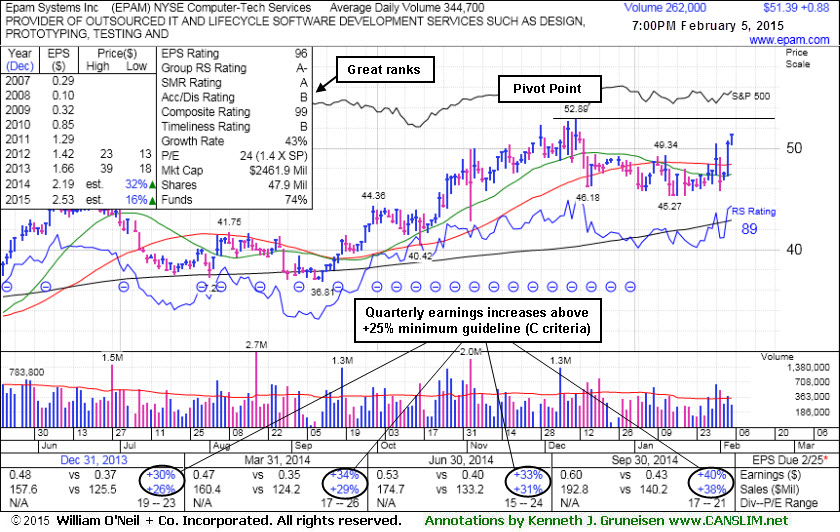
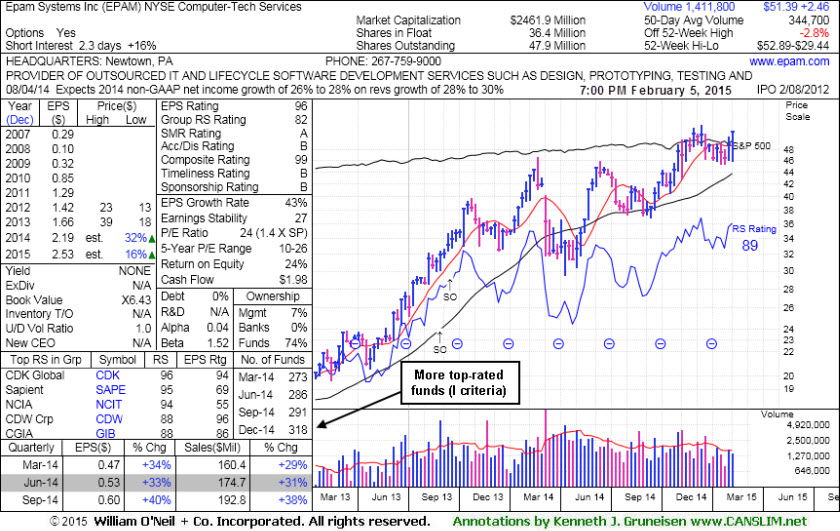
New Pivot Point Cited While Rebounding Near Prior Highs - Thursday, February 05, 2015
Epam Systems Inc (EPAM +$0.88 or +1.74% to $51.39) rebounded further above its 50-day moving average (DMA) line helping its technical stance improve. A new pivot point is cited based upon its 12/11/14 high plus 10 cents. Little overhead supply remains up through the $52 level, however, disciplined investors will watch for fresh proof of serious institutional buying demand before taking action.
The high-ranked Computer - Tech Services firm was last shown in this FSU section on 1/21/15 with annotated graphs under the headline, "Recovery Above 50-Day Average Needed for Outlook to Improve". Following recent gains its Relative Strength rating of 89 is now well above the 80+ minimum guideline for buy candidates. However, its Relative Strength line (the jagged blue line) peaked a bit higher in December. Historic studies have found that it is a better sign to see a stock's Relative Strength line hitting new all-time highs and leading the way before its share price moves into new high territory.
EPAM reported earnings +40% on +38% sales revenues for the Sep '14 quarter and also gave upbeat sales guidance. It had previously reported earnings +33% on +31% sales revenues for the Jun '14 quarter. Its 4 consecutive quarters with earnings above the +25% guideline makes it a solid match concerning the C criteria. Annual earnings growth (A criteria) has been strong.
It completed Secondary Offerings 8/30/13 and 9/17/13. The number of top-rated funds owning its shares rose from 254 in Dec '13 to 318 in Dec '14, a reassuring sign concerning the I criteria. Its current Up/Down Volume Ratio of 1.0 is an unbiased indication that for the past 50 days its shares have been in neutral. Its small supply of only 36.4 million shares (S criteria) can contribute to greater volatility in the event of institutional buying or selling.
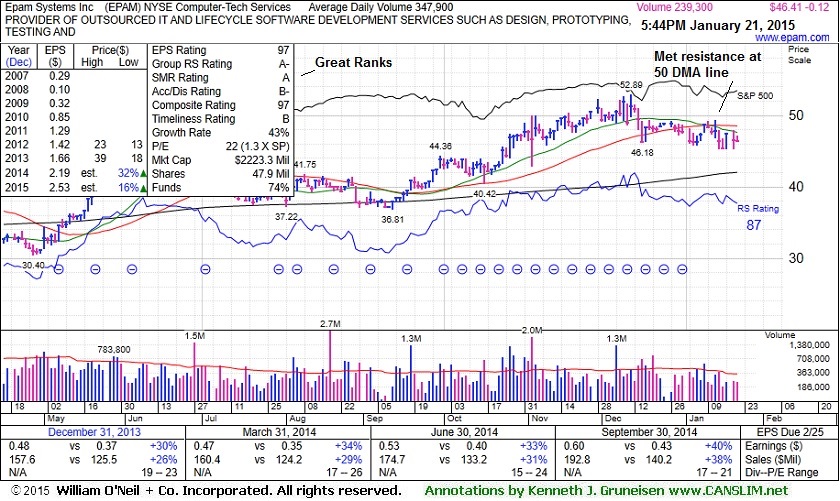
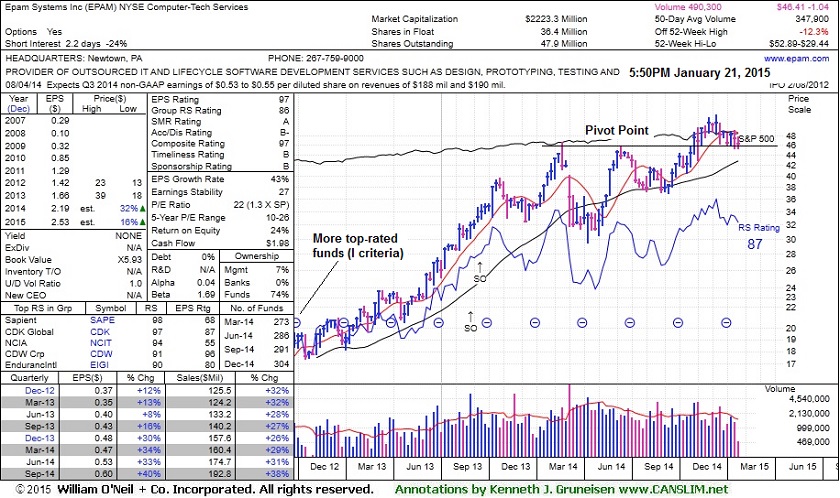
Recovery Above 50-Day Average Needed for Outlook to Improve - Wednesday, January 21, 2015
Epam Systems Inc's (EPAM -$0.12 or -0.26% to $46.41) latest gains have lacked great volume conviction and its Relative Strength rating has been waning in recent weeks. It was last shown in this FSU section on 12/31/14 with annotated graphs under the headline, "Halted Slide at 50-Day Moving Average", but the subsequent slump below prior highs in the $46 area raised concerns and triggered a more worrisome technical sell signal. A rebound above its 50-day moving average (DMA) line ($48.53) is still needed for its outlook to improve. However, that important short-term average recently acted as resistance, a discouraging sign.
The high-ranked Computer - Tech Services firm reported earnings +40% on +38% sales revenues for the Sep '14 quarter and also gave upbeat sales guidance. It had previously reported earnings +33% on +31% sales revenues for the Jun '14 quarter. Its 4 consecutive quarters with earnings above the +25% guideline makes it a solid match concerning the C criteria. Annual earnings growth (A criteria) has been strong.
It completed Secondary Offerings 8/30/13 and 9/17/13. The number of top-rated funds owning its shares rose from 254 in Dec '13 to 304 in Dec '14, a reassuring sign concerning the I criteria. Its current Up/Down Volume Ratio of 1.0 is an unbiased indication that for the past 50 days its shares have been in neutral. Its small supply of only 36.4 million shares (S criteria) can contribute to greater volatility in the event of institutional buying or selling.
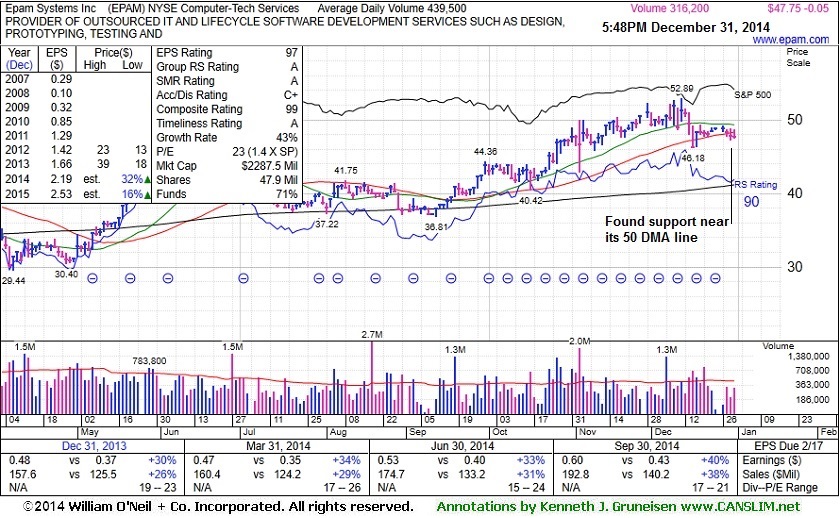
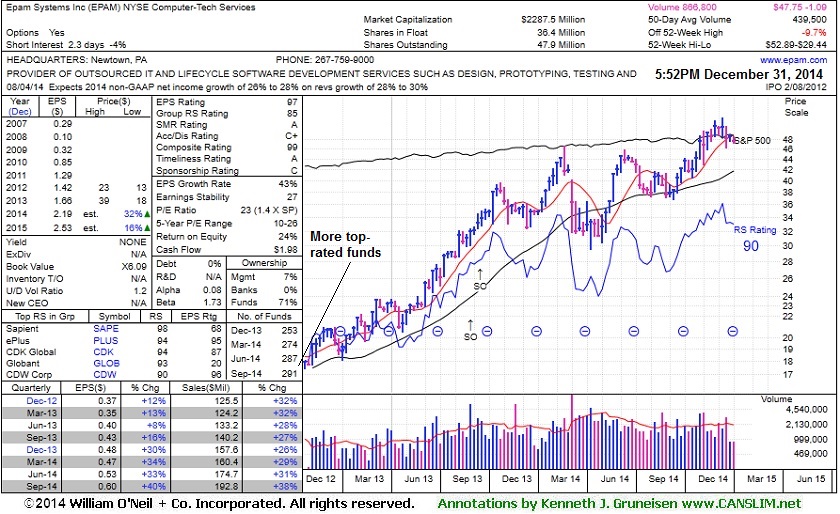
Halted Slide at 50-Day Moving Average - Wednesday, December 31, 2014
Epam Systems Inc (EPAM -$0.05 or -0.10% to $47.75) has been consolidating near its 50-day moving average (DMA) line, an important support level. Prior highs in the $46 area acted as support, and subsequent losses below recent lows would raise concerns and trigger a more worrisome technical sell signal. It halted its slide, but showed more signs of distributional pressure while gains lacked volume conviction after last shown in this FSU section on 12/16/14 with annotated graphs under the headline, "Violated 50-Day Moving Average Triggering Technical Sell Signal".
The high-ranked Computer - Tech Services firm reported earnings +40% on +38% sales revenues for the Sep '14 quarter and also gave upbeat sales guidance. It had previously reported earnings +33% on +31% sales revenues for the Jun '14 quarter. Its 4 consecutive quarters with earnings above the +25% guideline makes it a solid match concerning the C criteria. Annual earnings growth (A criteria) has been strong.
It completed Secondary Offerings 8/30/13 and 9/17/13. Its current Up/Down Volume Ratio of 1.2 is an unbiased indication its shares have been under accumulation in the past 50 days. The number of top-rated funds owning its shares rose from 254 in Dec '13 to 291 in Sep '14, a reassuring sign concerning the I criteria. Its small supply of only 36.4 million shares (S criteria) can contribute to greater volatility in the event of institutional buying or selling.
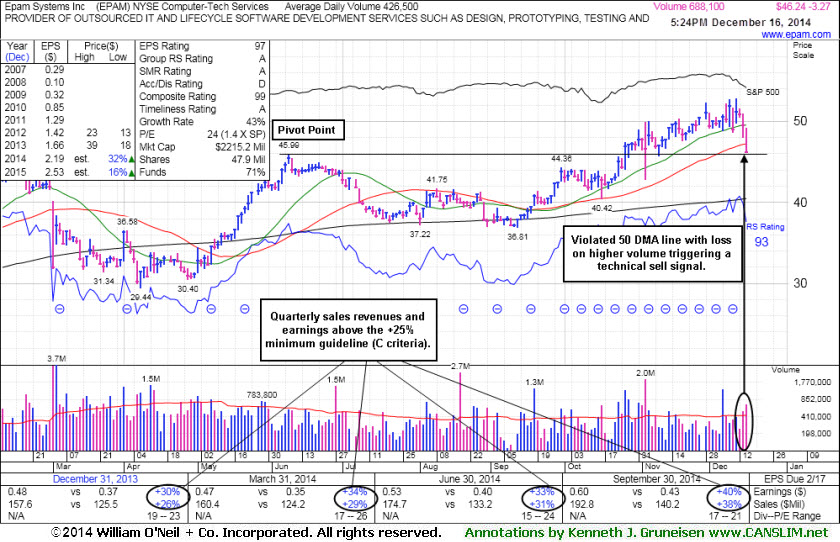
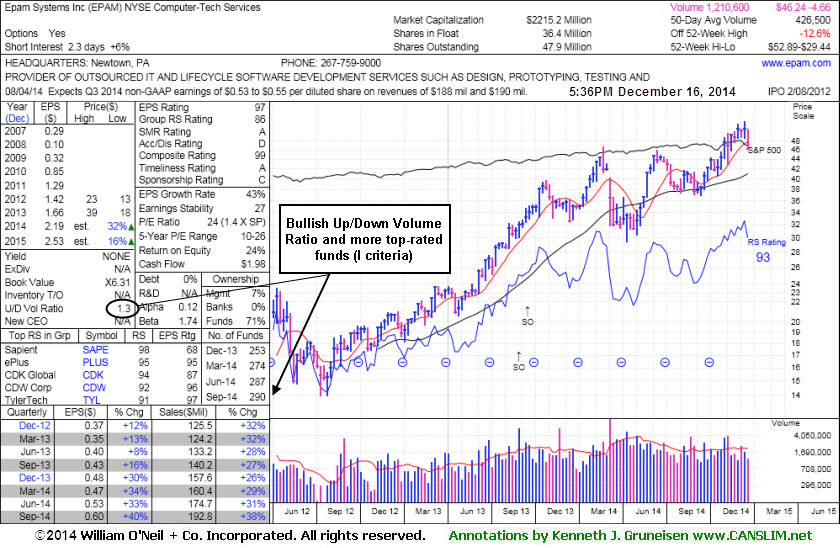
Violated 50-Day Moving Average Triggering Technical Sell Signal - Tuesday, December 16, 2014
Epam Systems Inc (EPAM -$3.27 or -6.60% to $46.24) endured more distributional pressure and violated its 50-day moving average (DMA) line with a volume-driven loss today raising concerns and triggering a technical sell signal. It is testing prior highs in the $45-46 area which define the next important near-term support to watch. More damaging losses would raise serious concerns, meanwhile, only a prompt rebound above the 50 DMA line may help its outlook improve.
It was last shown in this FSU section on 11/26/14 with annotated graphs under the headline, "Quiet Gain For New High Close". The high-ranked Computer - Tech Services firm reported earnings +40% on +38% sales revenues for the Sep '14 quarter and also gave upbeat sales guidance. It had previously reported earnings +33% on +31% sales revenues for the Jun '14 quarter. Its 4 consecutive quarters with earnings above the +25% guideline makes it a solid match concerning the C criteria. Annual earnings growth (A criteria) has been strong.
It completed Secondary Offerings 8/30/13 and 9/17/13. Its current Up/Down Volume Ratio of 1.3 is an unbiased indication its shares have been under accumulation in the past 50 days. The number of top-rated funds owning its shares rose from 254 in Dec '13 to 290 in Sep '14, a reassuring sign concerning the I criteria. Its small supply of only 36.4 million shares (S criteria) can contribute to greater volatility in the event of institutional buying or selling.
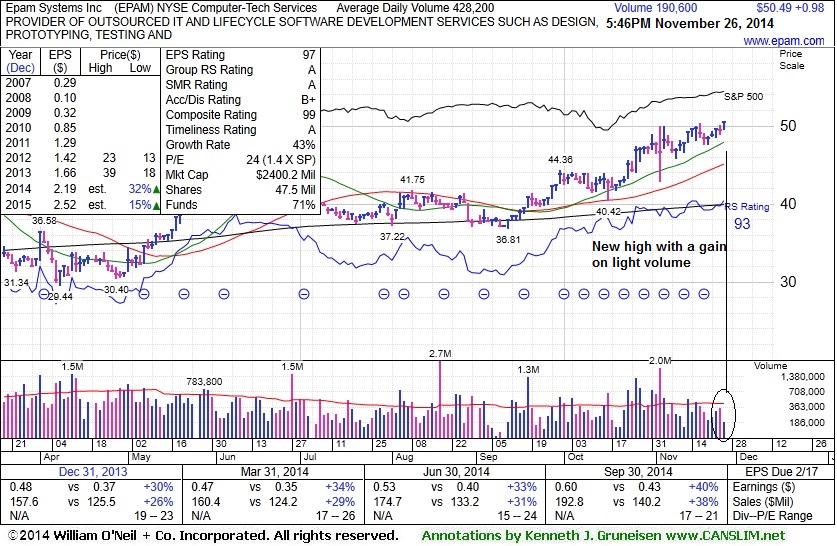
Quiet Gain For New High Close - Wednesday, November 26, 2014
Epam Systems Inc (EPAM +$0.98 or +1.98% to $50.49) quietly rose for a new high close. It has been stubbornly holding its ground above its "max buy" level with volume totals cooling. Prior highs in the $44 area define initial support above its 50-day moving average (DMA) line.
It was last shown in this FSU section on 11/11/14 with annotated graphs under the headline, "Consolidating Above Prior Highs Following Technical Breakout". The high-ranked Computer - Tech Services firm reported earnings for the Sep '14 quarter above views (not yet shown on the chart as of today) and also gave upbeat sales guidance for the current quarter. It had previously reported earnings +33% on +31% sales revenues for the Jun '14 quarter, a 3rd consecutive quarter with earnings above the +25% guideline, making it a better match concerning the C criteria. Annual earnings growth (A criteria) has been strong.
It completed Secondary Offerings 8/30/13 and 9/17/13. Its current Up/Down Volume Ratio of 1.6 is an unbiased indication its shares have been under accumulation in the past 50 days. The number of top-rated funds owning its shares rose from 254 in Dec '13 to 288 in Sep '14, a reassuring sign concerning the I criteria. Its small supply of only 36.1 million shares (S criteria) can contribute to greater volatility in the event of institutional buying or selling.
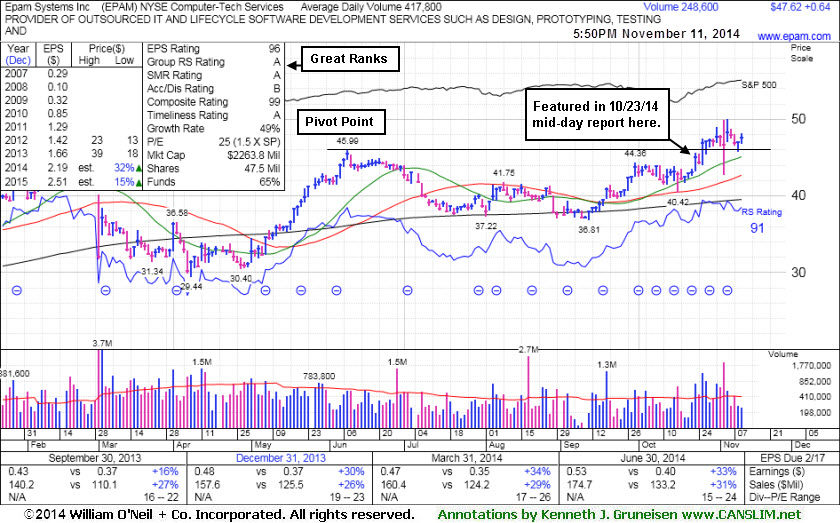
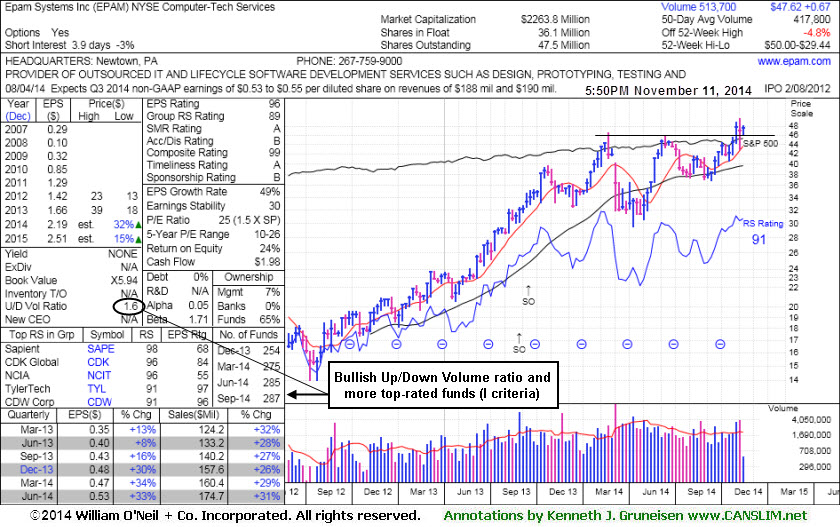
Consolidating Above Prior Highs Following Technical Breakout - Tuesday, November 11, 2014
Epam Systems Inc (EPAM +$0.64 or +1.36% to $47.62) has been quietly holding its ground after retesting prior highs in the $44 area defining initial support above its 50-day moving average (DMA) line ($42.70). Subsequent losses leading to a close below its old high close ($45.51 on 6/09/14) would raise concerns while completely negating the recent technical breakout.
It was last shown in this FSU section on 10/24/14 with annotated graphs under the headline, "Pulled Back After Challenging Prior Highs", after highlighted in yellow in the 10/23/14 mid-day report (read here). Subsequent volume-driven gains above the pivot point cited triggered a technical buy signal.
The high-ranked Computer - Tech Services firm reported earnings for the Sep '14 quarter above views (not yet shown on the chart as of today) and also gave upbeat sales guidance for the current quarter. It had previously reported earnings +33% on +31% sales revenues for the Jun '14 quarter, a 3rd consecutive quarter with earnings above the +25% guideline, making it a better match concerning the C criteria. Annual earnings growth (A criteria) has been strong.
It completed Secondary Offerings 8/30/13 and 9/17/13. Its current Up/Down Volume Ratio of 1.6 is an unbiased indication its shares have been under accumulation in the past 50 days. The number of top-rated funds owning its shares rose from 254 in Dec '13 to 287 in Sep '14, a reassuring sign concerning the I criteria. Its small supply of only 36.1 million shares (S criteria) can contribute to greater volatility in the event of institutional buying or selling.
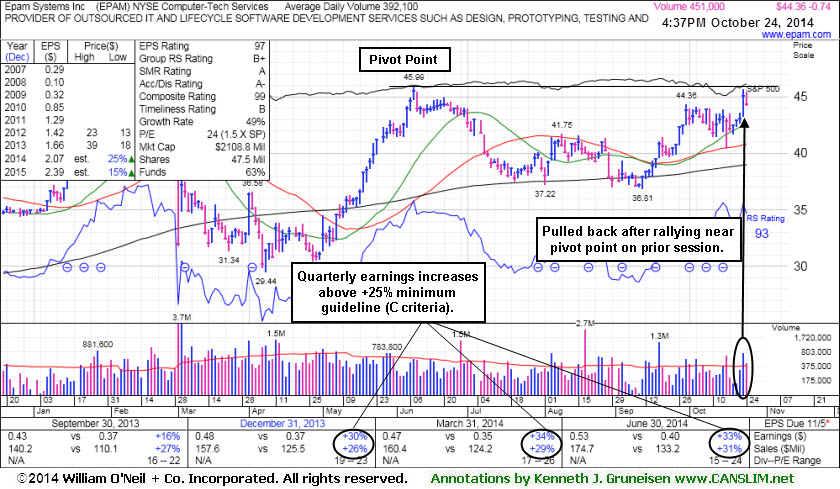
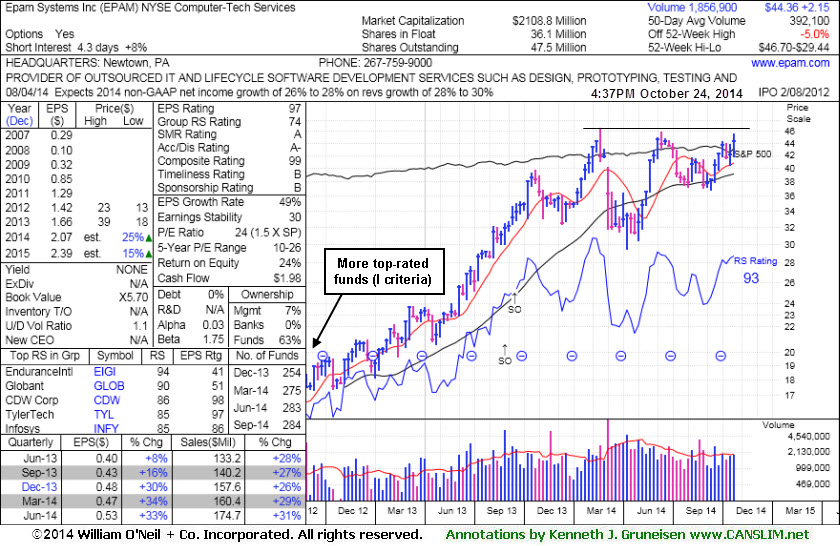
Pulled Back After Challenging Prior Highs - Friday, October 24, 2014
Epam Systems Inc (EPAM -$0.74 or -1.64% to $44.36) pulled back today. It was highlighted in yellow with pivot point cited based on its 6/09/14 high plus 10 cents in the 10/23/14 mid-day report (read here). It challenged prior highs and approached its 52-week high with a solid gain backed by 2 times average volume. Subsequent volume-driven gains above the pivot point may trigger a technical buy signal.
Keep in mind that the high-ranked Computer - Tech Services firm is due to report earnings for the Sep '14 quarter on 11/04/14. Volume and volatility often increase near earnings news. It reported earnings +33% on +31% sales revenues for the Jun '14 quarter, a 3rd consecutive quarter with earnings above the +25% guideline, making it a better match concerning the C criteria. Annual earnings growth (A criteria) has been strong.
It completed Secondary Offerings 8/30/13 and 9/17/13. The number of top-rated funds owning its shares rose from 254 in Dec '13 to 284 in Sep '14, a reassuring sign concerning the I criteria. Its small supply of only 36.1 million shares (S criteria) can contribute to greater volatility in the event of institutional buying or selling.