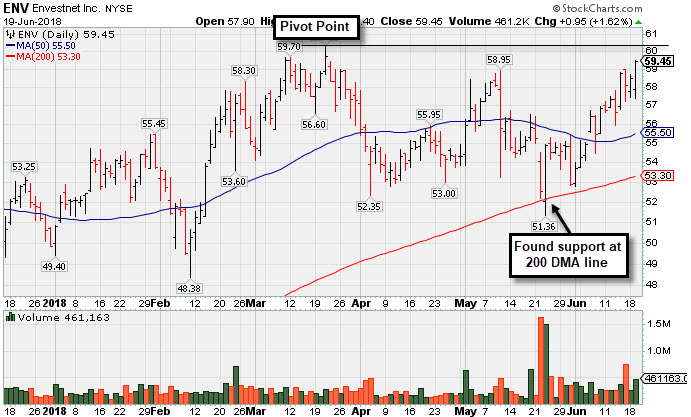
Technical Damage Mounts Ahead of Next Quarterly Report - Monday, August 5, 2019
Envestnet Inc (ENV -$2.48 or -3.64% to $65.63) gapped down today and its 6th consecutive loss is tested prior lows in the $65-66 area defining important support. It violated its 50-day moving average (DMA) line and triggered a technical sell signal last week.
ENV is due to report second quarter financial results on Wednesday, August 7, 2019 after the close. Fundamental concerns were raised after it reported earnings +5% on +1% sales revenues for the Mar '19 quarter. That report broke a streak to 8 consecutive quarterly comparisons above the +25% minimum earnings guideline (C criteria). Annual earnings growth was flat in FY '16 but it has otherwise been strong. It still has a 92 Earnings Per Share Rating.
The high-ranked Financial Services - Specialty firm was last shown in this FSU section on 7/02/19 with an annotated graph under the headline, "Rebounded Above 50-Day Moving Average Line". It was highlighted in yellow with pivot point cited based on its 9/14/18 high plus 10 cents in the 3/15/19 mid-day report (read here).
The number of top-rated funds owning its shares rose from 284 in Jun '17 to 374 in Jun '19, a reassuring sign concerning the I criteria. Its current Up/Down Volume Ratio of 1.1 is an unbiased indication its shares have been under slight accumulation over the past 50 days. It has Timeliness Rating of A and Sponsorship Rating of C.
Charts courtesy of www.stockcharts.com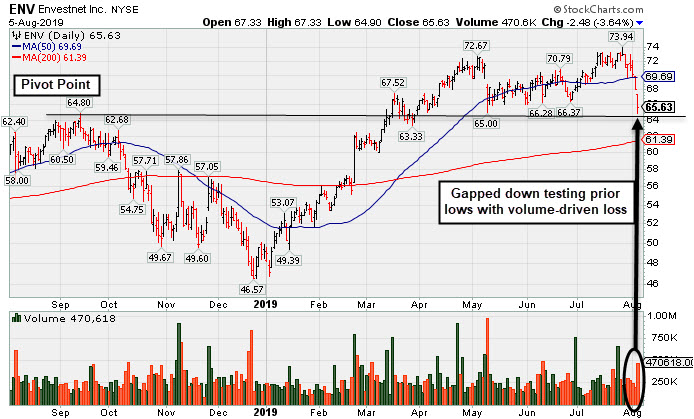
Rebounded Above 50-Day Moving Average Line -
Envestnet Inc (ENV +$1.09 or +1.59% to $69.48) rebounded above its 50-day moving average (DMA) line ($68.94) with today's 4th consecutive gain. Prior lows in the $65-66 area define the next important near-term support to watch.
Recently it reported earnings +5% on +1% sales revenues for the Mar '19 quarter, below the +25% minimum earnings guideline (C criteria). That report broke a streak to 8 consecutive quarterly comparisons above the +25% minimum earnings guideline (C criteria). Annual earnings growth was flat in FY '16 but it has otherwise been strong. It still has a 91 Earnings Per Share Rating.
The high-ranked Financial Services - Specialty firm was last shown in this FSU section on 6/04/19 with an annotated graph under the headline, "Rebound Above 50-Day Moving Average Improved Technical Stance". It was highlighted in yellow with pivot point cited based on its 9/14/18 high plus 10 cents in the 3/15/19 mid-day report (read here).
The number of top-rated funds owning its shares rose from 284 in Jun '17 to 387 in Mar '19, a reassuring sign concerning the I criteria. Its current Up/Down Volume Ratio of 1.4 is an unbiased indication its shares have been under accumulation over the past 50 days. It has Timeliness Rating of A and Sponsorship Rating of C.
Charts courtesy of www.stockcharts.com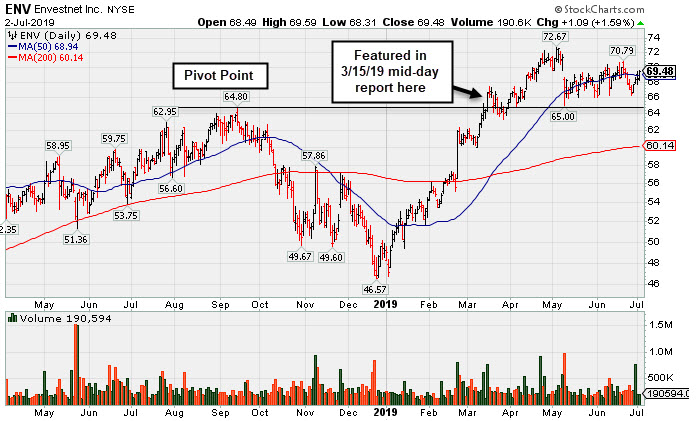
Rebound Above 50-Day Moving Average Improved Technical Stance - Tuesday, June 4, 2019
Envestnet Inc (ENV +$2.62 or +3.95% to $68.90) posted a solid gain today and rebounded above its 50-day moving average (DMA) line ($68.27), helping its technical stance improve. During the latest consolidation it stayed above the prior high ($64.80 on 9/14/18) which defines important near-term support to watch.
Volume and volatility often increase near earnings news. Weak action came after recently reporting earnings +5% on +1% sales revenues for the Mar '19 quarter, below the +25% minimum earnings guideline (C criteria). That report broke a streak to 8 consecutive quarterly comparisons above the +25% minimum earnings guideline (C criteria). Annual earnings growth was flat in FY '16 but it has otherwise been strong. It still has a 91 Earnings Per Share Rating.
The high-ranked Financial Services - Specialty firm was last shown in this FSU section on 4/24/19 with an annotated graph under the headline, "Negative Reversal After Another New High". It finished strong after was highlighted in yellow with pivot point cited based on its 9/14/18 high plus 10 cents in the 3/15/19 mid-day report (read here).
The number of top-rated funds owning its shares rose from 284 in Jun '17 to 386 in Mar '19, a reassuring sign concerning the I criteria. Its current Up/Down Volume Ratio of 1.5 is an unbiased indication its shares have been under accumulation over the past 50 days. It has Timeliness Rating of A and Sponsorship Rating of C.
Charts courtesy of www.stockcharts.com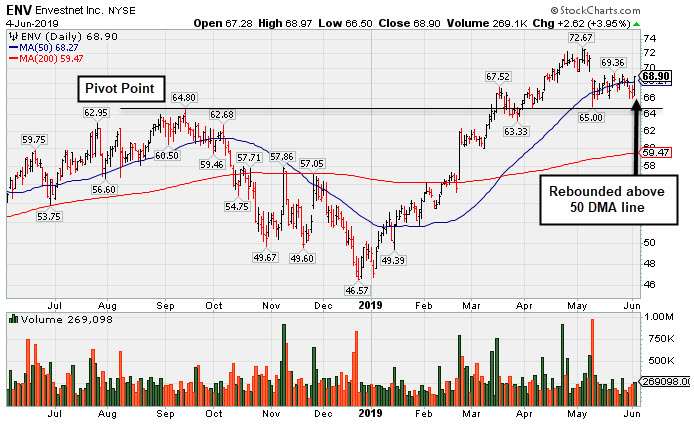
Negative Reversal After Another New High - Wednesday, April 24, 2019
Envestnet Inc (ENV -$0.38 or -0.53% to $70.70) is extended from the prior base and touched another new all-time high today, however, it reversed and ended the session in the red. The recent low ($63.34 on 3/27/19) and 50-day moving average (DMA) line ($63.95) define near-term support to watch on pullbacks.
Keep in mind it is due to report earnings news on May 7th. Volume and volatility often increase near earnings news. It reported earnings +53% on +15% sales revenues for the Dec '18 quarter, which extended its streak to 8 consecutive quarterly comparisons above the +25% minimum earnings guideline (C criteria). It has a 97 Earnings Per Share rating. Fundamentals remained strong while it went through a choppy consolidation below its 200 DMA line since dropped from the Featured Stocks list on 10/15/18.
The high-ranked Financial Services - Specialty firm was last shown in this FSU section on 3/15/19 with an annotated graph under the headline, "Volume Heavy Behind Rally to New Highs". It finished strong after was highlighted in yellow with pivot point cited based on its 9/14/18 high plus 10 cents in the 3/15/19 mid-day report (read here). Annual earnings growth was flat in FY '16 but it has otherwise been strong.
The number of top-rated funds owning its shares rose from 284 in Jun '17 to 369 in Mar '19, a reassuring sign concerning the I criteria. Its current Up/Down Volume Ratio of 2.0 is an unbiased indication its shares have been under accumulation over the past 50 days. It has Timeliness Rating of A and Sponsorship Rating of B.
Charts courtesy of www.stockcharts.com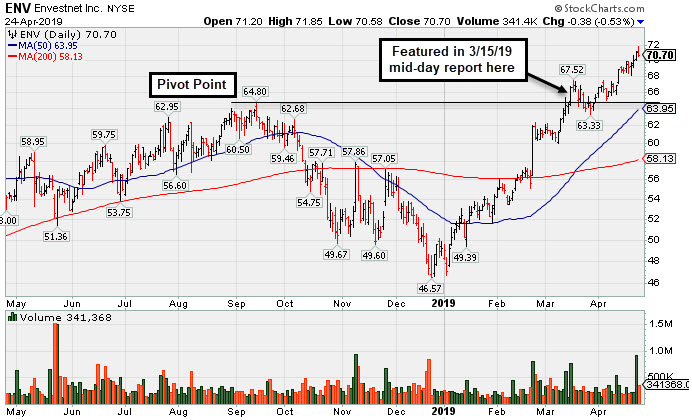
Volume Heavy Behind Rally to New Highs - Friday, March 15, 2019
Envestnet Inc (ENV +$2.16 or +3.35% to $66.64) finished strong after was highlighted in yellow with pivot point cited based on its 9/14/18 high plus 10 cents in the earlier mid-day report (read here). It hit a new 52-week high with +194% above average volume behind today's gain triggering a technical buy signal. Bullish action came after it reported earnings +53% on +15% sales revenues for the Dec '18 quarter, continuing its strong earnings track record. A streak of 8 consecutive quarterly comparisons above the +25% minimum earnings guideline (C criteria) helped it reach a 97 Earnings Per Share rating. Fundamentals remained strong while it went through a choppy consolidation below its 200 DMA line since dropped from the Featured Stocks list on 10/15/18.
The high-ranked Financial Services - Specialty firm was last shown in this FSU section on 9/21/18 with an annotated graph under the headline, "Found Recent Support at 50-Day Moving Average". Annual earnings growth was flat in FY '16 but it has otherwise been strong. The number of top-rated funds owning its shares rose from 284 in Jun '17 to 378 in Dec '18, a reassuring sign concerning the I criteria. Its current Up/Down Volume Ratio of 2.0 is an unbiased indication its shares have been under slight accumulation over the past 50 days. It has Timeliness Rating of A and Sponsorship Rating of B.
Charts courtesy of www.stockcharts.com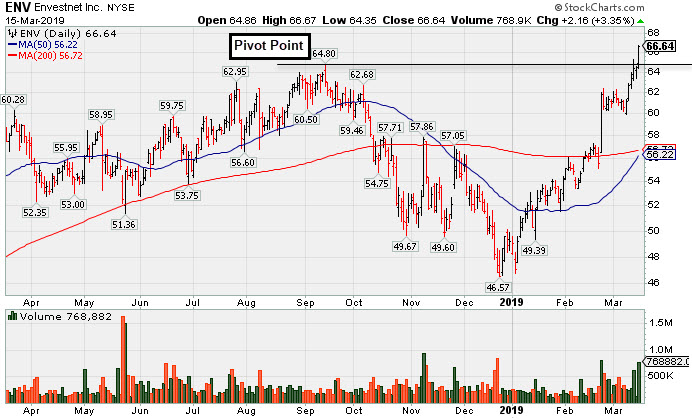
Found Recent Support at 50-Day Moving Average - Friday, September 21, 2018
Envestnet Inc (ENV -$1.25 or -2.00% to $61.40) found prompt support near its 50-day moving average (DMA )line ($60.85). It is still perched near its all-time high, stubbornly holding its ground in recent weeks. Fundamentals remain strong after it reported earnings +41% on +20% sales revenues foe the Jun '18 quarter, marking its 6th consecutive quarterly comparison above the +25% minimum earnings guideline (C criteria). It has earned a 96 Earnings Per Share rating.
ENV was highlighted in yellow with pivot point cited based on its 3/21/18 high plus 10 cents in the 6/15/18 mid-day report (readhere). The high-ranked Financial Services - Specialty firm was last shown in this FSU section on 8/06/18 with an annotated graph under the headline, "Earnings News Due for Financial Firm Perched Near High".
Annual earnings growth was flat in FY '16 but it has otherwise been strong. The number of top-rated funds owning its shares rose from 284 in Jun '17 to 372 in Jun '18, a reassuring sign concerning the I criteria. Its current Up/Down Volume Ratio of 1.3 is an unbiased indication its shares have been under slight accumulation over the past 50 days. It has Timeliness Rating of C and Sponsorship Rating of B.
Charts courtesy of www.stockcharts.com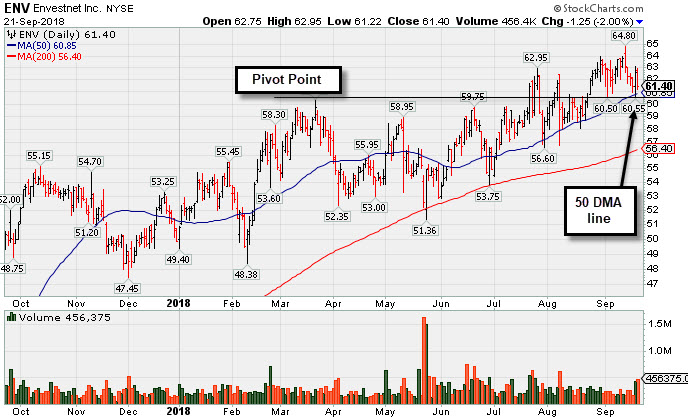
Earnings News Due for Financial Firm Perched Near High - Monday, August 6, 2018
Envestnet Inc (ENV +$0.85 or +1.42% to $60.90) has posted 5 consecutive gains with light volume since it managed a "positive reversal" on 7/31/18 after testing support near its 50-day moving average (DMA) line ($57.64). It endured distributional pressure after a volume-driven gain for a new high on 7/23/18 triggered a technical buy signal. The recent low ($53.75 on 6/28/18) and 200 DMA line define the next important near-term support.
Keep in mind it is due to report earnings news on Tuesday, August 7th after the close. Volume and volatility often increase near earnings news. ENV was highlighted in yellow with pivot point cited based on its 3/21/18 high plus 10 cents in the 6/15/18 mid-day report (read here). The high-ranked Financial Services - Specialty firm was last shown in this FSU section on 6/19/18 with an annotated graph under the headline, "Gain With Above Average Volume Challenged Prior High".
It has earned a 94 Earnings Per Share rating. Its report of +48% earnings on +25% sales revenues for the Mar '18 quarter marked its 5th consecutive quarterly comparison above the +25% minimum earnings guideline (C criteria). Annual earnings growth was flat in FY '16 but it has otherwise been strong.
The number of top-rated funds owning its shares rose from 284 in Jun '17 to 360 in Jun '18, a reassuring sign concerning the I criteria. Its current Up/Down Volume Ratio of 1.2 is an unbiased indication its shares have been under slight accumulation over the past 50 days. It has Timeliness Rating of B and Sponsorship Rating of B.
Charts courtesy of www.stockcharts.com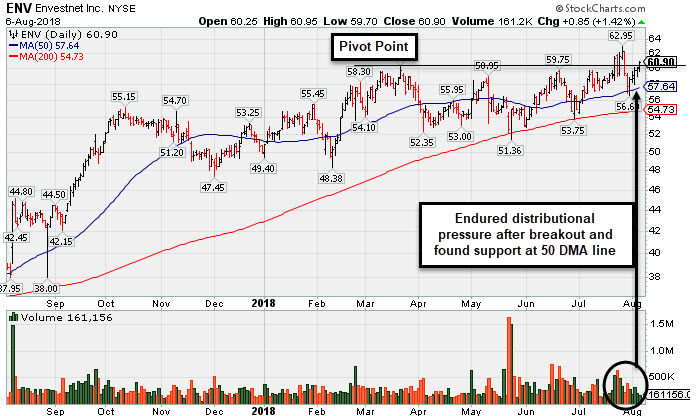
Gain With Above Average Volume Challenged Prior High - Tuesday, June 19, 2018
Envestnet Inc (ENV +$0.95 or +1.62% to $59.45) posted a gain today with +45% above average volume challenging its 52-week and all-time highs. It was highlighted in yellow with pivot point cited based on its 3/21/18 high plus 10 cents in the 6/15/18 mid-day report (read here). Subsequent volume-driven gains for new highs are needed to trigger a convincing technical buy signal. A recent rebound above the 50-day moving average (DMA) line helped its outlook improve after it found support at its 200 DMA line.
The high-ranked Financial Services - Specialty firm has earned a 95 Earnings Per Share rating. Its report of +48% earnings on +25% sales revenues for the Mar '18 quarter marked its 5th consecutive quarterly comparison above the +25% minimum earnings guideline (C criteria). Annual earnings growth was flat in FY '16 but it has otherwise been strong.
The number of top-rated funds owning its shares rose from 284 in Jun '17 to 356 in Mar '18, a reassuring sign concerning the I criteria. Its current Up/Down Volume Ratio of 1.2 is an unbiased indication its shares have been under accumulation over the past 50 days. It has Timeliness Rating of A and Sponsorship Rating of B.
Charts courtesy of www.stockcharts.com